

When we launch new products and features, it’s easy to immediately get hyper focused on the top line metrics.
Trial conversion is 7% and week 1 retention is 9% but average engagement with that star feature is very poor. How can we improve engagement?
What these average metrics don’t take into account is that your users are not all the same. There is no “average user”. They have their own idiosyncrasies and experience your product very differently:
- Most users download your product but never use it
- Some users try your product but never discover its value
- Others find their aha moment and fall in love!
These user personas are not surfaced in metrics like average conversion. To be able to understand exactly what patterns are driving your metrics – you need what we call . Behavioral Cohorting—a type of —helps you instantly create segments of users based on any combination of actions taken (or not) in the product. It has become the new standard in product and user insights because it helps you clearly correlate user actions with product outcomes. It’s how companies like Hubspot, PayPal and Twitter are building empathy with their users at scale.
In this post, we will define cohorts and behavioral cohorts, show you how to use them and provide a for putting them to use in your product.
First, what are cohorts?
Generally speaking, the term ‘cohort’ typically refers to an acquisition cohort: a group of users who all started using your product in the same time period (whether that’s a day, week, or month).
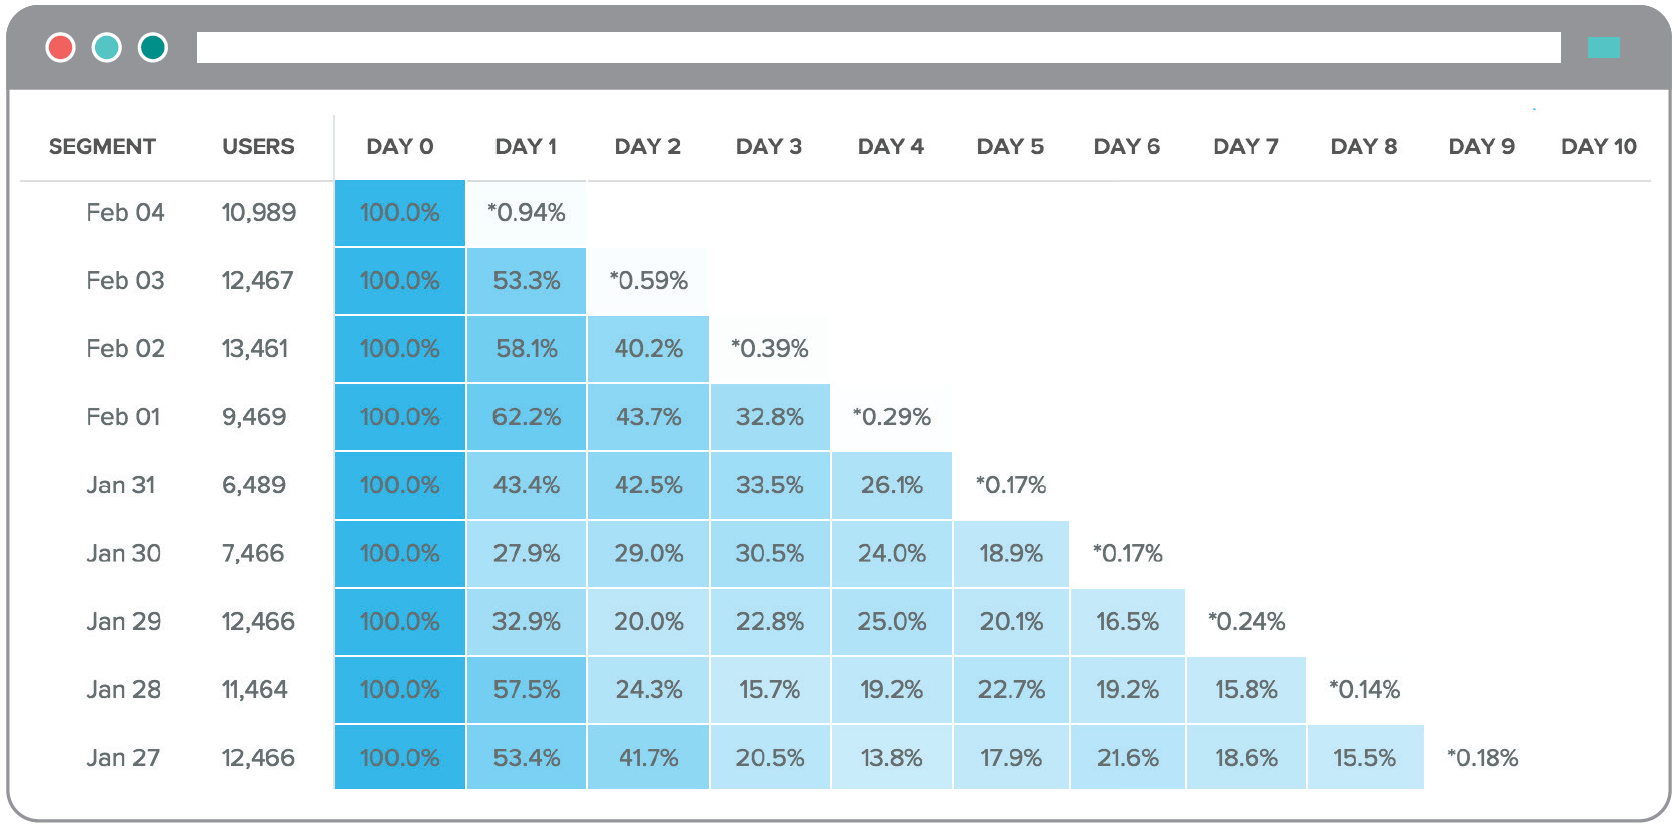
When people talk about ‘cohort analysis’, they usually mean measuring the retention of each acquisition cohort over time, which is often visualized like this:
Okay, so what are behavioral cohorts?
Knowing when a user started is important, but the actions they take in your app or website give you a much deeper understanding of your users and how they interact with your product. That’s where behavioral cohorts come in.
A behavioral cohort is a group of users that is defined based on actions they take in your product.
How do you start out defining a behavioral cohort? What are you trying to learn from your behavioral cohort analysis? We’ve created a worksheet to help you frame these questions and guide your cohort definition. .
Here’s an example.
Say you have a music streaming app. You’re interested in learning more about users who mark at least 3 songs as a ‘favorite’ on their first day in the app. Here’s how you would define that behavioral cohort in Amplitude:
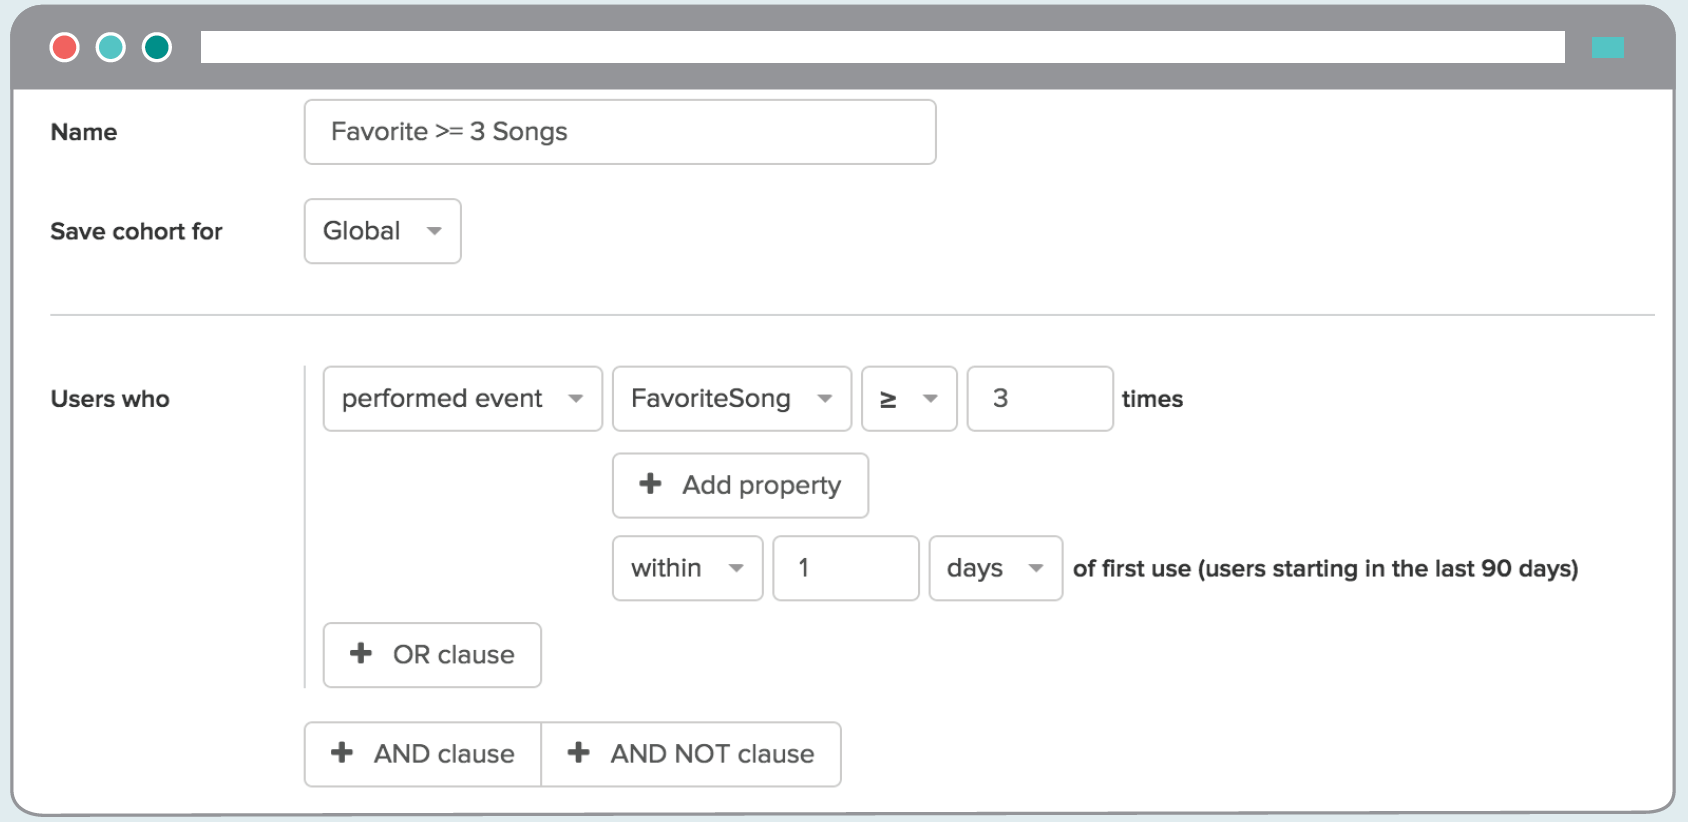
A behavioral cohort is a group of users defined by the actions they take in your product.
Nice, that was easy. Now what?
Once you save a behavioral cohort, you can apply it throughout Amplitude to learn more about how that .
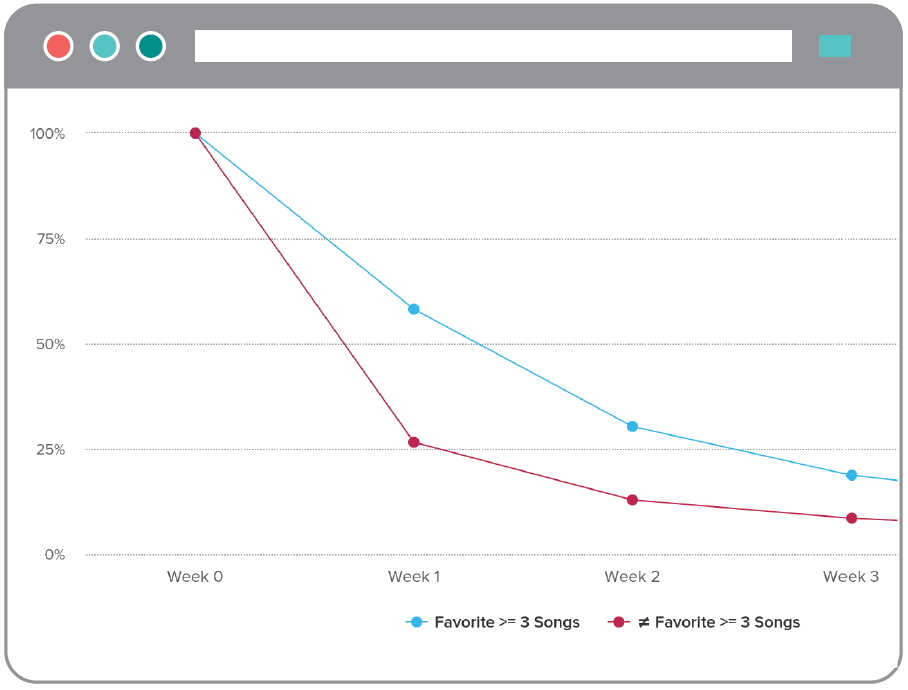
Let’s walk through a couple examples of the types of insights you can get from behavioral cohorting. In the graph below, we’re comparing weekly retention of users who favorited at least 3 songs, with users who did not. As you can see, the cohort of users who favorite at least 3 songs have higher retention, indicating that the action of favoriting songs may be an important hook in your app.
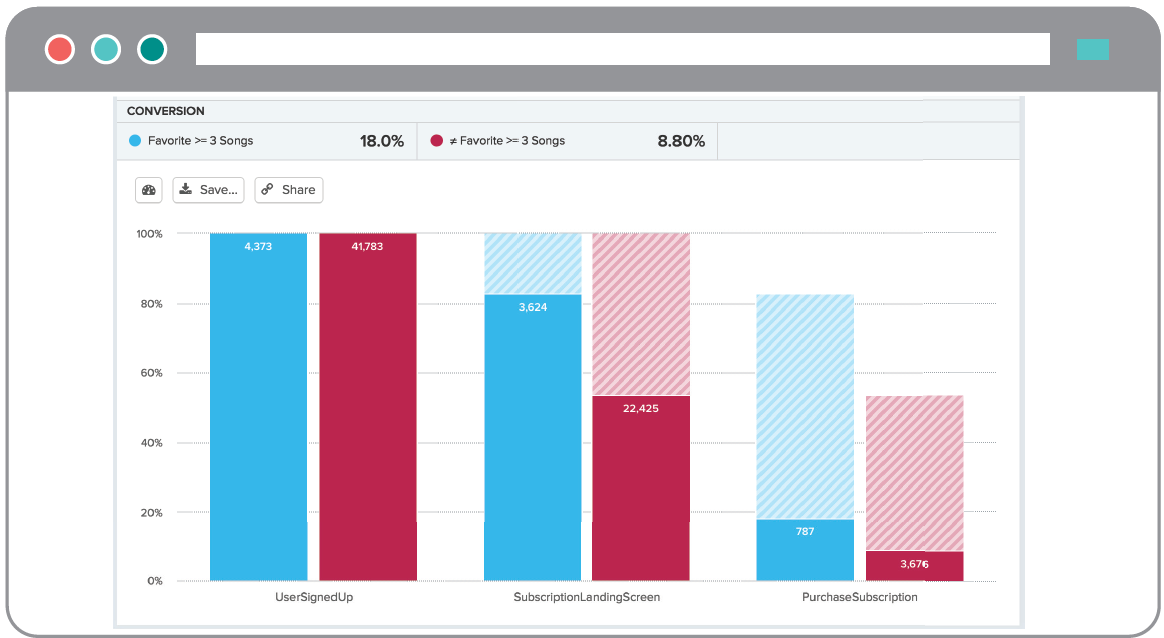
In this next chart, we’ve applied that behavioral cohort to a funnel so that we can see how favoriting songs might impact the conversion rate from signing up to purchasing a subscription. As you can see, users who favorite at least 3 songs have a much higher conversion rate to a paid subscription: 18%, compared to only 8.8% of users who favorite less than 3 songs.
Based on these results, it seems like it’s a good idea to encourage your new users to favorite more songs on their first day. That behavior is positively associated with both retention and conversion to paid subscriptions!
How can you tell if your analytics platform really has behavioral cohorts?
Some companies claim to have ‘behavioral cohorts’, but if you can’t save the group of users and apply it to other charts, like we did with Retention and Funnels above, it isn’t really a behavioral cohort.
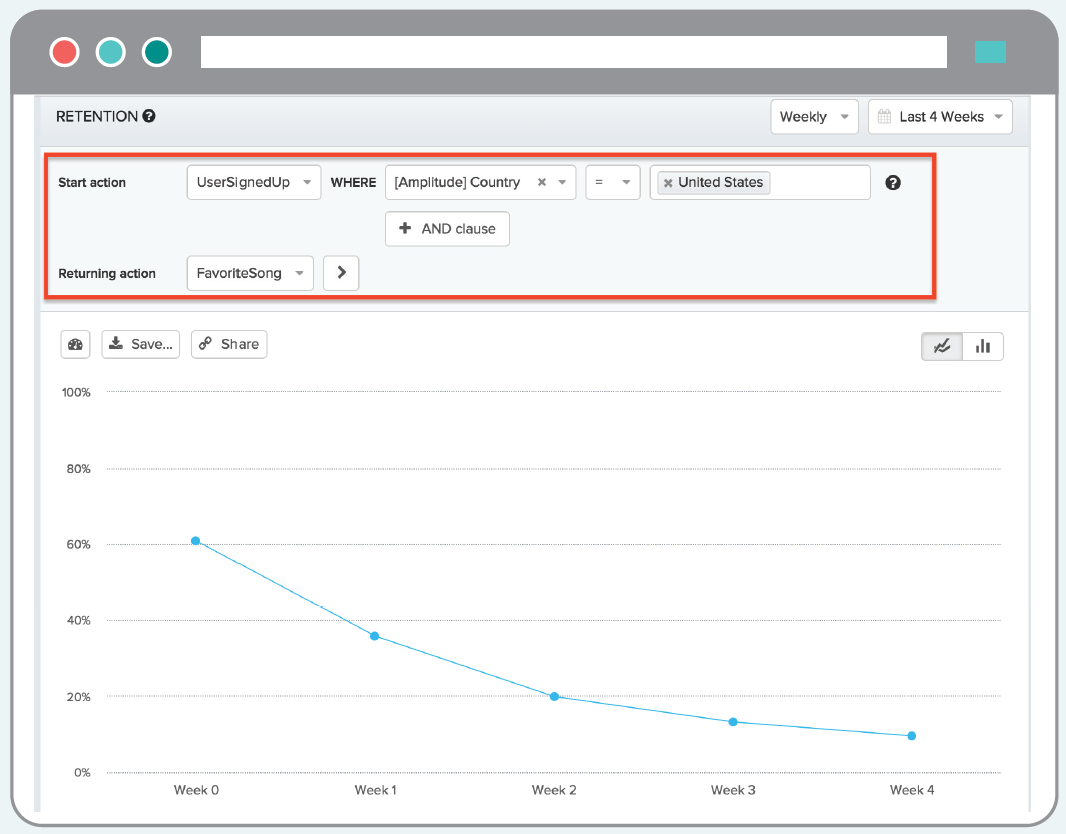
For many analytics platforms (including Amplitude), you can specify a Start Action and a Returning Action for a retention report. This provides you with a more detailed look at retention — in the example below, we want to see what proportion of users Sign Up and then later Favorite a Song.
Some companies will call this “behavioral cohorting,” but it’s really event-based retention. You can’t use the above filters to save a group of users and perform further analysis in other parts of the platform. You also can’t specify a timeframe (like within 1 day of 1st use) or how many times a user has done an action.
Remember, real behavioral cohorting will allow you to:
- define a group of users based on actions they take (or don’t take) in your app
- save that group of users and perform further analysis in charts like Funnels, Retention, and Revenue
- understand your and make better decisions about your product
Ready to understand how different behaviors impact your product’s retention, revenue, and growth? and use the behavioral cohorting worksheet at the end to get started.