How Homebot Uses Analytics to Become More Confident in Product Development
Through Amplitude Analytics, Amplitude Experiment, and Amplitude Activation, Homebot gained an all-in-one platform offering rock-solid data to inform product decisions.

Insights/Action/Outcome:To encourage users to get additional context on a key part of their homeownership report, Homebot created an intentional friction point on a highly viewed module. When introducing that friction point, they intentionally moved the most clicked button on the module. Amplitude revealed a significant downtick in resulting module engagement opportunities, so the team reverted the button location but also kept its new placement in the module’s addition. This allowed them to measure how specific types of users engage with the content, providing new insights into customer behavior. They can now create features and content to engage specific cohorts more effectively along their journey.
For most people, a home is their biggest purchase and most valuable asset. And because of that, Homebot believes educating consumers is the key to helping them succeed in real estate and make smart homeownership decisions.
Founded in 2015, Homebot puts personal finance and real estate advice in the hands of people buying, selling, and looking at homes. Our product offers a dynamic financial dashboard that helps homeowners build equity and generate revenue from their properties through customized, actionable insights. Through insights and education, we aim to alert homeowners and homebuyers to investment and refinancing opportunities across the homeownership lifecycle.
We don’t target users as direct customers; instead, we market our platform to lenders and Realtors who offer it to their clients as a branded value-add. And as users come to better understand market conditions, prequalify for home purchases, and plan their real estate portfolios, they turn to the experts in the field. These lenders, mortgage originators and Realtors provide advice and become valuable advisors. It’s a synergy that works across the real estate value chain.
You can’t improve UX without analytics
I’m a product manager and am super focused on the consumer experience. I am part of a squad comprising seven developers and a dedicated designer. We follow scrum/agile principles and are committed to building a badass product that first and foremost, supports our users. We supply content that educates our customers’ clients about the homeownership journey so they can make intelligent financial decisions together.
My team strives to improve our product and simplify complex content. We also look at ways to better engage users by personalizing the experience to suit their needs. A Texas farmer has little in common with the owner of a $3 million beachfront condo in Florida or a recent university grad living in their parents’ Oregon basement while saving for a property. We want to deliver content that will speak to everyone, regardless of their circumstances.
Unfortunately, we lacked the analytics tools to track engagement and user behaviors on our website. When we made changes, we couldn’t be sure they had the right effect. Our R&D teams used a combination of Google Analytics, Metabase, and Tableau to gather data, but the insights we generated were nebulous. Google Analytics offers limited event tracking, Metabase relies on SQL queries and is geared to data scientists, and Tableau’s strength is visualization, but it relies on accurate data to visualize anything meaningful to the business.
We were making decisions too often based on what we felt instead of what we knew via qualitative product data. We needed more confidence in what we saw and a better holistic view of what our customers did online.
Our search for an all-in-one solution
The quickest way for a company at our stage to learn is through experimentation. We need to look at behavioral data captured at different points in the funnel, reflecting various user experiences—and this information has to be democratized across the entire organization, including product managers, designers, and executives. It’s also important that we supply everyone with a tool to look at and analyze this data themselves without having to wear out our developers.
The quickest way for a company to learn is through experimentation.
Our holy grail was a centralized platform that made data visible to everyone in our organization, even if they had no previous experience with analytics. Over six months, we evaluated Heap, LaunchDarkly, Optimizely, and VWO. We talked to vendors and held internal consultations to determine our needs. It was an exhaustive process that included several proofs of concept, but the defining moment was when we got our hands on Amplitude.
Amplitude really is an all-in-one digital analytics platform that we can rely on for many different uses. Other point solutions could do one thing really well, but we would still have to cobble together other pieces of the puzzle to achieve everything we needed. Amplitude can do it all, and that made it the winner in our book. When we saw the different ways we could use it daily, we were sold.
I’m obsessed with analytics, and Amplitude Analytics delivers value right away. Once you set up event tracking, it’s easy for product managers to jump into the platform, fire up a couple of dashboards, lay out some charts, and start gathering insights.
The platform improved our event taxonomy from the beginning. There’s no auto-track functionality, which made us very deliberate about our event taxonomy and data governance. These events define the most critical metrics to track, and the user experience depends on this common language that everyone uses to analyze user behavior and performance. Analytics forced us to take the time to get our taxonomy right. We didn’t take any shortcuts, and our product is better for it.
Drilling down into user behavior
With Analytics, our product managers can generate charts and visualize data that measures engagement along specific paths in our funnel, identifying where customers click through or drop off. They now have quantifiable data to back up—or disprove—our hunches and base product decisions on facts instead of opinions.
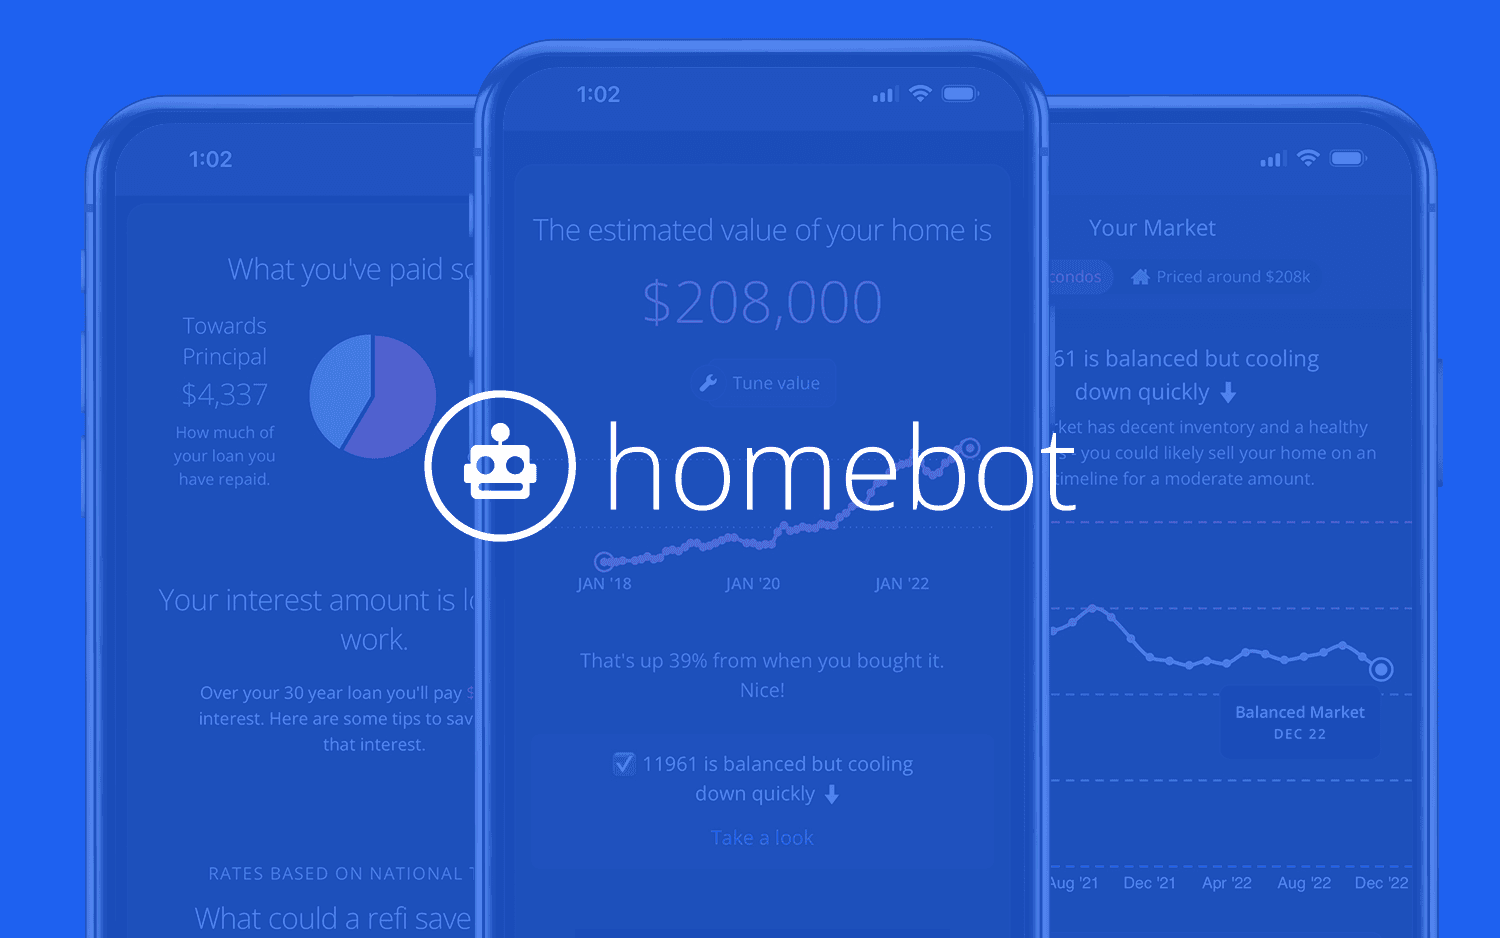
One of the first things we did with Analytics was to validate how users engage with our Automated Valuation Model (AVM) module, which generates the value at the top of every homeowner report and is the most viewed module on the page. It’s not meant to replace a human property appraisal (a CMA, or comparative market analysis, typically handled by a Realtor), but is designed to get homeowners thinking about their property’s worth and how they can leverage their investment.
We initially wanted to create an intentional friction point that forced users to click on a button to learn more about where their AVM came from, so they had more context for the figure before taking additional action within the AVM module. In introducing that friction point, we intentionally moved the most clicked button on the module, which generates a ton of activity, and tracked the data for a couple of weeks. We saw a significant downtick in how consumers were engaging with their home’s AVM, including fewer messages sent to engage with their home advisor, so we reverted the button location but still kept the new placement for it within the “friction point” area we added. This way, with Amplitude, we are able to see how consumers are accessing the button and then connecting with the person providing them with Homebot.
And the really cool part is that we can use Analytics to measure how clients engage with their AVMs and take action in a couple of different paths. Because we can see their activity, we can create features and content that engage the clients who want to go straight to tune their AVM and those who prefer more background information.
Gauging engagement through experimentation
We also adopted Amplitude Experiment and, as we were learning about this tool, started with small but valuable experiments focused on the copy on specific buttons. How do we make a button click more compelling to drive more engagement? We have started to run multivariate tests to a targeted group of customers to see whether small changes in the content sent to their clients can nurture and guide user behaviors.
Experiment’s intuitive UI includes different setup tabs, including an “analyze” tab that notifies us when the impact of our changes reaches statistical significance. In some early tests, we reached that point fairly quickly, and made the copy changes accordingly. It’s pretty effortless and a great way to be more confident that we’re maximizing the impact of our messaging.
One of the best indicators of customer engagement is intent to buy or refinance a home, and it’s one of our most important KPIs. The process typically starts with a direct message (DM) from the user to their lender or Realtor partner. These DMs signal that a conversation is in progress that may lead to a transaction, and we are currently adding this activity to our event taxonomy. Once we have all of our events trackable, we can start to put together that data story that connects activity to engagement. That is our Mount Everest right now, and we’re almost at the summit.
Putting data at the center of decision-making
Amplitude Activation serves yet another function for us. Unlike some other CDPs, Amplitude is not priced per user. We pay the same monthly fee regardless of how many people use it, which gives everyone at Homebot a seat at the table. We feed event data into our Snowflake warehouse and make it available to our BI team in Tableau. Amplitude is a core component of our data pipeline that integrates with both platforms.
When analytics platforms aren’t priced per seat, everyone gets a place at the table.
Choosing Activation as our CDP has put data at the center of our decision-making process. We can analyze our platform, make iterative changes, and rapidly communicate the impact of our design decisions. We have quantitative data that gives us confidence in what we see and can quantify the impact of client activities and customer behaviors. Our R&D team is using it for now, but I expect to onboard our marketing team within the year and take advantage of marketing-specific features.
We’re scaling up and we only expect our data volume to grow. We’re currently developing our mobile app that will give homeowners access to real estate and personal home finance information on the go, interacting with Homebot in exciting new ways. We’re going to have a ton of new data to analyze and it’s going to lead us to a cool story about how people access and open their Homebots, where they’re using it, and how those user paths might differ.
Amplitude is at the heart of this storytelling from here on out. Tracking online events has never been easier, and our evolving data taxonomy allows us to establish impactful metrics that will drive our business forward and help our users build wealth and equity.

Leia Schultz
Product Manager, Homebot
Leia Schultz is a Product Manager at Homebot. A collaborative, results-oriented product manager, she helped businesses build and implement their product marketing foundations and has a proven record of building bridges between departments to orchestrate GTM campaigns and product launches.
More from Leia


