

This article is an excerpt from the first volume of The Product Analytics Playbook: Mastering Retention. Retention is the one metric that matters for sustainable growth. The Playbook is a comprehensive guide to understanding user retention that provides a novel framework for analyzing retention at every stage of the user journey. You can find other excerpts from the Playbook .

There’s an old carpenter’s saying — “Measure twice, cut once.” If you aren’t careful when you’re building a house, the walls will be crooked. You’ll bump into doorways you cut _just _a little too narrow, and you’ll notice your ceilings are _just _a little sloped. It may work for a little while—but then your house will fall down. If the instruments you use for analytics and retention analysis aren’t calibrated, then your data won’t just be a little crooked—you’re going to get misleading results totally at odds with how people really use your app. Before you can dive into your , you need to do a full-scale audit of all your current metrics, plan out each discrete event you’re going to track, and make sure your analytics goals are aligned with your business objectives.
Organizing Your Events
In , the term event refers to any action performed by or associated with a user. A user can do something—or something can happen to them. Playing a song, receiving a push notification, and logging in are all possible events. —data that tracks with customer retention and value—to your analytics platform is the single most important step toward understanding how your users are engaging with your product. [Tweet “Sending meaningful event data to your #analytics platform is the most important step in understanding user engagement”] You could diligently watch your dashboards every day, come up with a rock-solid experimental model, and track your results obsessively, but if you’re not working with the right data, then _none of that _matters. That’s why you need to classify your events thoroughly before you begin analyzing your retention.
Classify Your Events By Looking At Your Goals
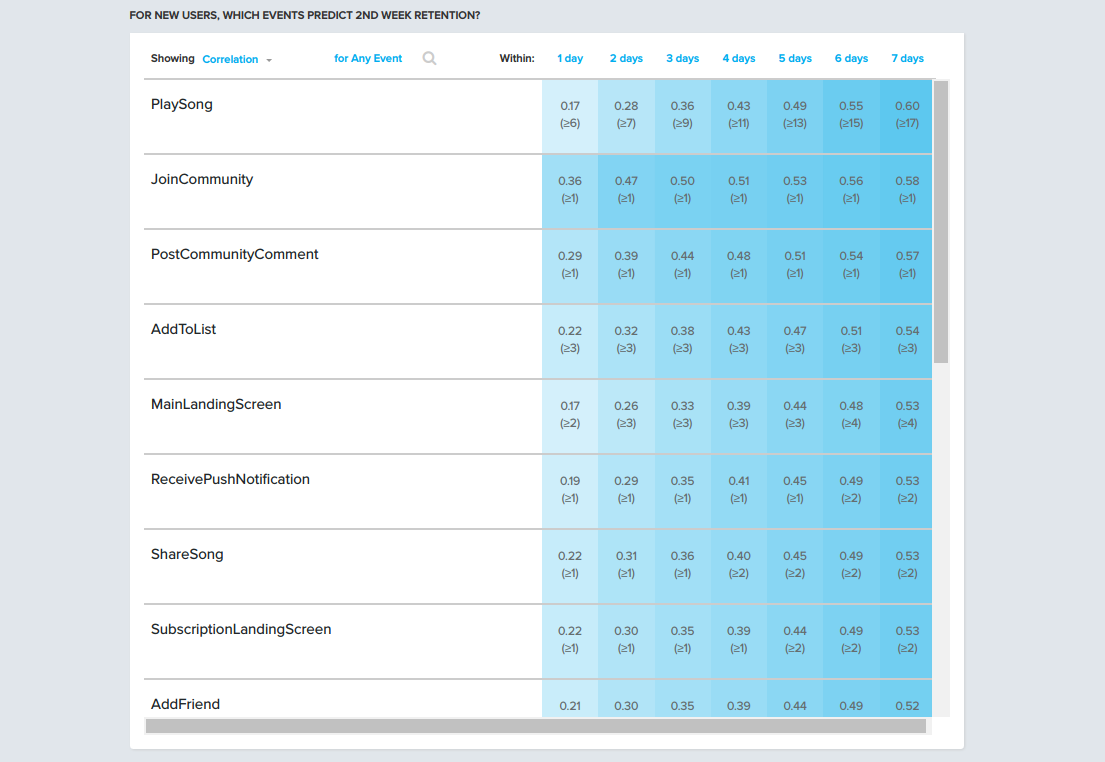
You might think of “what gets measured gets done” as the corollary to our old carpenter’s proverb. In other words, the event data that you choose to focus on is the event data that you’re going to use to try and build retention. Some behaviors will correlate with user retention, and some won’t. You need to uncover the behaviors that correlate with retention and double down on them.It’s only by tracking the events that reflect the actual value you’re delivering to your users that you’re going to understand how you can improve your product. Ask yourself these questions when thinking about which events to track:
- **Are your events aligned with your analytics goals? **You have the capacity to track every event that takes place in your apps, but that doesn’t mean you should be giving them all equal weight. You need to think about your analytics goals in terms of your business objectives. You need events predictive of long-term retention and revenue growth, not short-term bumps in ROI or “activity” metrics that are disconnected from the fundamentals of your business.
- **Can everyone on your team understand what the events are and why they’re being tracked? **Making your comprehensible and available to your entire team is how you begin to build a . Every event you’re tracking, its name, and its corresponding properties must live in one central location. If your team doesn’t understand the context around the events being tracked as well as when you expect them to fire, then it’ll be much harder to derive insights from your data.
- **Are you tracking your app’s critical paths? **Even if it’s early, you probably still have a good idea of the important user flows in your app. If you run an e-commerce platform, that probably includes events like clicking on products, adding to cart, adding profile information, and completing check out. For critical paths like that, make sure you’re tracking each and every event along that path.
- **How are you defining an “active” user? **. To get the most value out of your active user counts and retention metrics, make sure to measure active users based on events that actually matter to you. If a user is just logging in and passively browsing your app without performing meaningful actions–e.g. playing a game, posting a comment, making a purchase–they shouldn’t really be counted as active. Make sure to align your definition of active with your business objectives.
Your events are the . Think about them—“measure twice”—before you dive in—“cut once.”
Setting A Baseline Of User Behavior
Once your instrumentation is set and you know the events you’re going to track, you should start off by making some baseline measurements. You want a concrete set of numbers that you can use as a starting point and to make sure that you’ve correctly set up your analytics tool. In our upcoming , we’ve included a General Analytics Diagnostic worksheet for this very purpose. On a high level, you want to understand:
- Behavior patterns: What are your DAU (daily active users), WAU, and MAU? Are there times of day that your users are more or less active?
- Demographics: Do your most active users come from a particular geographic region or cultural group? Are they on a specific platform, or using a specific screen resolution? A particular operating system?
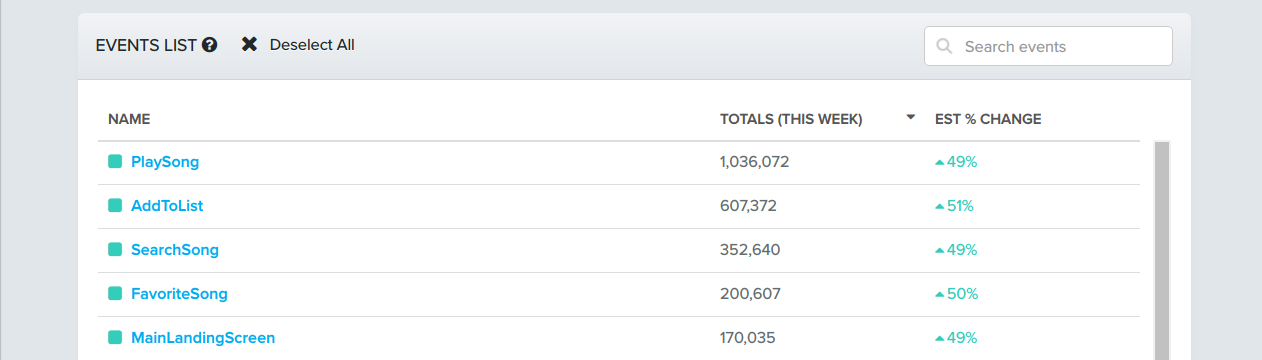
- Events: What are the most popular events associated with your app? Who are your power users—what sets apart the users who are most active?
- Retention & Stickiness: Are your users coming back? What are your D1 (Day 1), D7 and D30 retention? What kinds of actions are your users coming back to perform?
For all outliers—top active user demographics, particularly sticky features—you want to propose some initial hypotheses. Later, you’ll use your analysis of your retention numbers to confirm or rule out your initial explanations.
Measure Twice, Cut Once
Setting up your instrumentation and putting together a list of baseline measurements isn’t the most exciting part of mobile analytics, but it may well be the most important. Get this part wrong, and you could make decisions based off of incorrect data with serious consequences on the performance of your app. You may not ever even discover your mistake. So take the time out now. Measure twice, cut once. [Tweet “How we think about instrumenting #analytics: measure twice, cut once.”]
Missed our earlier Retention Playbook posts? Check them out here:
Comments
: Hi, your link to “reserve a copy of playbook” does not work, it gived 404 error. Please fix.
: @linasmaz:disqus Thanks for letting us know! It is now fixed.