How To Increase Growth Through Retention Analysis
Many people don’t know how to analyze their retention in any meaningful way to drive growth and make their app better for both existing and new users.
All startups know retention is king. If you can’t fix your user retention problem, you’re dead.
So why do most startups still concentrate all their resources on acquisition? Because it’s a cakewalk compared to retention. It’s fun to blow money on marketing and sales, less so to slog over numbers and analyses, getting into the nitty-gritty of why people think your app sucks.
But retention analytics is the foundation of growth; without keeping your existing users, you’re always filling a leaky bucket. You might be growing based on new users for a while, but eventually you’ll use up all possible acquisitions. Your user numbers will plateau, then decline. Then you’re dead.
But how do you know what to focus on when you start looking at your retention metrics? Many people don’t know how to analyze their retention in any meaningful way to drive growth and make their app better for both existing and new users. That’s where retention analysis comes into play.
The benefits of retention analysis include being able to:
- understand how many users return to an app after installation
- understand why some users churn and others do not
- form growth hypotheses based on quantitative data
- develop a data-informed strategy to improve app retention rate
How To Do Retention Analysis
Here are 5 important questions you need to ask of your data so you can evaluate your retention. This will give you all the information you need to start building a retention strategy and start improving your app for all your users.
1. What is My User Retention?
One number that should constantly be on your mind as you develop your app is your day n retention rate, i.e. how many people are staying with your app each day, week, or month. A low retention rate is the stuff of nightmares for any app developer and will be the death knell for your product if not effectively dealt with.
That is where retention analytics comes in. By breaking your users down into specific cohorts, you can find out exactly when they give up on your app and start to identify what is making them leave. The easiest way to measure retention quickly is using acquisition cohorts.
With acquisition cohorts, you can look at the retention of a specific cohort based on when they started using your app. You can then find out exactly how many people churned per day (or per week or month). For example, in the cohort chart below, 13,464 new users signed up on Dec 1 (Day 0). One day later (Day 1) 57% of those users were still using the app (7,675 users). Two days later (Day 2) 39.5% of the users who signed up on Dec 1 were still using the app—(5,318 users). And by Day 3, retention was at 33.6% of the Dec 1 cohort (4,524 users).
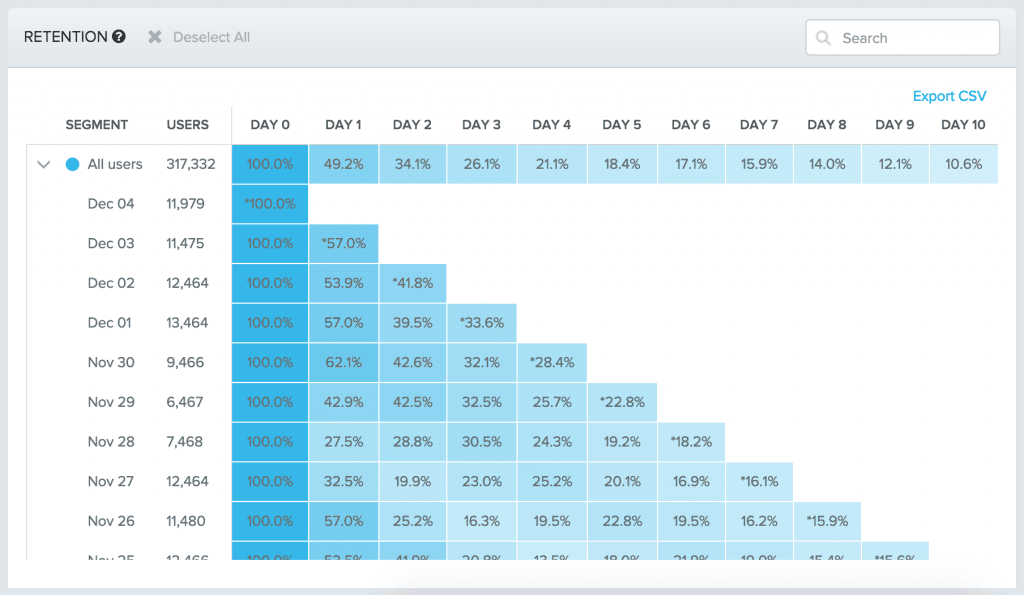
You can easily calculate retention rate for any daily/weekly/monthly cohort by looking at how many people that signed up on a specific date (or range of dates) are still using your service N days later.
From this, you can compute a retention curve to better visualize how long users are retained in your app. From the above data, you can compute a curve for all of the users that have signed up for your app (317,332).
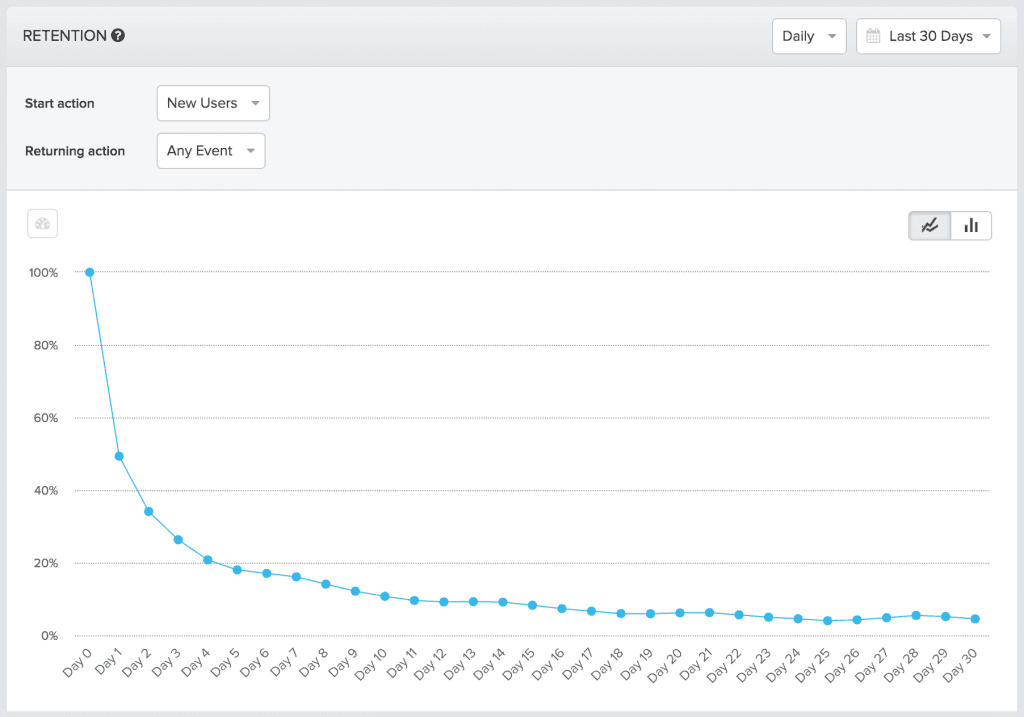
By Day 1, only 49.1% of those users are still retained, meaning that half of all the users that downloaded your app stopped using it almost immediately. From there, each day incurs further churn, but at smaller increments than that initial loss. The curve starts to flatten at around Day 7, with a churn rate of about 1-2% per day.
Therefore the most significant drop off in usage is from Day 0 to Day 1, with subsequently smaller changes in retention. This tells you that users aren’t finding a compelling reason to use your app after that initial download. However, the ones who do understand the value in your app, do stay around for longer; the retention curves eventually tails off as you retain these power users.
This gives you important headline information that you wouldn’t get from a simple churn rate number. It breaks your retention problem down into certain phases: you can see when exactly users are churning out—immediately, after a few days, or after a few weeks. Each of these are different problems requiring different solutions. This means that you can narrow down your focus to that particular area—in this case, that Day 1 retention.
2. How Are My Retention Metrics Trending?
Once you start testing new ideas, you’ll be anxious about how exactly they’re affecting your app retention. However, if you just combine your new retention numbers with your old ones and create the average retention curve above, any increase or decrease in retention could be masked by the previous data.
Instead, it’s better to build separate retention curves for each cohort, so you can identify overall trends in your retention process. Here are 4 separate retention curves from users who began using an app in January, February, March, and April.
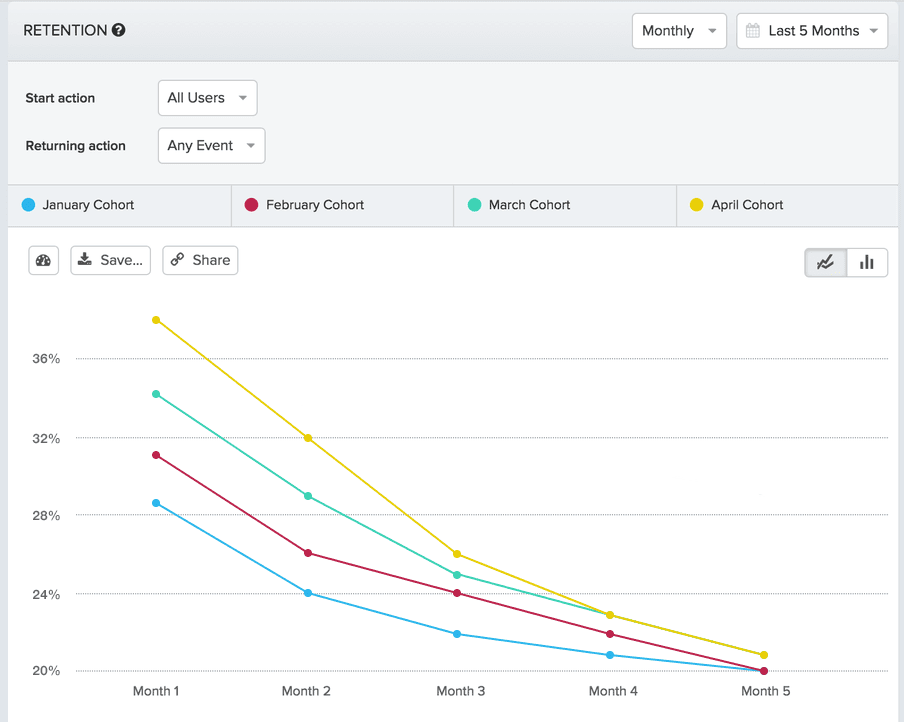
From these curves, you can see that Month 2 retention increases throughout the year: Month 2 retention for the January cohort is at 24%, while Month 2 retention for the April cohort increased to 32%.
This increase is clear when there are only 4 cohorts, but as your product grows and you have more users (or if you’re using daily or weekly acquisition cohorts), then these trends can be lost in all the visual noise.
A better visualization tool is the cycle plot. Instead of plotting each cohort’s month-over-month retention as individual curves, a cycle plot separates each retention period into a separate plot within the same graph, and displays each cohort’s average retention for that month as a single curve. Taking the data from the graph above, you end up with 4 plots showing the trend of your retention at different stages of the user lifecycle.
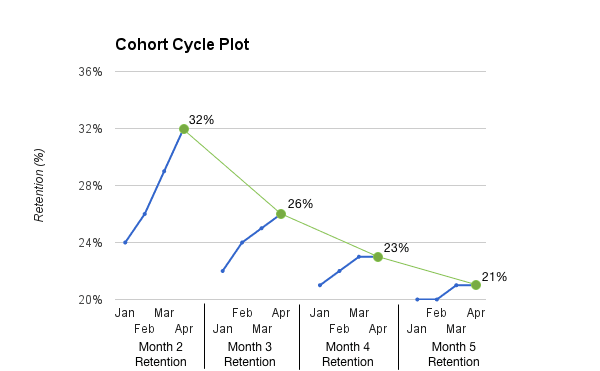
Here we can see that early stage (Month 2) retention has dramatically improved from the January cohort to the April cohort, shown by the slope of the first upward-trending blue line. (The green line shows the April retention through the months, corresponding with the green line in the Monthly Cohorts graph). This was clear from the first graph, but it was harder to elucidate the retention trends for the later stage months. Though retention continues to improve through all the stages, the increase starts to drop off until Month 5 retention is almost stable for all the cohorts.
This tells you that changes made to the app have improved early stage retention, but there is still room for improvement later on in the lifecycle. By breaking down your retention curves into cycles you can see where you should channel your product improvements to increase retention and customer happiness.
3. What Features Are Driving My Retention?
Retention is all about getting users back to your app. But unless they are actively involved with your app, the likelihood is that they will churn at some point.
We often miss talking about engagement in the retention discussion. Developers presume that retention = engagement, but that isn’t necessarily true. They are two separate ideas. You need to know not only whether people come back to your product, but why they come back to your product. Why is it sticky?
Consider this: A user downloads your app and uses it once on day 0, but then forgets about it. On day 7, the first day of their 2nd week of using the app, you send them an email reminder. They open the app again. But that’s it. No real interaction, and certainly no true engagement. They’ll shut the app down and probably never use it again.
As far as your mobile app retention stats are concerned, this user is included in the week 2 retention bucket. It looks like they were merrily using that app throughout weeks 1 and 2 but in fact, they were only involved with the app briefly in both weeks.
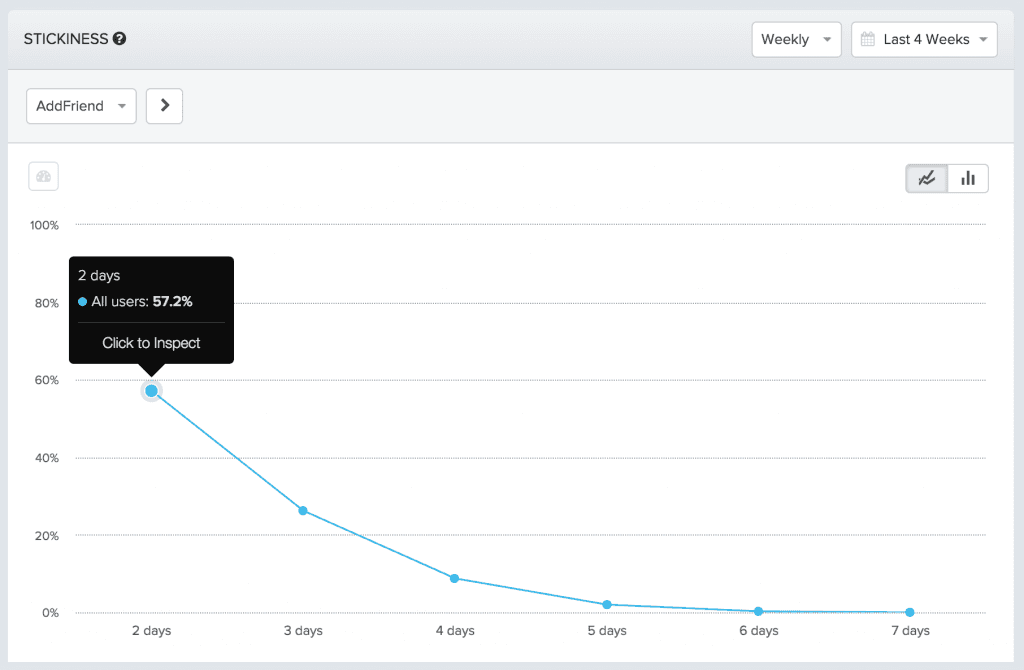
Stickiness is a measure of engagement within your app. It looks at how many times a user performs a particular action in a weekly or monthly interval.
Suppose you are looking at the stickiness of a social media app that lets you add friends. The stickiness curve above shows that 57.2% of users have added a friend on 2 days of the week over the last 4 weeks. 26.2% have added a friend on 3 days, and 2% have added a friend on 5 out of 7 days of the week over the last 4 weeks.
If you aren’t measuring engagement alongside retention, and understanding the difference between the two, then you could be building features that improve one without the other. You may be getting people back to your app, but unless they see a significant reason to engage with it, then it is inevitable that they will churn.
Instead, what you want to find are the features that make your app addictive. If an app is addictive (think Candy Crush) then not only do people come back, they are constantly engaged with the app when they do—they literally can’t put it down. On a 2×2 matrix, addiction would be in the top-right corner:
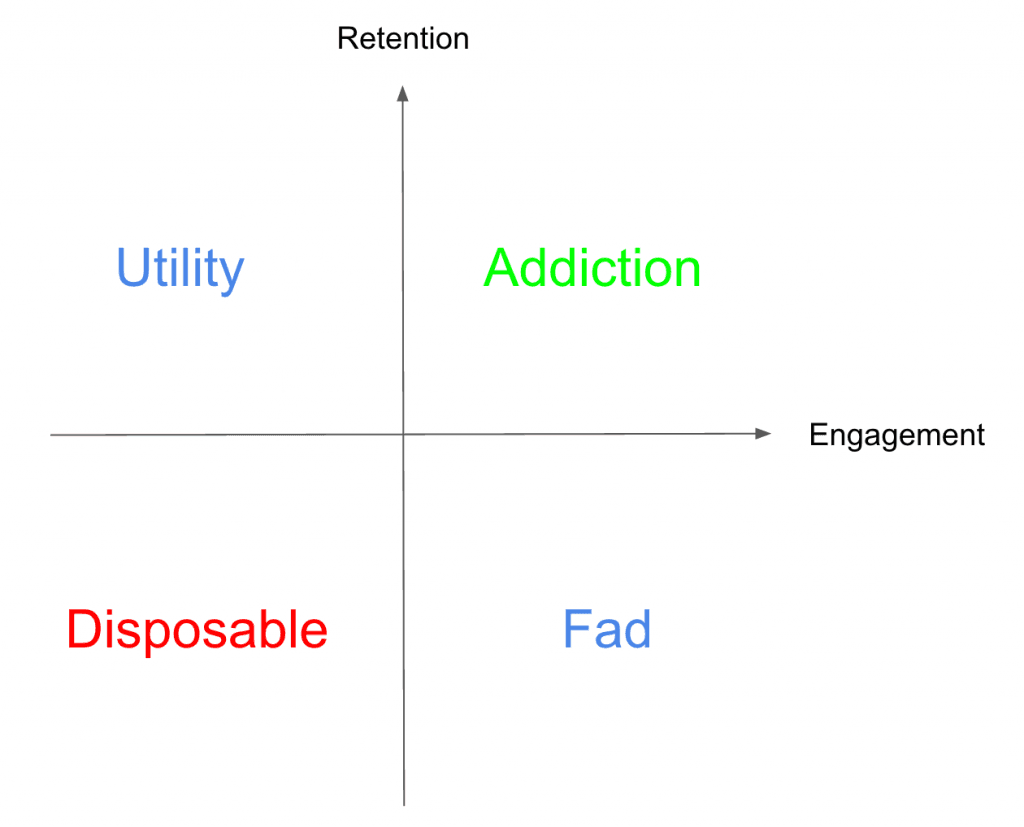
Its nemesis is ‘Disposable’. This is an app you only use once, and are never truly engaged with. If you trawl through your own apps, you’ll probably find plenty of these apps on your on device—apps you thought would be good, but never showed you any true value.
Across the other diagonal is ‘Utility’, something you use often but are never really engaged with (a weather app, for instance), and ‘Fad’, a game you might play relentlessly for a while but quickly lose interest in.
By concentrating on both retention and engagement, you can get your app into that top right quadrant.
4. What Behaviors Lead to User Retention?
When just looking at acquisition cohorts for retention and engagement, you don’t have any information about how you can improve the user experience to retain your users. You can’t isolate specific behaviors or user properties. Acquisition cohorts are great for showing you trends and telling you when people are churning, but to understand why they are leaving you need user behavior analytics — and another type of cohorts: behavioral cohorts.
To find out why users are staying in your app or churning out, you need to isolate the specific behaviors individual users take and see how these affect retention of those users over time. The way to do this is with behavioral cohorts. Instead of looking at all your new users, you can look at all your new users who performed a specific action (or set of actions) and how that’s correlated with their retention.
With behavioral cohorts, you are looking for the features that bring users back to your app time and time again.
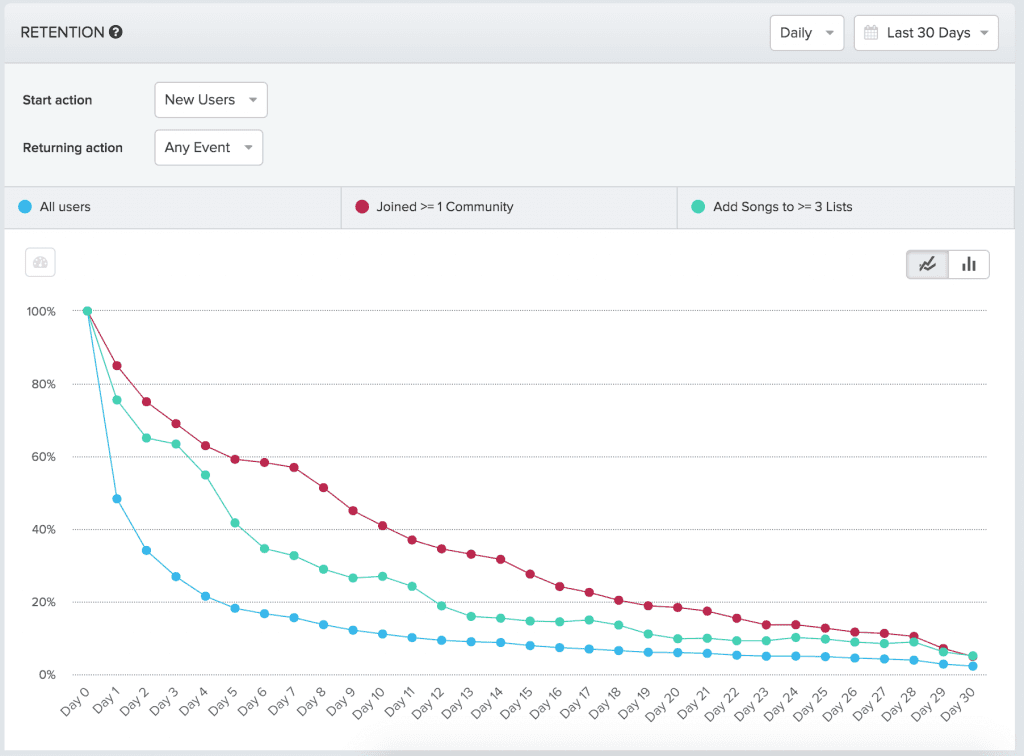
In this example, new users who joined a community in the app are better retained. Particularly, their Day 1 retention improved by 37 percentage points. This means that the users who are more active in the app—through joining communities—are more likely to be retained over the month.
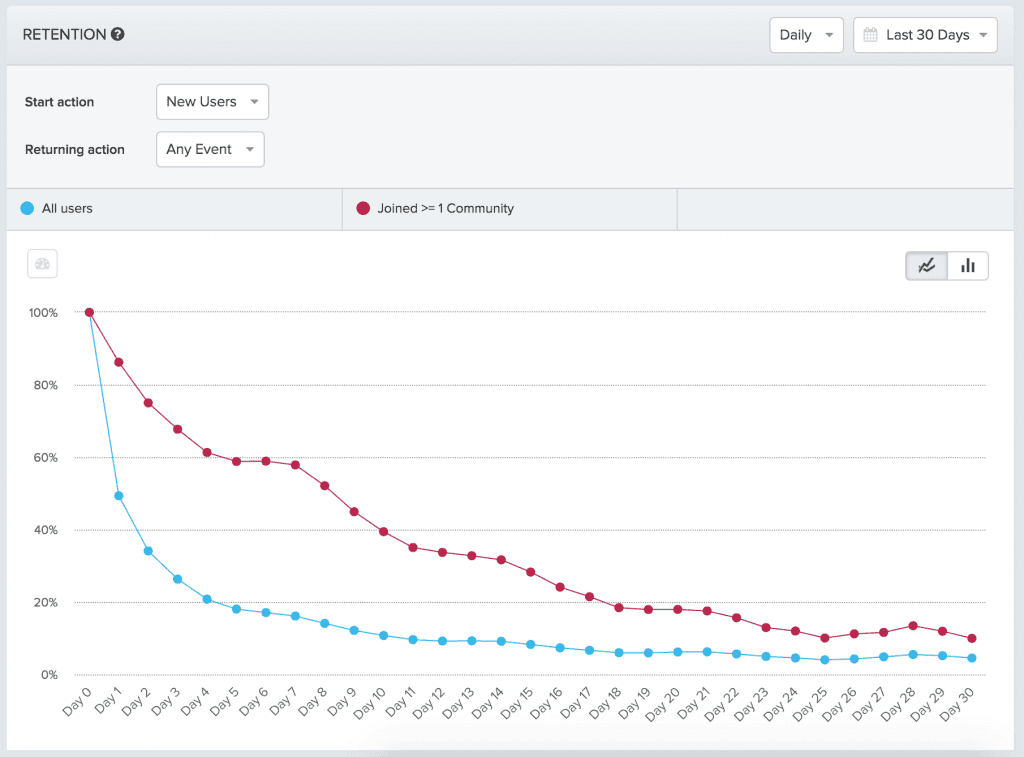
Now you have a starting point for any experiments to increase retention. If users who join communities are more likely to be retained, how can you change your onboarding flow to increase the number of users participating in communities? Or can you identify what it is about joining communities that makes people stay and use that information elsewhere?
Additionally, you can look at the inverse cohort—in this case all the people who didn’t join a community.
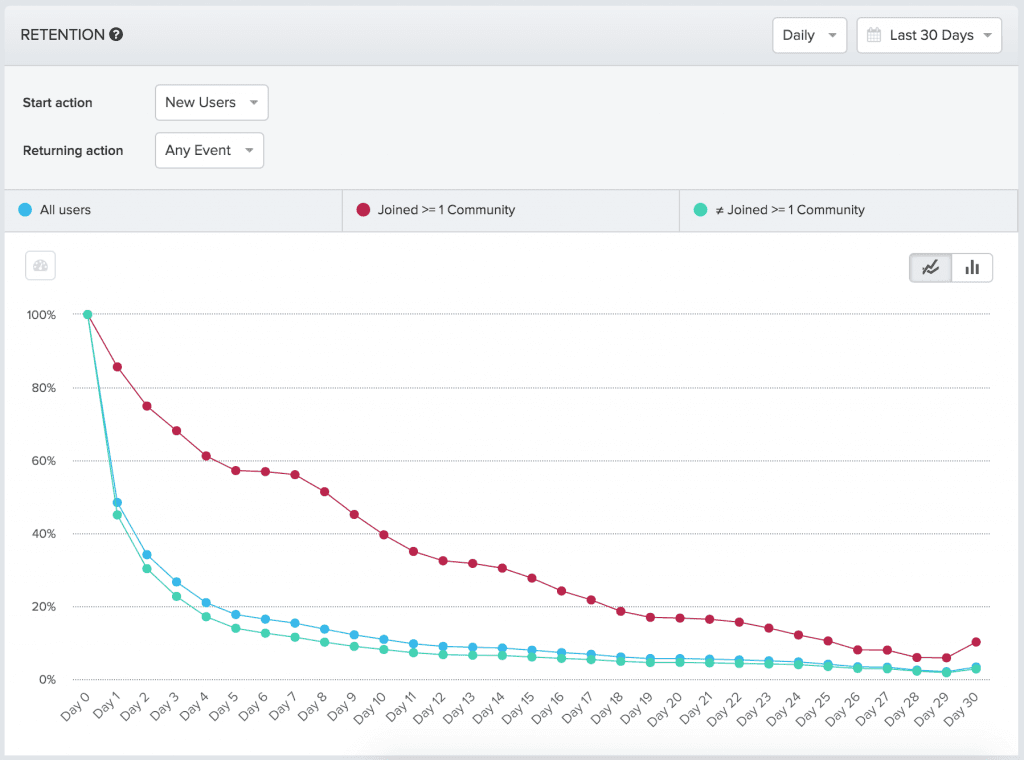
This shows that retention is even worse than average for this cohort. It can motivate you to make sure that joining a community is an experience that is emphasized quickly within the app to help with short-term and medium retention.
You can also look at how this behavioral cohort compares to others. Here are the retention curves for all users (blue), users who joined 1 or more communities (red), and users who added songs to 3 or more lists (green). Though the song-adders outperform all-users, they are still not as well retained as the community-joiners, particularly in the medium term (around Day 5 to Day 17). If you are prioritizing tests to run to improve retention, you would definitely start with finding ways to emphasize communities within this app.
Through this simple addition to your retention analysis process you have moved from understanding that users are churning out at certain times to understanding the behaviors that either drive this churn or persuade them to stay. From here you can start to make changes to your apps and see how this affects your retention trend over time.
5. What Predicts Long Term Retention?
Identifying behaviors that affect retention also helps you understand the behaviors that drive engagement in your app. But once you start to run experiments to discover the actions that lead to growth, you’ll need to put concrete numbers on these behaviors.
By looking at the relationship between certain user actions and retention you can identify the main behaviors and actions that are correlated with long-term use. These can lead you to discover the ‘a-ha’ moments within your product that makes users stay and continue to engage with the app. That’s how you begin to build sustainable retention strategies.
Consider Facebook. Facebook found that users who added 7 friends within the first 10 days that they used the social network were highly likely to continue to use the platform long-term. Users who didn’t add those 7 friends were more likely to churn out. In this case, performing the specific event of adding 7 friends in a certain timeframe was highly correlated with retention.
Netflix is another example. Using similar retention analysis, they identified how many episodes of a show you need to watch to become hooked. For instance, it takes just 2 episodes of Breaking Bad for 70% of viewers to get hooked. If they watched episodes 1 & 2, then 70% of people would continue throughout the whole series. Whereas it takes up to episode 8 of How I Met Your Mother for you to become an avid watcher.
So how do you work out the correlation coefficient between retention and an action? Like this:

Don’t go running to the hills. Though it looks like a lot of hardcore math, it’s all pretty simple. It basically says that for every data point for one of your variables (x and y) you work out their covariance (by subtracting the mean), multiply them, sum those altogether and then divide by the square root of the covariances squared.
OK, that still sounds pretty complicated. But it’s much easier to explain with numbers. Here is some fake data to show how the equation works (a and b are the covariances).

You can then put those numbers into the equation and it suddenly looks a whole lot simpler:

Wow, that’s a really nice correlation. A correlation coefficient runs between 1 and -1. The closer it is to 1, the more the two variables are positively correlated—that is, when one variable gets bigger, so does the other. The closer the correlation coefficient is to -1, the more the variables are negatively correlated—that is, when one variable gets bigger, the other gets smaller.
Unless you really find your ‘aha’ moment, you are unlikely to get a 0.9 correlation between actions and retention. In fact, anything over 0.2 is probably interesting and might be worth experimenting with. Conversely, anything below -0.2 means that those actions are turning people off, and you should look at that action as a reason people are churning out.
Computing correlations between specific events and long-term retention, either yourself or through Amplitude’s Growth Discovery Engine (GDE), allows you to find a number of marginal gains—actions or behaviors that are positively correlated with retention that you can build your app around. This also gives you a great starting place for thinking about long-term retention tactics. On the flip side GDE can help you also find the behaviors that are negatively correlated with retention and find out why users are churning.
Remember though, correlation does not equal causation. Like all retention analysis, it is a starting point for a deeper dive into your app, allowing you to identify those actions that might be indicative of long term retention and allowing you to test product enhancements around those features.
Conclusion
All these analyses build up to allow you to answer what Josh Elman of Greylock Partners says is the pivotal question for your product:
How many people are truly using your app?
Ideally, you want one number which answers this question. A metric that shows that users are truly using your app as you expect them to and are interacting with it often enough for them to understand its core value proposition. For Facebook, this could be continuing to add x number of friends each week, or viewing y profiles. For Netflix, it’s going to be viewing z number of episodes of a TV show.
This does more than just giving you a number to aim at. It gives you a story to build your process and company around. For Facebook, there were probably plenty of users who didn’t fit into the neat ‘7 friends in 10 days’ concept but continued to use the service, and just as many who did but still churned out. But by having that simpler story to tell, everyone at Facebook knew what worked and what to focus on. They were able to unite around a single metric. They poured all their energy into that metric and got the crazy growth they wanted.
The numbers are just a starting point. They are the foundation for the story you are going to build around your product, for both your users and your team, to make sure everyone is on the same page and building the same product. When you know what your ‘aha’ moment is, how to get into that top-right quadrant, you can build a product that can follow the same stratospheric growth as the unicorns.
Comments
Brian Wang: #1 affects the way the app works and #2 affects who you try to get into your funnel in the first place. It may turn out that particular types of users would’ve formed communities without much regard for app design. On the other hand, altering user flows to optimize for community joining can risk obscuring the core value proposition. It’s incredibly important to understand all the variables here to understand the tradeoffs involved.
thermistor: This was an excellent post. The cohort cycle plot is a great alternative to retention curves for visualizing whether changes are improving retention.
Atishay: Are we to look at the Song Adders and the community joiners as two mutually exclusive sets?
Alicia Shiu: Good question. There’s almost certainly some overlap between Song Adders and Community Joiners, but the goal of that analysis is to see whether either of those actions might be more important for retention.
Alicia Shiu: Hi Brian, that’s a really great point about accounting for all of the variables and the risk of obscuring the core value proposition. I think the core value prop should be the focus early on: either optimizing it and figuring out how it get it in front of more people faster, or even possibly just figuring out what your core value prop is based on analyzing user behavior (it could be something unexpected). In the example in this post, it’s possible that the most engaged users find that joining communities ARE the core value prop of the app.
Nathan Vander Heyden: Excellent post on a topic many developers struggle with. One user who stays is much more valuable than ten or a hundred who download the app to try it just one day 😉
Gaurav Vohra: Great post.
Stitchard: Firmly bookmarked. Great post.

Archana Madhavan
Senior Learning Experience Designer, Amplitude
Archana is a Senior Learning Experience Designer on the Customer Education team at Amplitude. She develops educational content and courses to help Amplitude users better analyze their customer data to build better products.
More from Archana


