How You Can Get Everyone in Your Company to Solve Problems with Data
To solve problems with data, you need to reframe the way you make decisions.
Solving problems with data is appealing because it’s effective. It builds on measurable standards of success that help take the guesswork about which path to take. So why doesn’t everyone in every company make decisions with data all the time?
Well, it’s not that easy to cultivate a culture that predicates its decisions on data. When problems come up, there is a lot more that goes into crafting a solution than simply looking at some numbers. To solve problems with data, you need to reframe the way you make decisions. If you’re at the helm of a company or project, as the head of Facebook’s first Growth team Chamath Palihapitiya says, it takes having “a vision and … building good product and trying to deliver core product value. That takes ego, meaning you have to be comfortable not being rewarded in the short term.” And if you want that mentality to pervade your company, you need to have a fully integrated culture of data. Here are the first steps to make that shift.
1. Set up your data pipeline
The first thing you need to do is collect feedback from your users. It’s not enough to just ask a few of them what they think or watch someone use your app in a coffee shop. You need a systematic process, one that will allow you to collect both qualitative and quantitive data. This is how you begin to nail down what your problems really are. For qualitative data, you need to make a concerted effort to get feedback from your users.
- Survey your customers. Whether through email or on your website, ask people who are using your product what they think and give them an opportunity to provide feedback. Force them to assign a score so you can collect hard data in the process.
- Create a user testing program. If you want to know how people use your product, why not observe them actually using your product? Although it takes a bit of effort to coordinate, a well-designed user testing program will give you a lot to work off of.
- **Talk to your sales and customer service teams. **When people are interfacing with customers, they will gain insight as to how people are using your product and what their pain points are. Make sure that there’s a systematic way for this feedback to be recorded.
For quantitative data, you need to figure out a system that allows to keep all your data organized and accessible. One Excel file that is bursting at the seams is not a good way to observe your data. You need: - Automation, to collect what you need regularly with minimal effort
- **Centralization, **to put your data in one place so it can be used in a coordinated way
- Legibility, so you can see what’s happening in your data without a lengthy scrubbing or visualization process
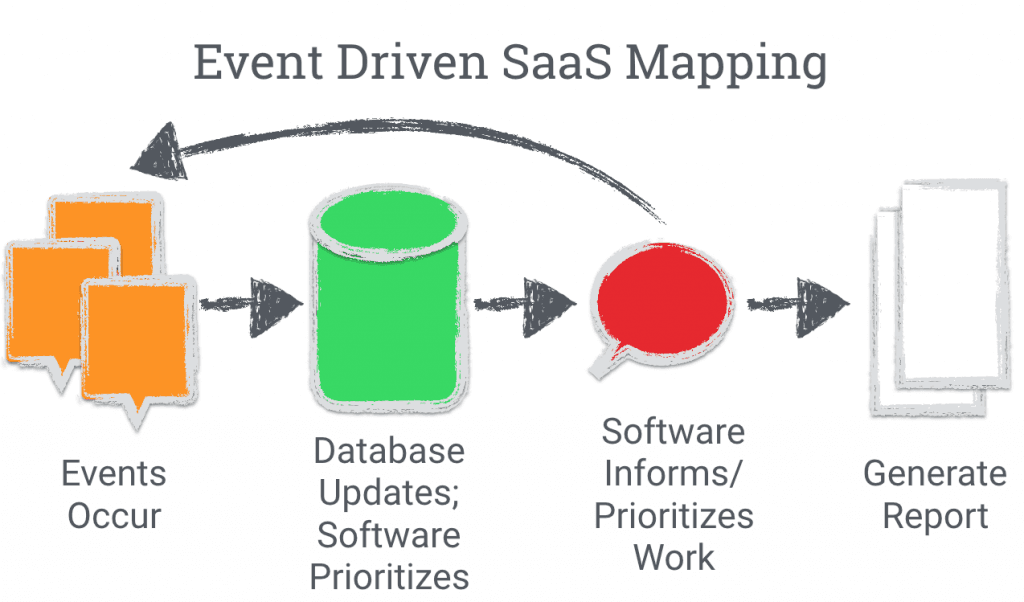
This graphic from Tomasz Tunguz shows how your quantitative data can come together automatically. As events happen in real time, your database or software logs those events. You can then look at those events to understand what you’re working on, or how you’re approaching a problem.

2. Build around achievable goals
Brian Balfour, current CEO of Reforge and former VP of Growth at Hubspot, uses a framework called OKRs for goal setting. That’s Objectives and Key Results, and the framework was created by Intel and adopted by many high-growth companies.
- Your objective is your overarching goal — say, improve conversions on your website.
- Your key results are the marks you want to hit to support your objective. You should make a manageable KR (~90% doable), a difficult KR (~50% doable), and a “we’re going to celebrate with a huge trip to Vegas if we pull this off” KR (~10% doable). So, for improving conversions that might look like this:
- Manageable KR = raise conversions by 50%
- Difficult KR = raise conversions by 2x
- Vegas KR = raise conversions by 10x
- Your timeframe is between 30 and 90 days. Fewer than 30, and you aren’t setting a high enough bar (or giving enough time to measure a difference). More than 90 and you’re biting off more than you can chew.
Once you’ve set up your framework, come up with some actionable ways to reach your KRs. This framework encourages progress because it’s structured around reaches and rewards. When your team for hits your manageable KR, they get that psychological boost of a job well done. But they still have the motivation of reaching for those harder KRs.
3. Leverage your whole team
One of the most important steps in creating that pervasive, data-driven mentality is to create an environment where everyone has access to data relevant to their work, and everyone is encouraged to use that data to make decisions. Think of how companies crowdsource the answers to tricky data science questions by posting them as contests on Kaggle. When you have a culture of data accessibility, you’re unlocking the same kind of spirit inside your company. This can be a hard shift to make, both culturally and structurally, but it’s important that everyone working with your product can make informed decisions about it.
- Remove barriers of entry. Recognize that if your data needs to be manipulated with coding and software before it’s readable, you’re blocking people who might have great solutions from being able to solve problems. Effectively, this undermines creating a company-wide culture of using data.
- Assign an accessibility point person. Your data isn’t going to make itself available. Have at least one person who is committed to streamlining data access for everyone.
- Own your analysis. Similarly, you need someone who takes ownership of data analysis from day one. They need to be on board with data accessibility and driven enough to dive into all the analytics imaginable for your product.
- **Demand data. **As you continue to institute your cultural shift, ensure that data becomes a central tenant of operations. When problems arise, or when people have ideas they want to pursue, require everyone to back up their path forward with numbers.

Make the switch
When you decide to turn to data for solutions, you are making a decision that will benefit your business from that moment on, no matter where your product takes you. Although it requires effort to shift your company to focusing on data-driven solutions, that effort will be well worth it. Take the multi-pronged approach of shifting your mentality, your process, and your structure, and put yourself on the path to data-driven success.

Alicia Shiu
Former Growth Product Manager, Amplitude
Alicia is a former Growth Product Manager at Amplitude, where she worked on projects and experiments spanning top of funnel, website optimization, and the new user experience. Prior to Amplitude, she worked on biomedical & neuroscience research (running very different experiments) at Stanford.
More from Alicia


