How to Interpret Emotion and Intent Through Behavioral Analytics
Understanding the emotion and intent of your users sounds like a lofty, mythical aim, but it’s really nothing more than a step-by-step process.
You can track a ton of data on how your users interact with your app: how often they come back, what time of day they’re most active, what characteristics make someone more likely to become an active user. But the end-goal is to know not how often your users are active but how they _feel _and _what they want _from your app. For behavioral analytics, nothing is more important than these two factors:
- Emotion: Does your app reward its users? Does it make people feel good, or does it bore them? Fundamental to building habitual usage is understanding how to trigger user action, and you do that by tapping into their emotions. Looking at users who are already hooked is the best way to understand how.
- Intent: What are people trying to do with your app? There’s only one way for an app to succeed—it must bring people to something they want faster, more efficiently, more affordably, or simply better than they could before. Understand where people want to go and you can better optimize your machine to take them there.
When you understand the real root cause of a habit—both from a practical (the job-to-be-done) and psychological standpoint—then it becomes possible to break it—or bring that value to an exponential number of new users. Understanding the emotion and intent of your users sounds like a lofty, mythical aim, but it’s really nothing more than a step-by-step process.
1. Pick the Right Events
The first task to tackle is the actual event tracking. The most common mistake people make early on is tracking so many events that they can’t get a handle on the data that actually matters for understanding emotion and intent.
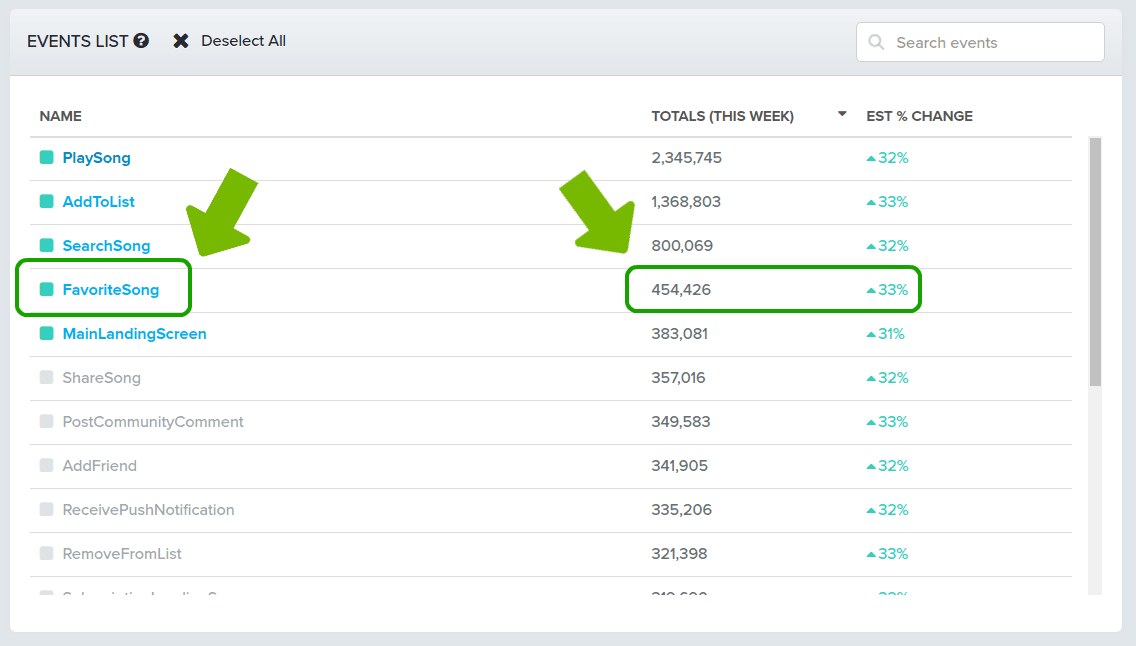
20 is a reasonable number of events for an app that’s not too feature-rich. Here’s a list of features from a music-playing app, with total number of times performed and percentage change for each feature listed on the right.

Let’s look at Favoriting Songs. When you’re looking to understand emotion and intent, you want to look at events that indicate some expression of need or desire on the user’s part.
“Favoriting” a song is a way for the user to express a very specific feeling: “I like this song, and I want to save it for later.” Or, “I want to demonstrate to this app that I really like this song because I think that will improve my experience in some way.”
It’s easy to get far more granular. You could track every conceivable event or dive in really deep on individual event types—Favorite 4 Taylor Swift Songs, for instance—but simplicity is generally best. Track every single instance of a user touching their screen, the exact location of the impact and its three-dimensional velocity, and you’re going to track way, way too much data.
If you’re interested in capturing user intent and behavior, you need to be very selective about exactly which parts of the user experience, from actions to gestures, you want to track.
2. Track Behavior Against Retention
Amplitude’s Compass feature allows you to get a bird’s eye view on all your behavioral cohorts, plotting every event that you track against retention correlation and frequency at which they’re performed. It’s a comprehensive overview of **what actions predict retention in your app **and how often active users are doing what.
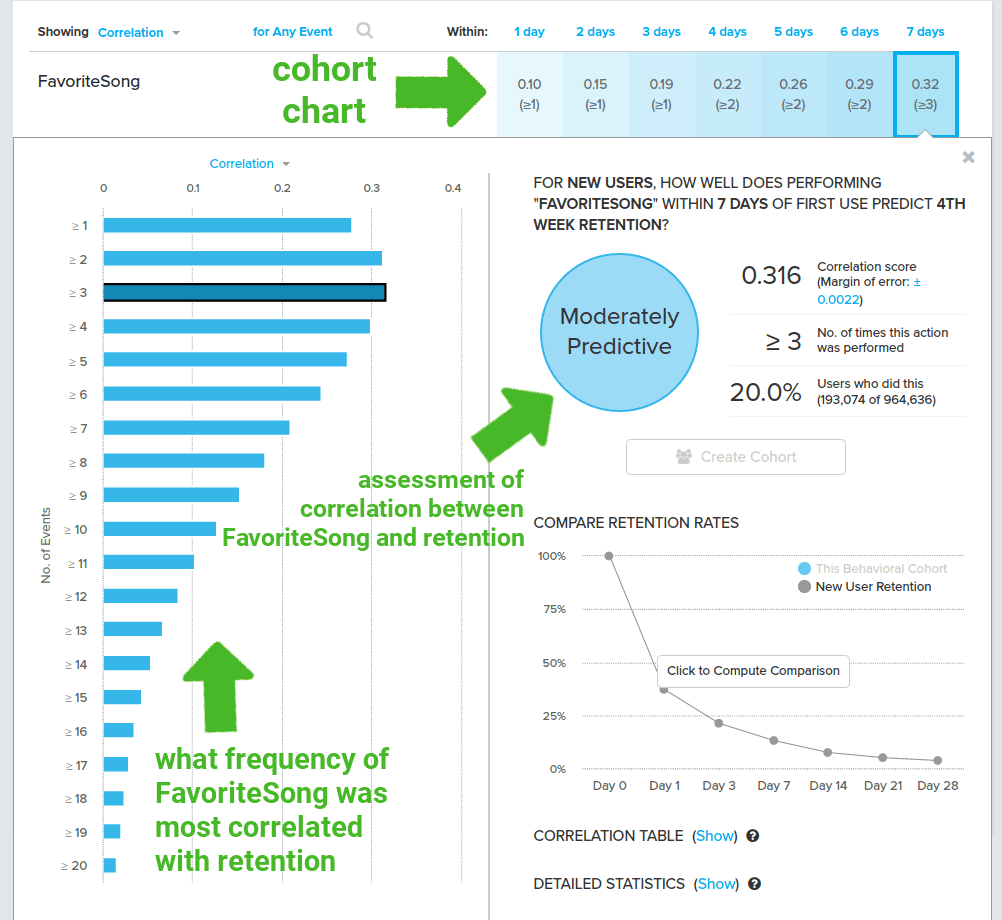
Here’s a Compass chart for our Favorite Song feature. At the top you can see the traditional cohort chart, including Favorite Song’s correlation with four-week retention graphed across the whole first week of a user’s time with the app:
- .10 correlation between users Favoriting a Song within 1 day of signing up and being retained for four weeks
- .15 correlation between users Favoriting a Song within 2 days of signing up and being retained for four weeks, and so on

To the right is a breakdown of Favorite Song’s overall correlation with user retention—moderately predictive, in this case. 20% of users _did _Favorite a Song within their first seven days of use and the overall correlation score was .316.
Interestingly, three or more FavoriteSong events was ranked the event most predictive of fourth-week retention. You can see the total frequency breakdown on the left. (Note: Favoriting Songs 18 or 19 or 20 times might _technically _correlate better with long-term retention, but the number of users doing them wouldn’t be high enough for statistical significance in this case.)
This is the most efficient way to start drawing conclusions about why users go from newly registered to testing your app out to falling into a habitual pattern of behavior. Finding those Aha! moments and quantifying them is what will help you bring your app into line with what your users genuinely, deep-down, want.
3. Define Your Cohorts
You have your events, and you have your behavioral cohorts to examine—here’s where it gets interesting.
Now you can see not only how many people “favorite 3 songs in one day” and how many don’t, but watch as users gradually transition from one group to the other over time.
Behavioral cohorts offer a simple way to group your users by the actions they take inside your app within a certain timeframe, and then analyze those groups. You can look at your most consistent users, your most active overall, or the inverses of both.
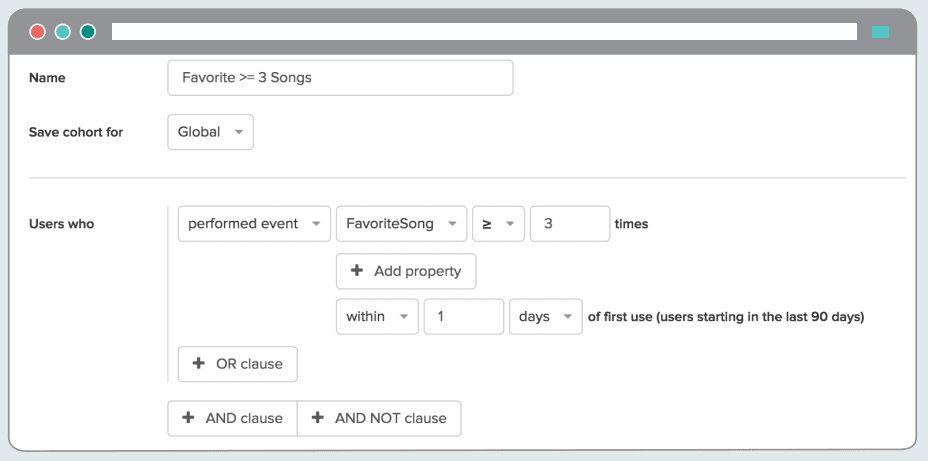
In Amplitude, cohorts are created in an intuitive WYSIWYG logic editor. Set your parameters, name it, and your cohort is good to go. In this example, we’ve created a cohort based on users who:
performed event Favorite Song >= 3 times _ within 1 days of first use_
We enter “Favorite >= 3 Songs” for our title, save it as a Global cohort, and then fill out our parameters above. We specify that users should have Favorited a Song >= 3 times
Again, keep it simple. Your intuition of how people think about your app won’t necessarily square with the reality of how people use it. When you’re sure that you have some special insight, it’s easy to get very complex:
performed event Favorite Song >= 62 times _ within 27 days_ OR performed event Add to Playlist >= 13 times _ within 24 days_
This is how your definition of daily active user can spiral out of control as you search for a magic bullet. The problem is that it gets a lot harder to measure and find statistical significance for a definition so complex. Best to choose something higher-level, because you can always take a deeper dive into that when analyzing your different behavioral cohorts.
Let’s graph retention for users who Favorited a Song >= 3 times in their first week next to the retention for users who both Favorited a Song >= 3 times in their first week _and _Joined >= 1 community:

Beginning from Day 1, the two behavioral cohorts diverge. Over 70% of the Favoriting + Community Joining cohort is still around, but only about 50% of the Favoriting cohort is. That is a statistically significant difference.
It’s not necessarily evidence of anything—but it’s a lead to investigate. You might want to now examine whether users who are in Communities Favorite more songs, whether Favoriting at a certain frequency leads to Community Joining, or what other behaviors these Favoriting + Community Joining users are exhibiting.
As you learn more about your users, you’ll rule out certain paths and find value down others. The only way to tell if you’re going down the right one is to test different hypotheses and see if they track with how people actually behave.
What Users Want
To know intent and emotion, you must know the actual people who are behind the screen. Without some understanding of _why _they like your app and want to use it over and over, you won’t get very far in bringing that experience to the wider world.
You don’t need a massive base of obsessed users for this. You don’t need to track a million different events and hire a team of data scientists. What you need is simply an elegant and repeatable process for making sense of how your users feel and what they want to accomplish with your product.
For more on setting up, launching, and making your mobile app sticky, check out our Mobile Analytics resource page. photo credit: WOCinTech Chat

Archana Madhavan
Senior Learning Experience Designer, Amplitude
Archana is a Senior Learning Experience Designer on the Customer Education team at Amplitude. She develops educational content and courses to help Amplitude users better analyze their customer data to build better products.
More from Archana


