Introducing Heatmaps: Get Micro and Macro Qualitative Insights to Fuel Growth
Bring your user behavior to life with Heatmaps, a powerful new Session Replay capability that enables teams to optimize content, streamline user journeys, and improve conversion rates.

Building great digital products means understanding your users—where they click, what they ignore, and where they get stuck. While traditional quantitative metrics provide valuable insight into what users do on your website or in your product, they don’t always explain why they do it. Without clear visual insights into where users experience friction or don’t convert, teams can struggle to build the best experiences.
Last year, Amplitude bridged the gap between quantitative and qualitative insights with Session Replay, which enables teams to zoom into specific user behavior and understand the why behind the what. Heatmaps, the latest Session Replay capability, provide intuitive visual representations of user behavior at both micro and macro levels. The ability to zoom in and out ensures robust qualitative insights that fuel product and business growth.
Whether analyzing where users click or how far they scroll, Heatmaps offer critical answers that teams can use to drive continuous growth:
- Product teams can identify user pain points to improve retention.
- Growth teams can increase conversions by optimizing user journeys.
- Marketing teams can learn what content converts and boosts call-to-action (CTA) engagement.
- Design teams can uncover patterns to enhance the user experience and drive their partnership with product, growth, and marketing.
Key features of Heatmaps
Heatmaps are currently available for web applications, with mobile applications available later in the year, so you can see where your users click, scroll, and drop off.
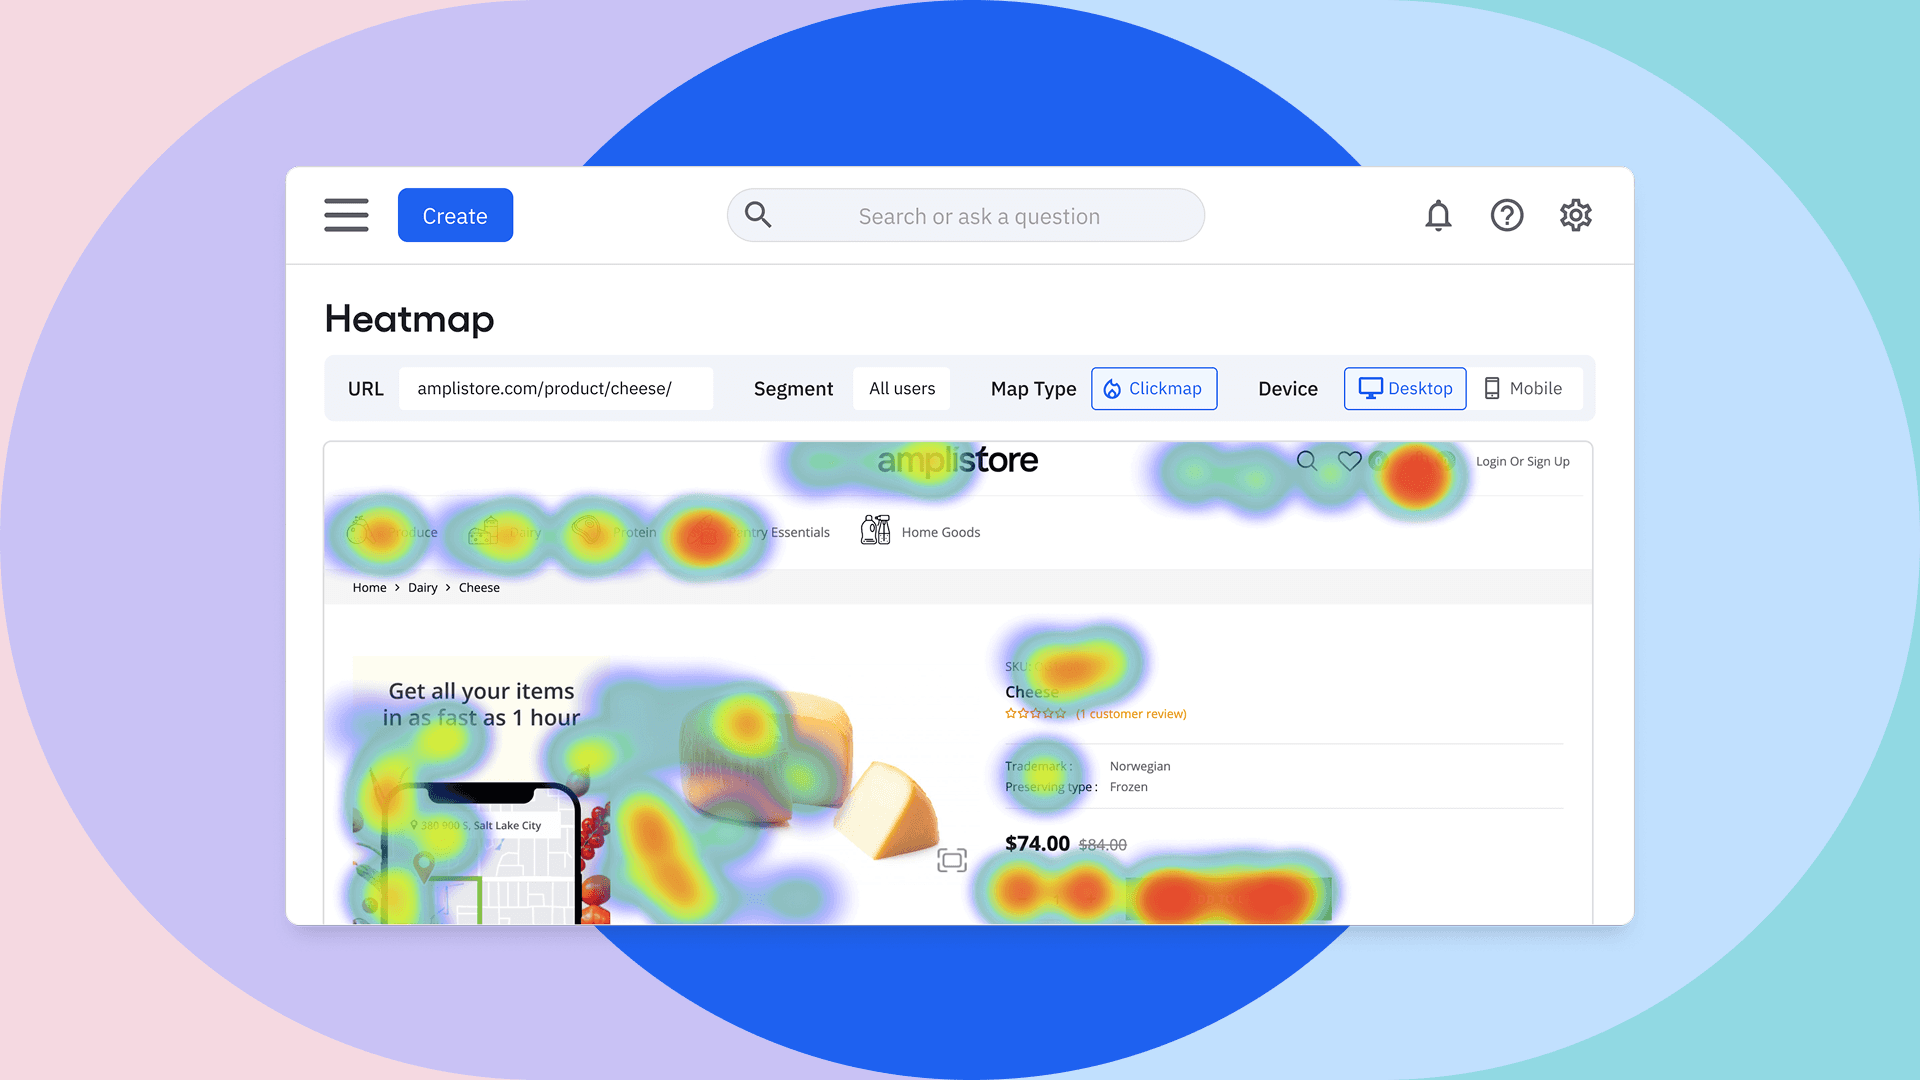
Click maps
Pinpoint exactly where users click on a page so teams can refine designs and improve usability based on popular page elements.
Selector maps
Visualize clicks, taps, and interaction hotspots across your digital experiences so you can easily identify which elements—like buttons or CTAs—attract the most attention and which areas users ignore.
Scroll maps
Understand how far users scroll on a page to see where they engage—and where they lose interest—so you can prioritize content placement based on user attention.
Go the distance with Amplitude’s unified platform
The power of Amplitude Session Replay with Heatmaps is the ability to quickly and seamlessly do the next best thing to improve the user experience—no cross-platform integration required. With Amplitude’s digital analytics platform, teams can connect Heatmaps with Session Replay, Analytics, Experiment, and Activation to:
- Move from macro to micro: See what's hot (and what's not) with Heatmaps, then zoom into individual user behavior with replays to get the full story of your users' engagement.
- Link visual insights to metrics: Tie Heatmaps to key performance indicators (KPIs) around acquisition, monetization, and retention to measure the impact of user experience changes.
- Drive experimentation: Combine insights from Heatmaps with Web Experimentation to test changes to CTAs, page layouts, and user flows based on actual interaction data.
- Segment by audience: Analyze Heatmaps by audience segments, device type, traffic source, or user behavior to uncover targeted opportunities for improvement.
Get started with Heatmaps
Heatmaps are available to customers who have purchased the Session Replay add-on for Growth and Enterprise plans. To learn more about Heatmaps or get started, contact us!

Weston Clarke
Former Director, Product Management, Amplitude
Weston is a former product manager at Amplitude with a background in computer science, consulting, and product. He started his career in digital strategy consulting at Accenture, helped build UberEats in its early days, launched buy-side revenue products at Redfin, and most recently, is defining the digital analytics category at Amplitude. In his free time, you can find Weston cycling, skiing, and getting involved in SF's startup community.
More from WestonRecommended Reading

How HYBRD Turned Agent Evals into a Retention Signal
Jul 28, 2026
5 min read

Replay Sessions and Retarget VIPs with Your Existing Adobe Tags
Jul 28, 2026
4 min read

Beyond the Rate: Retail Banking's New Competitive Front
Jul 20, 2026
13 min read

How NS Prevented €1.8M in Revenue Loss Through Experimentation
Jul 20, 2026
7 min read