Learning How to “See” Data
Product insights require granular, event-based data. But it takes practice to turn our awareness of the customer domain and the “things that happened that we care about” into event definitions.
In a response to an early draft of this series, Eric Peterson (co-founder of Automaton, previously at Tableau), made this astute observation:
I wonder if instrumentation apprehension/paralysis is rooted in a fundamental lack of data literacy. If you have a mental model of rows and columns, what they represent, and how to find patterns in them, you intuitively get to “what rows and columns would show the patterns I care about?”
Given my insistence about the customer domain in the previous post, it might seem odd to immediately jump to the domain of “rows and columns.” But Eric makes a great point.
I’ll use myself as an example. I’m not a data scientist or data engineer, but over the years I’ve done my fair share of specifying, data spelunking, analysis, cleaning, slicing/dicing, and “reporting”. Like lots of product managers, I always ask for application database access so I can poke around and answer my own questions.
With experience, you do develop this sixth sense of sorts for what is possible given a dataset, and what dataset you might need to make something possible.
The datasets we use, and the tools we use, often dictate what we view as possible. The biggest challenge I see here is a lack of familiarity with event stream data. Most of us have used more traditional tables with a row per person, region, project, work order, etc. A row per “event” — song played, clinical trial re-classified, status updated, and friend added — is more foreign.
Consider this basic table of project status update events in chronological order:
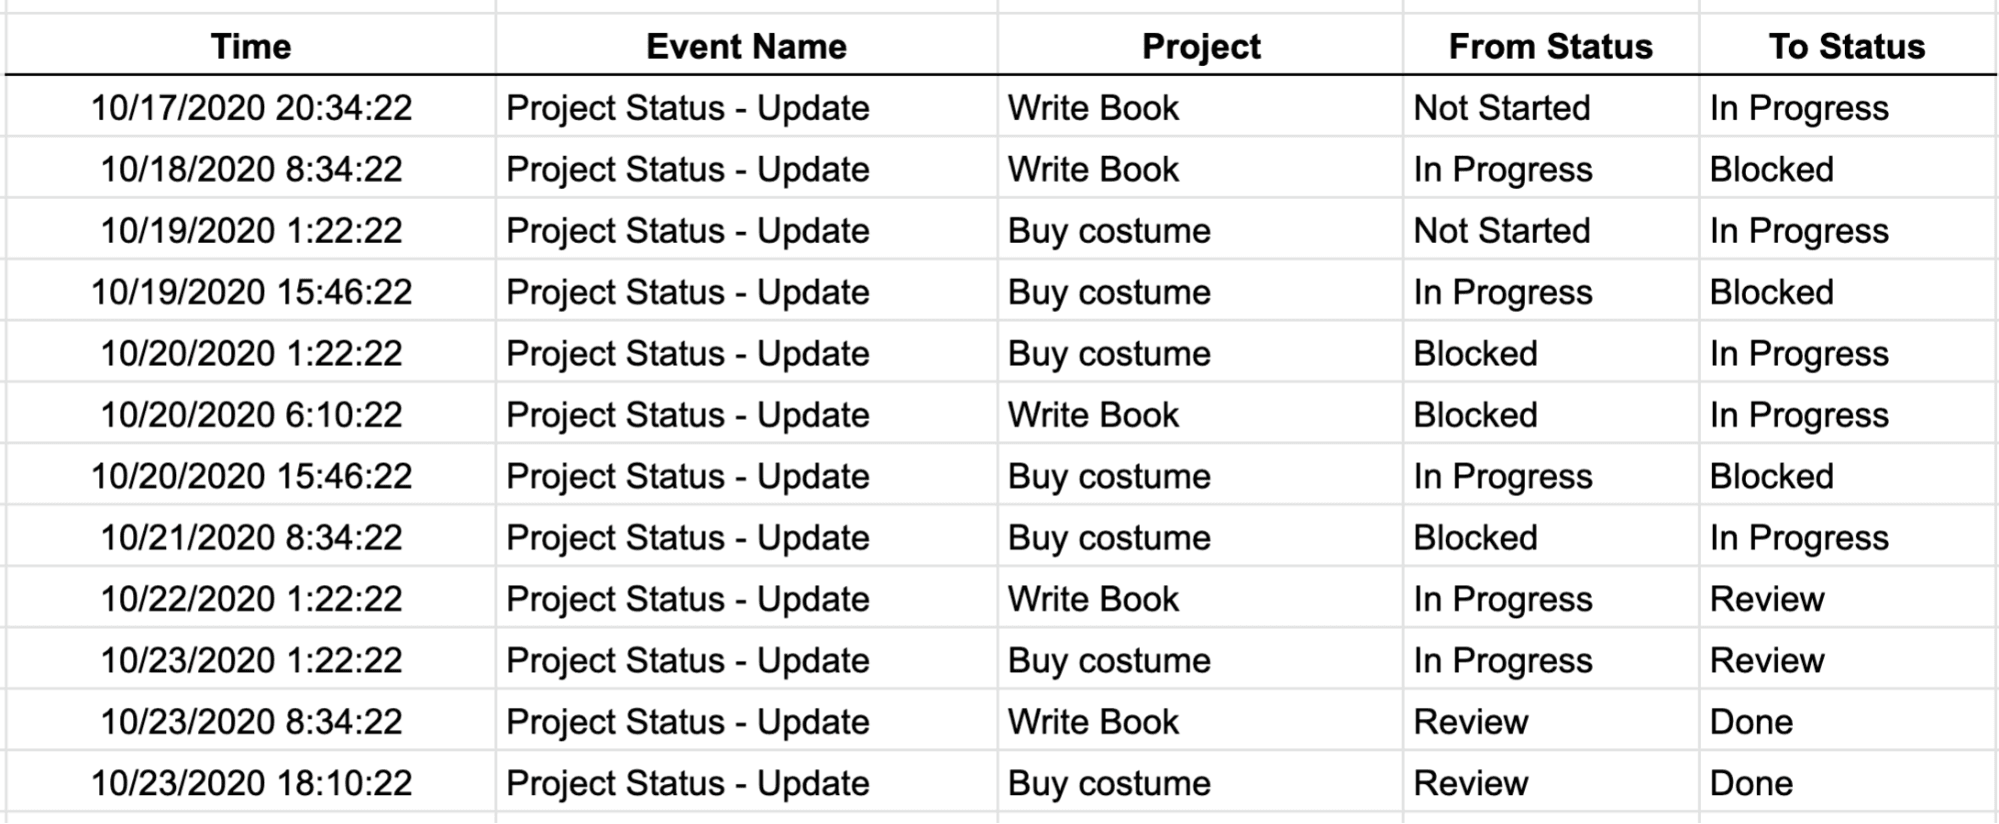
It looks weird in a spreadsheet! We are much more used to seeing things like:

or

Many people don’t have a sense for how event stream data “works” because they haven’t worked with data that looks and feels like event stream data. However, on some level, events are a lot more human! They represent things that happened that we care about!
Here’s where I think products like Amplitude can really help people. If you can think in terms of nouns, verbs, adverbs, and adjectives, you are well on your way to helpful product insights. A lot of the messy details are handled for you. Most people are able to 1) wrap their head around the idea of events, and 2) internalize the idea that if you capture things that map to the world of the customer and what they value, you’ll be in good shape. But it takes a bit of practice.
Here’s a quick little exercise. The purpose of this exercise is to show you how we can go from plain language descriptions of what is possible with a product to event definitions. And then go from event definitions to some basic insights. Think of this as a gentle introduction to thinking in terms of events.
Get out something to write with or type into. Visit a little hobby project I built with my friend Mattia Richetto. The project is called TeamPrompts. Take some notes about what you can DO with this product. If you were the product manager of TeamPrompts, what would you care about?
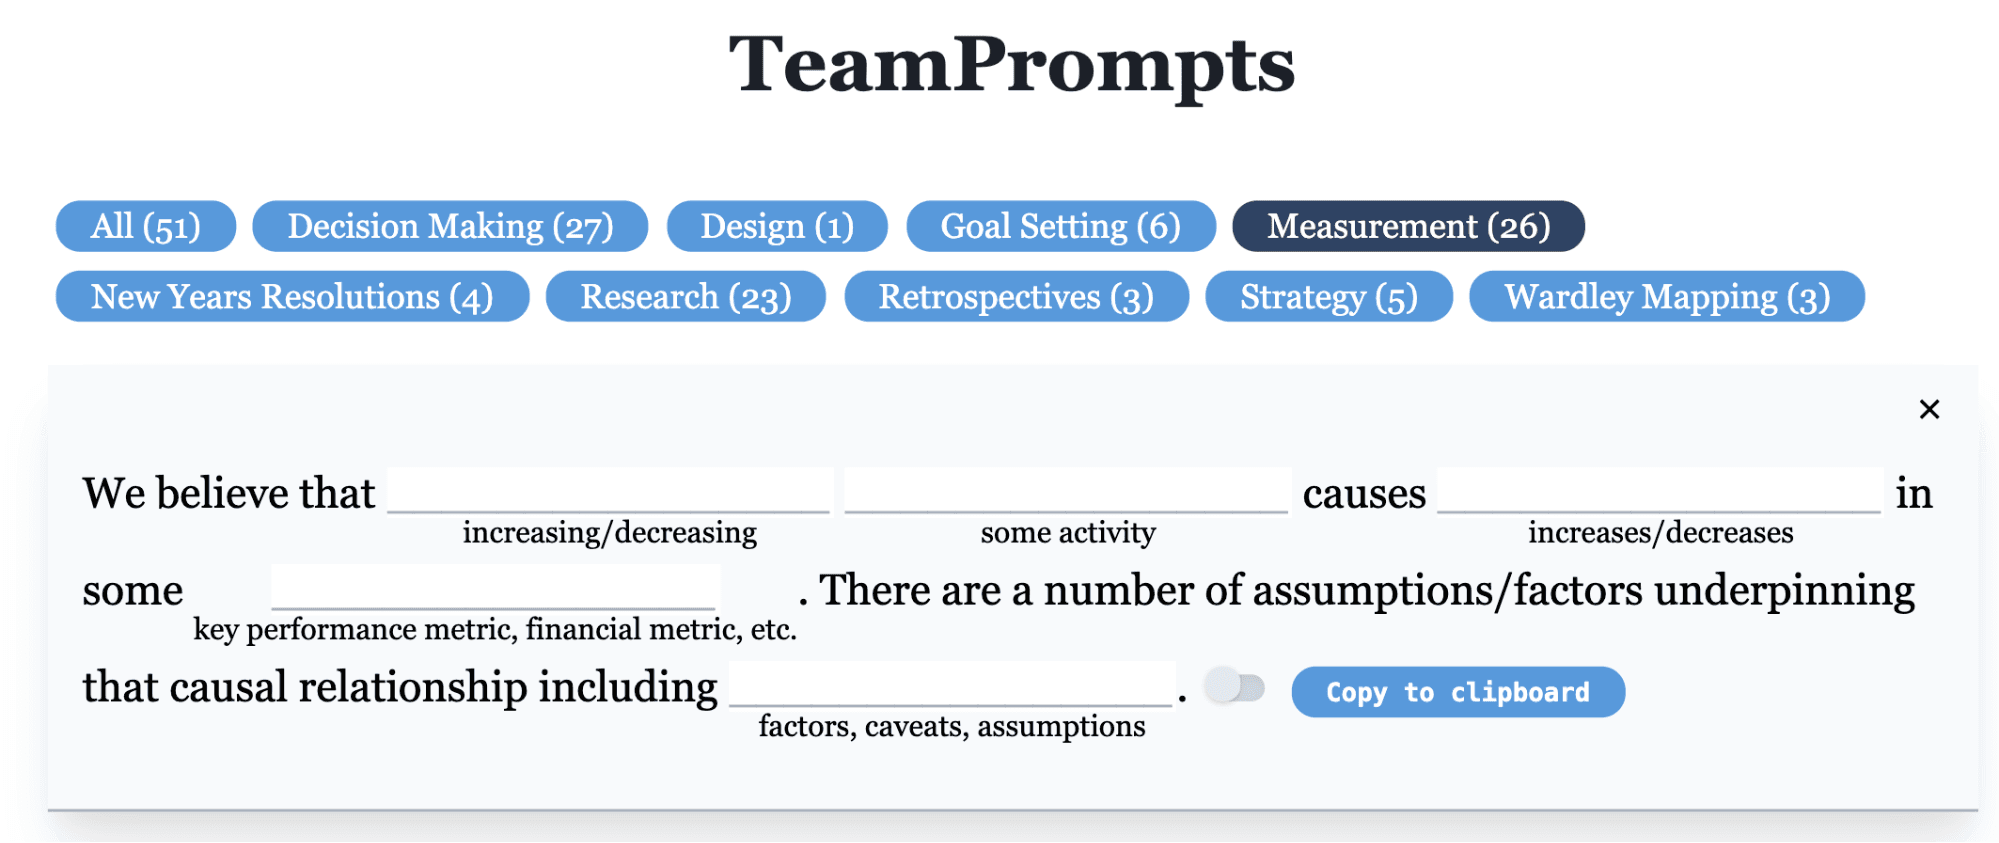
This is how I tackled the problem. Here are my original notes about what I can do with TeamPrompts. Note here that I am thinking squarely in the customer domain.
- The basic idea and promise: helpful prompts for brainstorming
- Valuable moments: filling in prompts, copying to paste elsewhere
- I can visit the product
- I can view prompts either in lists or one at a time
- I can see the groups of prompts (like Decision Making) with a direct link or by filtering
- I can fill in the blanks. I click into the blank. And then start typing
- I can show examples (and toggle that on and off)
- I can navigate around
- Open question: will people share these one at a time? At all?
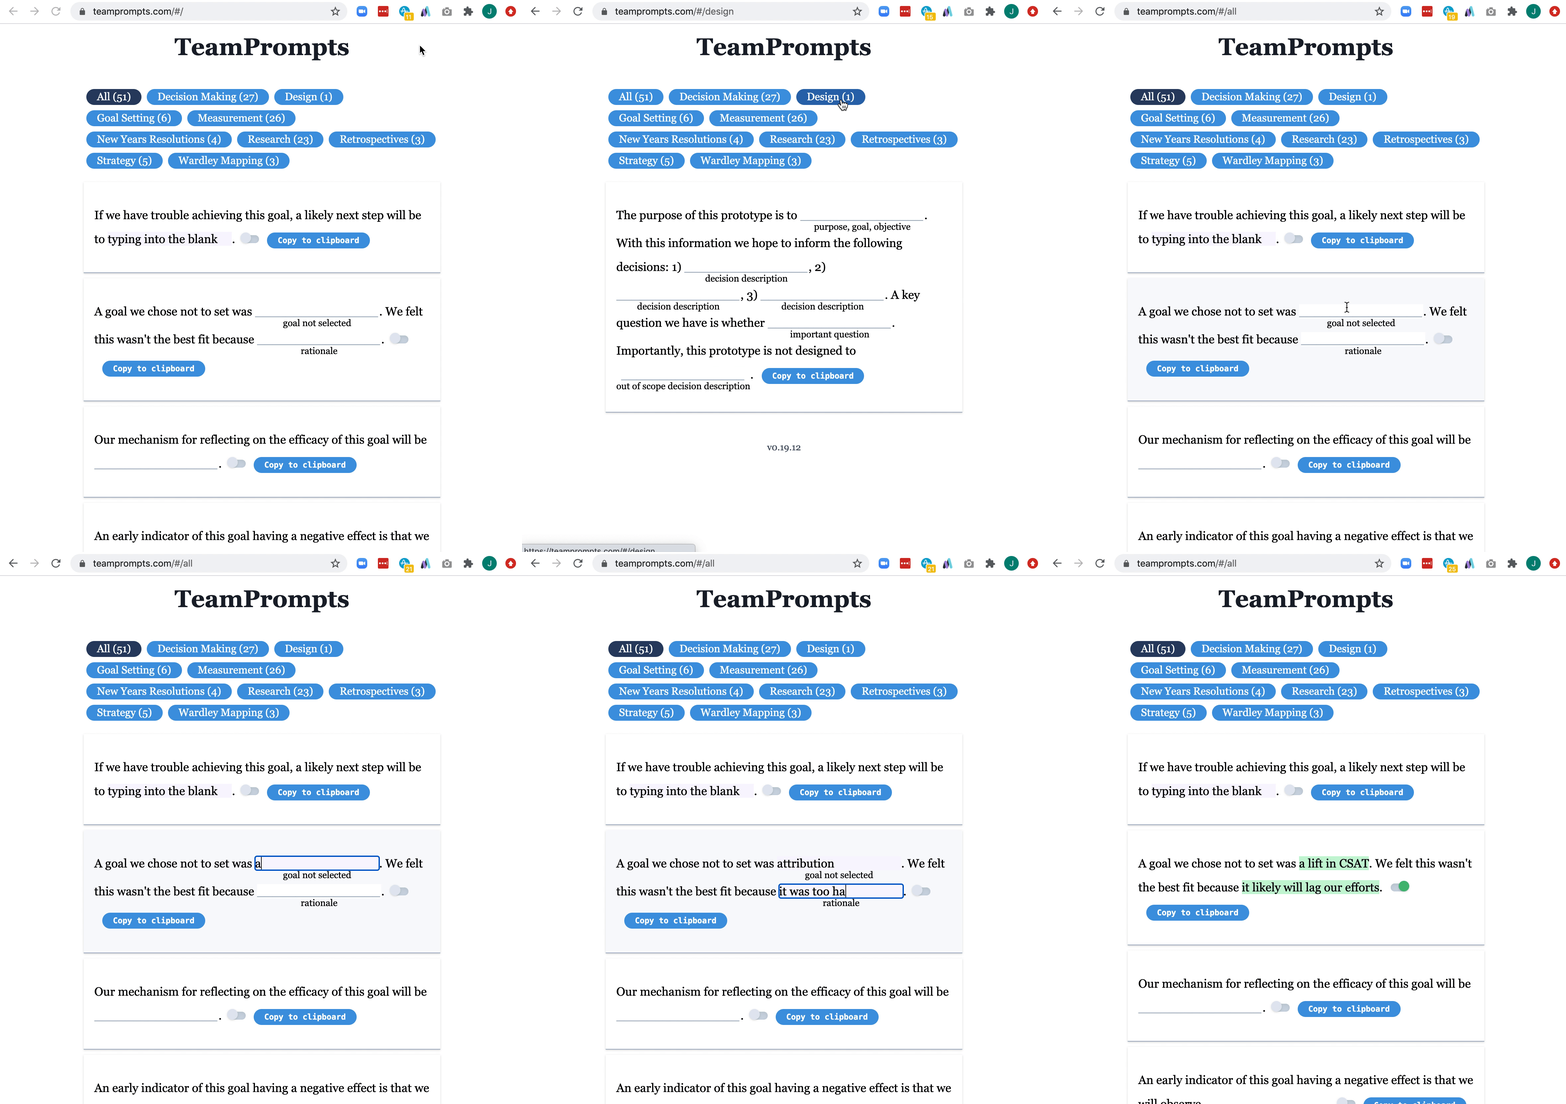
Try the product. Here’s an animated gif of some common actions.
Here’s what I put together for discussion with my developer friend Mattia:

Note how I force myself to think in terms of Verb-Noun, and provide a description from the perspective of the user. And then I describe some important properties. Properties provide more context about the event. You can think of properties as columns in a traditional database table or spreadsheet, except they represent characteristics of an event (a verb-noun combination) instead of an object like a person, project, or work order.
How did I figure out which properties to record along with the events? By asking some basic questions:
- What are the most popular collections? (Collection ID and Collection Name)
- What are the most popular prompts? (Prompt ID)
- Do people actually scroll? (View Position)
- Are people copying our examples, or their inputs? (Clipboard Content Type)
- Do people fill in the blanks? (Input Index)
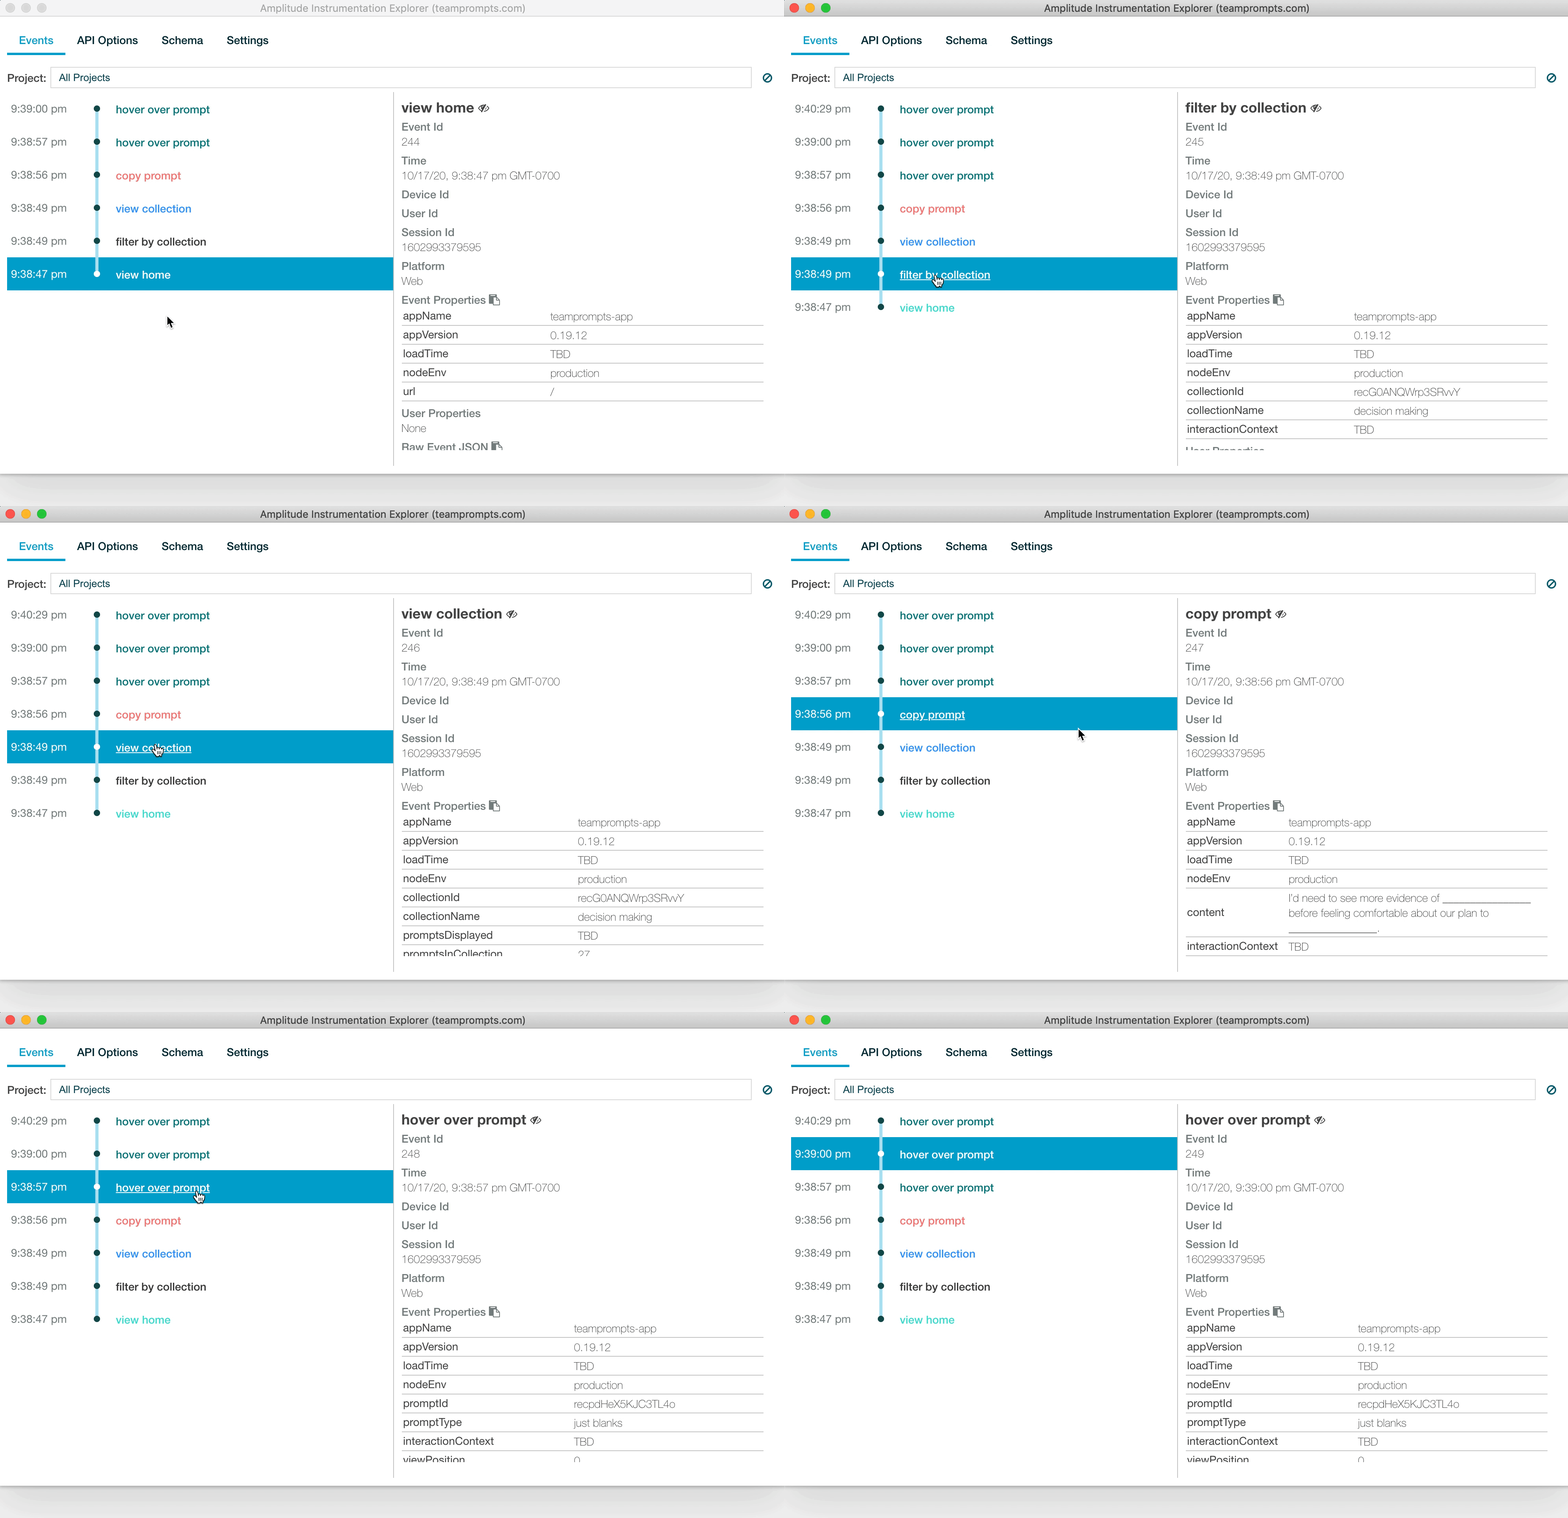
Using Amplitude’s Chrome Extension (as well as the product) we test to make sure things are working. Note the “stream” of events like View Home, Filter By Collection, Copy Prompts, and Hover Over Prompt. As a reminder, events are things that happened that we care about:
Since no one really looks at TeamPrompts, I shared TeamPrompts on Twitter to get some sample data (linking to a specific prompt). Here are a couple charts I created:
|
|
|
|
|
|
This is in no way an exhaustive list of answerable questions. The beauty of thinking about the customer domain and pondering some reference questions is that it unlocks a long-tail of questions.
Hopefully this short exercise/demo gave you some insights into working with event-like data (used for event-based analytics).
Thinking in terms of events and properties can feel a bit foreign, but it is the foundation of answering many of the important questions we have as product managers. If you have trouble, you likely have someone on your team who has worked with event-like data. Ask her to join the meetings and activities! Trust me…if you keep your events crisp and understandable, and think through the relevant properties, you’ll be in good shape.
The full series:
Part 1: Measurement vs. Metrics
Part 2: Use a Mixed Pattern Approach to Instrumenting your Product
Part 3: Keeping the Customer Domain Front and Center
Part 4: Learning How to “See” Data
Part 5: The Long Tail of Insights & T-Shaped Instrumentation
Part 6: Asking Better Questions

John Cutler
Former Product Evangelist, Amplitude
John Cutler is a former product evangelist and coach at Amplitude.
More from John
