Mapping Amplitude Data via Google Sheets Add-on
Map Amplitude data on Google Maps using the Google Sheet Add-on.
In a recent blog post, I demonstrated how to install and use the Amplitude Google Sheets add-on to embed data into a Google Sheet. After you embed data into a Google Sheet, you can manipulate it any way you want. You can also take advantage of other features and Google Sheet add-ons. In this post, I will show how you can combine the Amplitude Google Sheet add-on and Google Maps to visualize Amplitude data on a map.
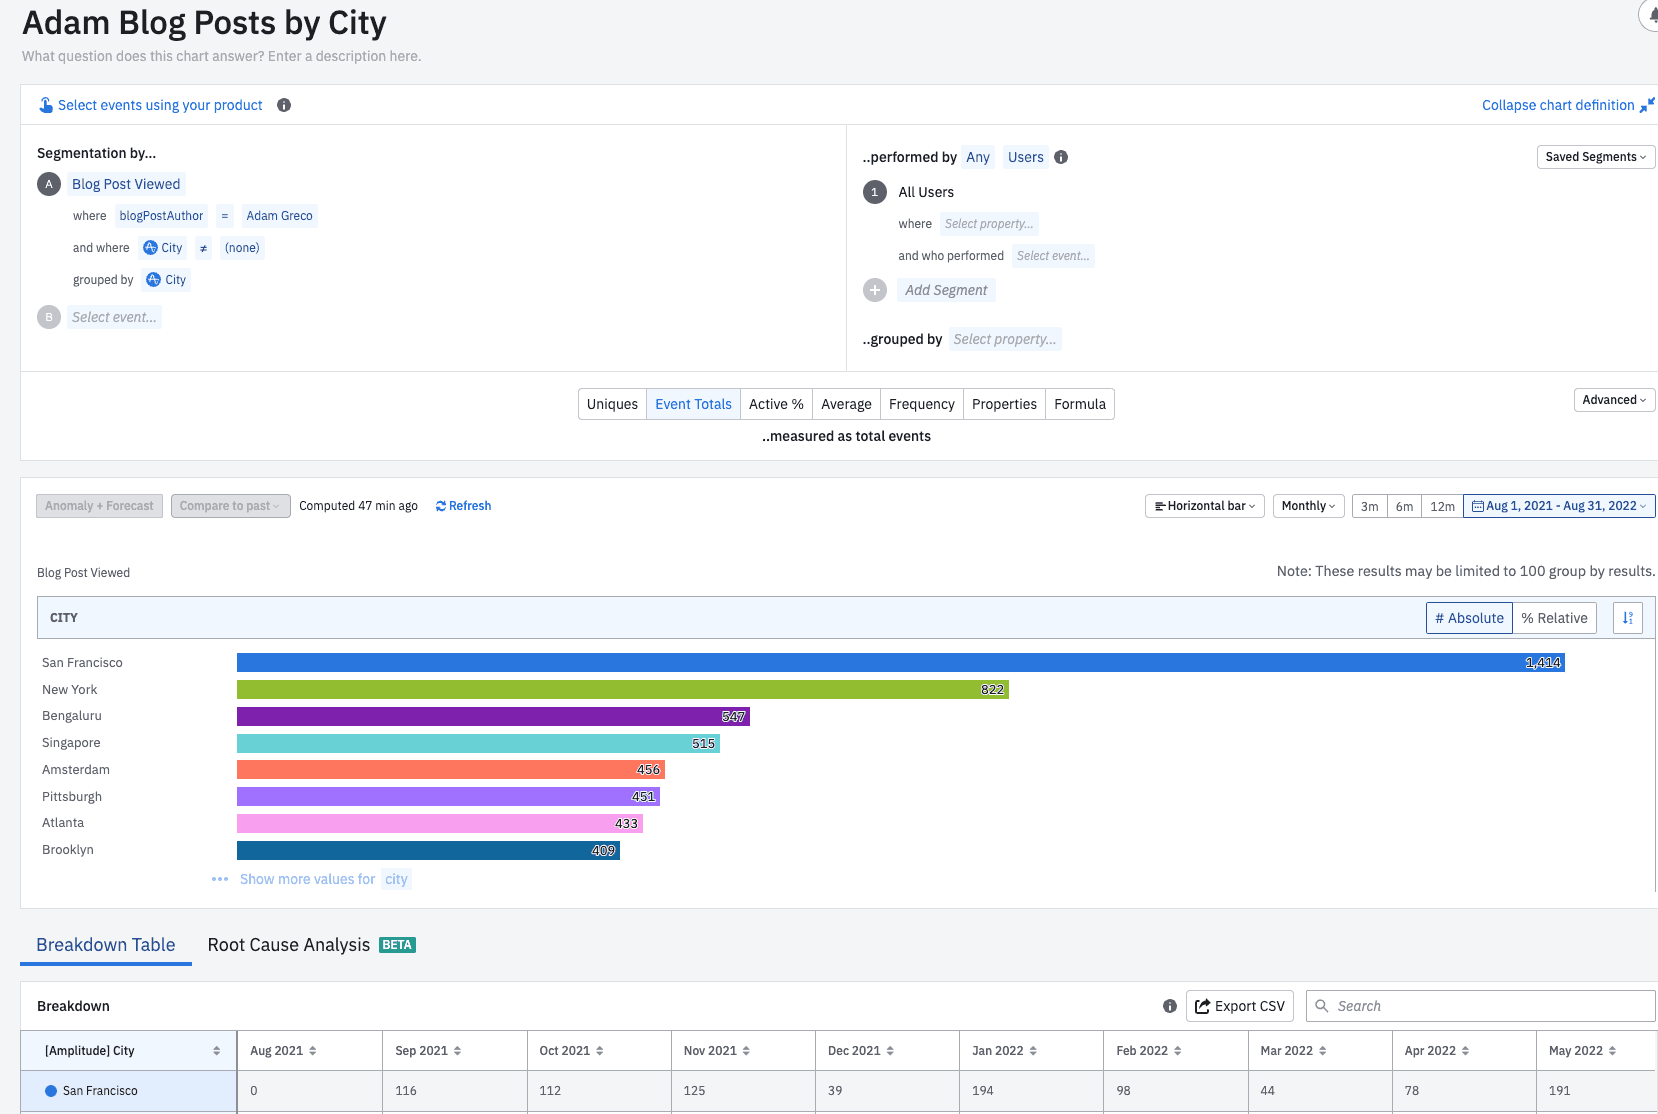
First, let’s create a report in Amplitude that has geographic information. In my previous post, I showed a report of my blog post views by city:
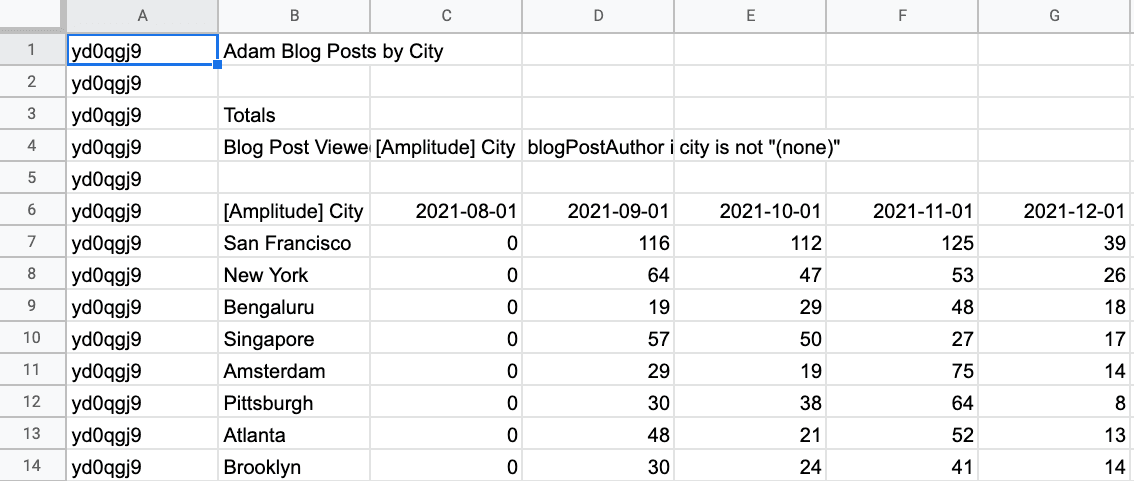
Next, I embedded this report into a Google Sheet:
After you have the data in Google Sheets, you can make a new tab and reference this data. In this case, I want to sum all blog post views by city, so I use formulas to do this in a new tab:
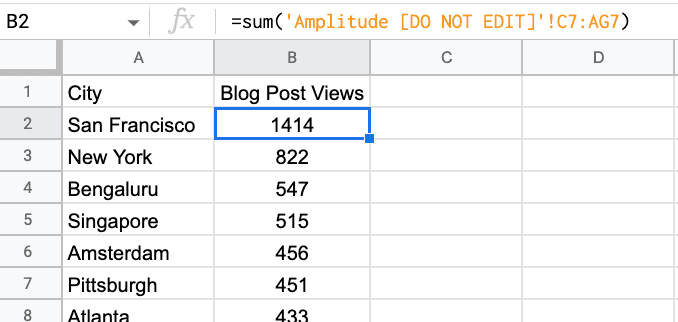
Note that for Google Maps to work, the data you want to map has to be in the first tab of the Google Sheet, so at this point, you need to make the tab above the first tab in the sheet.
Next, you can open Google Maps (which requires a Google Account) and click the button to create a new map:

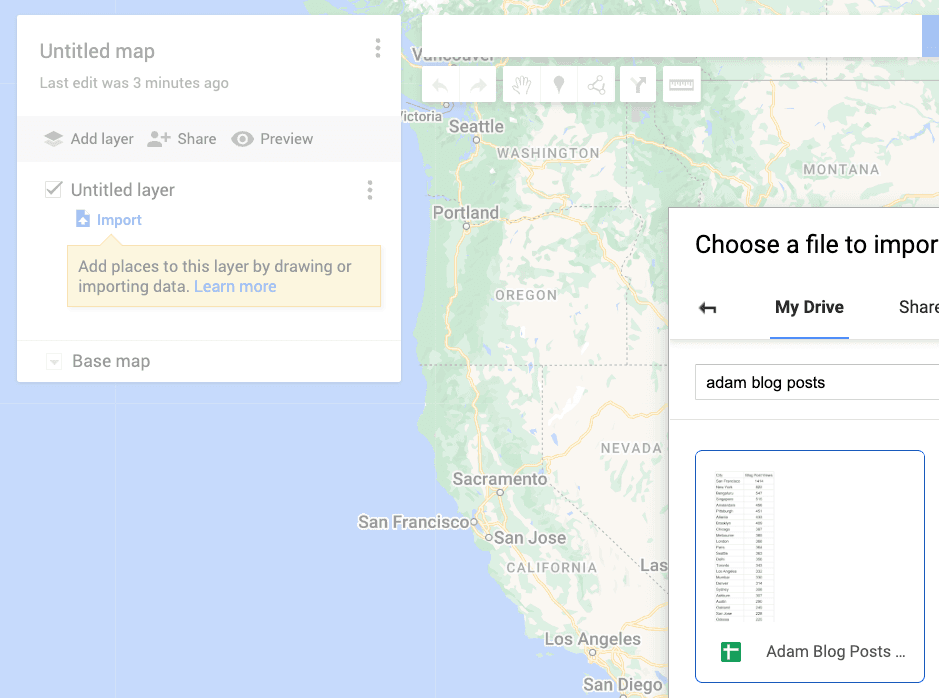
Then you will see a blank map, and you will click on the Import link under the first map layer and select the correct Google Sheet:
After you select the correct Google Sheet, Google Maps will ask you to identify the column representing the demographic information (e.g., city, state, country). You will have to do this twice:
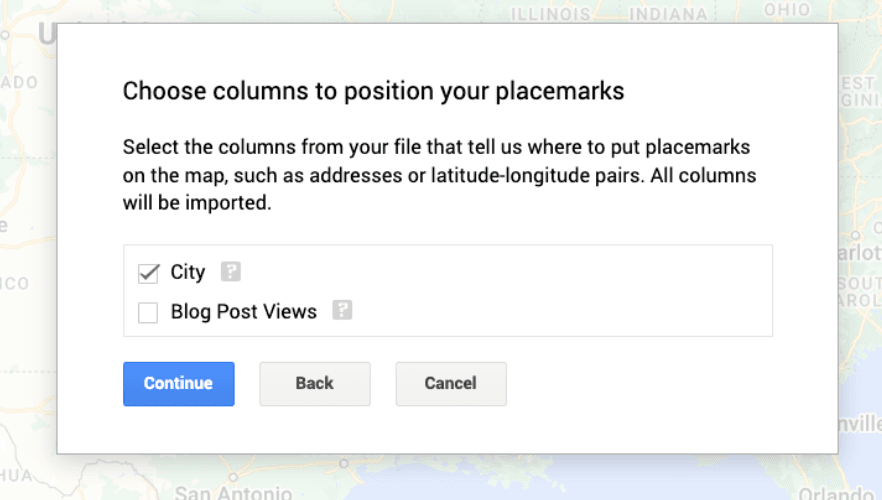
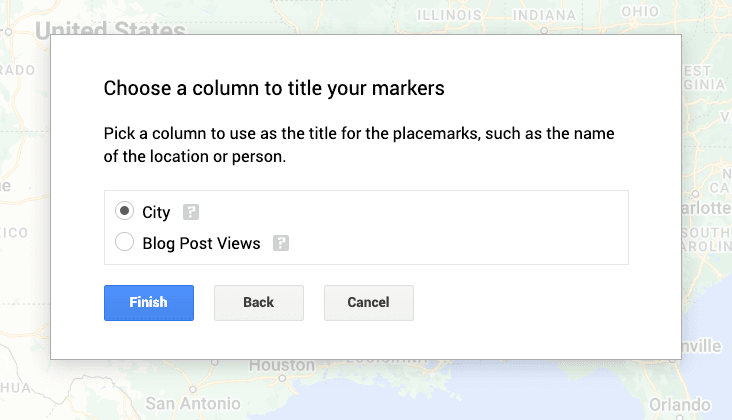
After you click the finish button, you will see your data plotted on a Google Map:
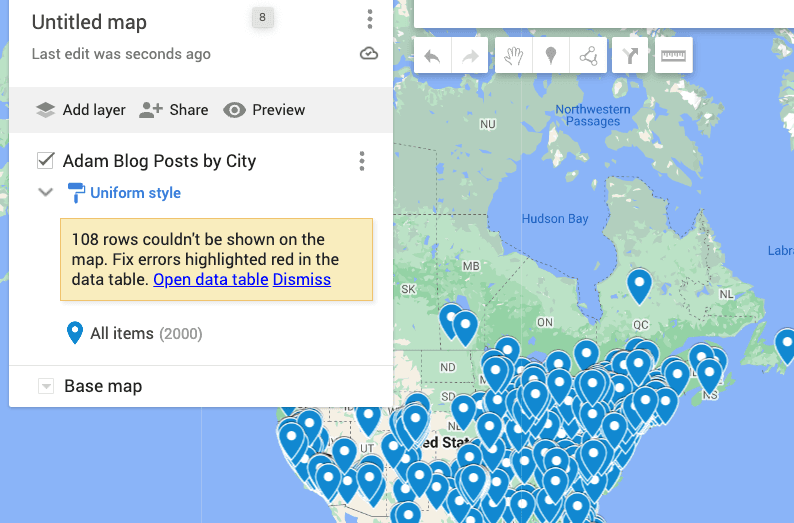
Within Google Maps, you can make edits, such as changing the markers, the type of map, or displaying the actual numbers. Those settings are located under the data layer (in this case, the link labeled “Uniform Style”). You may also see cases where Google Maps didn’t recognize the city, but those should be rare.
I suggest adding a title to the Google Map. You can also import multiple map layers, so if you want to see the same data for different date ranges, you can label each import with the date. You can see the title and data label here:
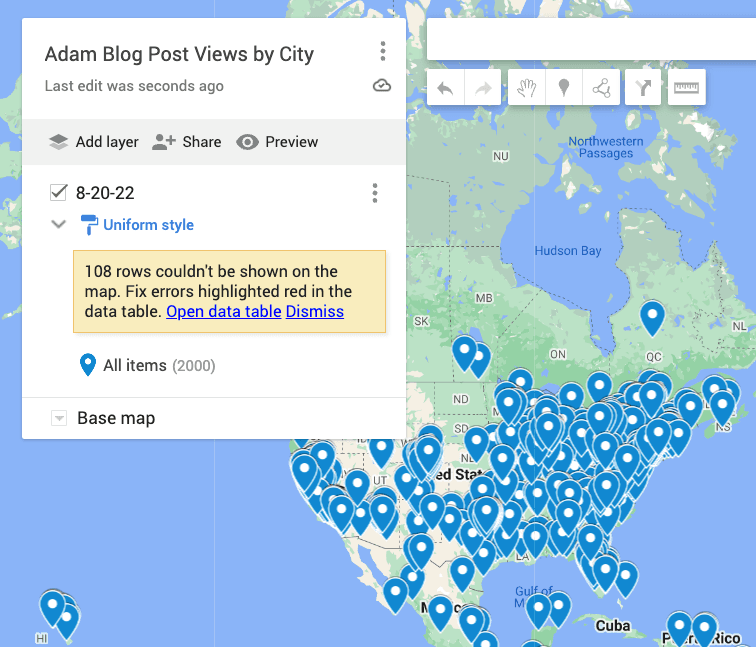
If you want to see a short video of me walking through the steps above, see below.

Adam Greco
Former Product Evangelist, Amplitude
Adam Greco is one of the leading voices in the digital analytics industry. Over the past 20 years, Adam has advised hundreds of organizations on analytics best practices and has authored over 300 blogs and one book related to analytics. Adam is a frequent speaker at analytics conferences and has served on the board of the Digital Analytics Association.
More from Adam
