Release Notes: March 2017
Discover new improvements to Amplitude for March 2017, including UI/UX developments, funnel upgrades, new event type deletion abilities, and SDK updates.
We’re excited to announce new features and improvements since our February product update. You’ll find major improvements and information on:
- UI/UX
- Change projects directly from chart view
- Search in data tables
- Tooltips on dropdowns
- Redesigned charts on dashboards
- Features Improvements:
- Funnels
- Event Segmentation
- Behavioral Cohorts
- New ability to delete event types
- Customize the ‘[Amplitude] New User’ definition (Beta)
- Resources
- Product Analytics Playbook: Mastering Retention
- Webinar Series
- SDK Updates
UI/UX Improvements
Here at Amplitude, we love hearing feedback from our customers and appreciate the time you all took in bringing these kinds of insights to us. We’re excited to push the following feature requests today and welcome any and all feedback in the future!
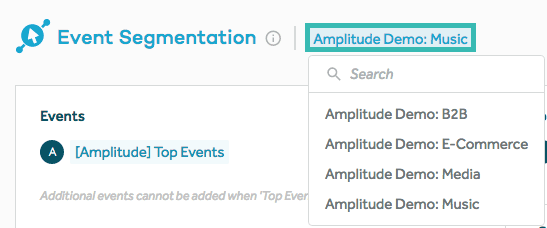
Change projects directly from chart view
From most charts, you can now directly click the project name to switch between projects. The platform will attempt to transform the current chart’s definition to match the new project (e.g. event types and properties that are project-specific will be dropped).
Search in data tables
You can now search for values in the breakdown data tables below each chart.

Tooltips on dropdowns
If you hover over values in the dropdown menus, a tooltip will appear with the full name. This is useful if you are tracking long event types, properties, or property values.

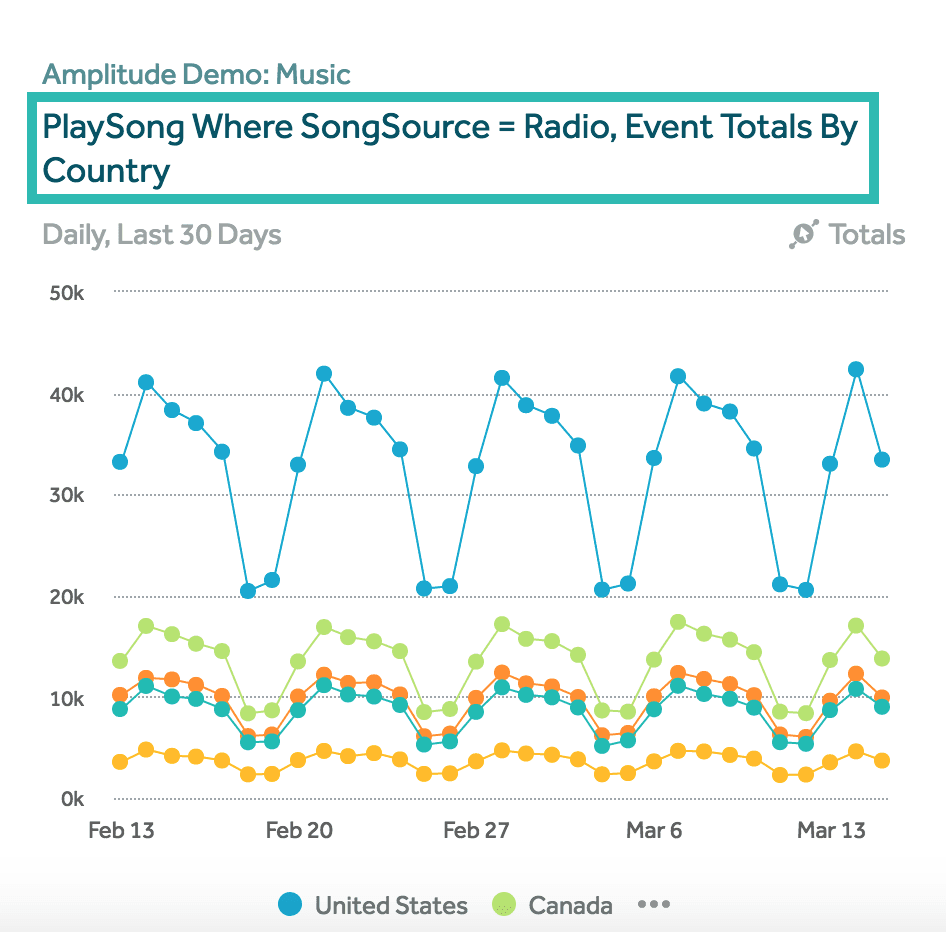
Redesigned charts on dashboards
Charts added to dashboards can now have multi-line titles. There were also some other small visual changes to the delete from dashboard and expand icons.
2) Feature Improvements
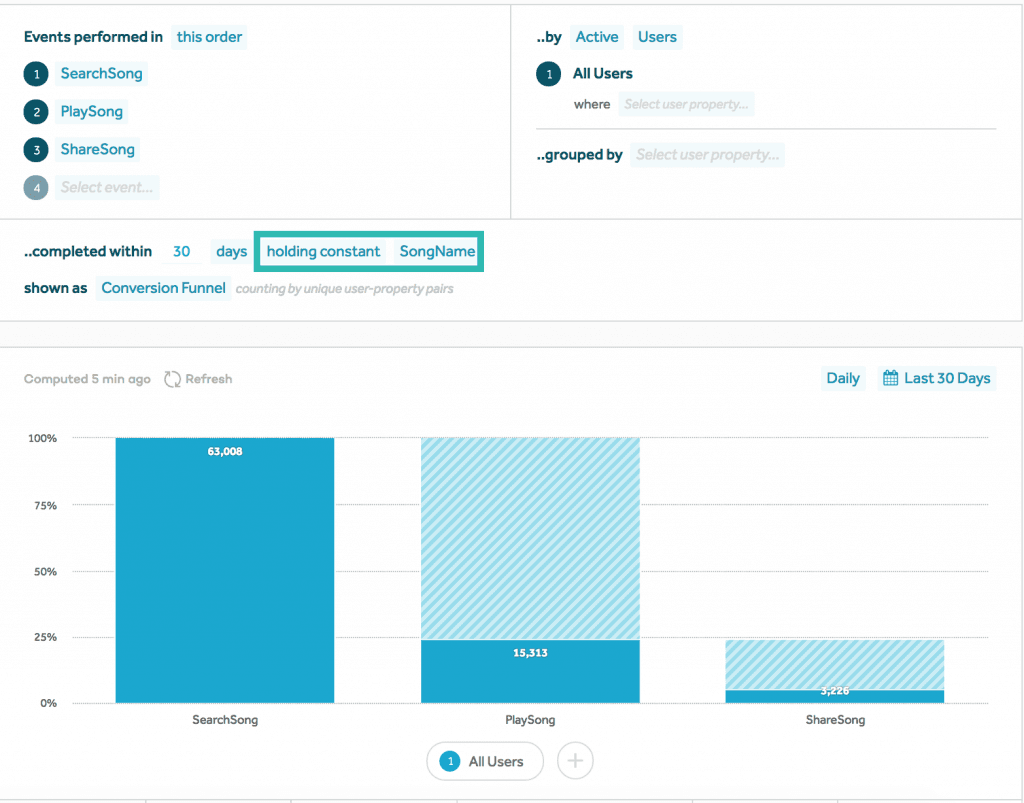
Funnels: Holding a Property Constant
You can now choose to hold a property constant throughout all steps of a funnel chart. This is helpful if you wish to see how different properties affect conversion rates through a funnel. Read more about holding a funnel property constant here.
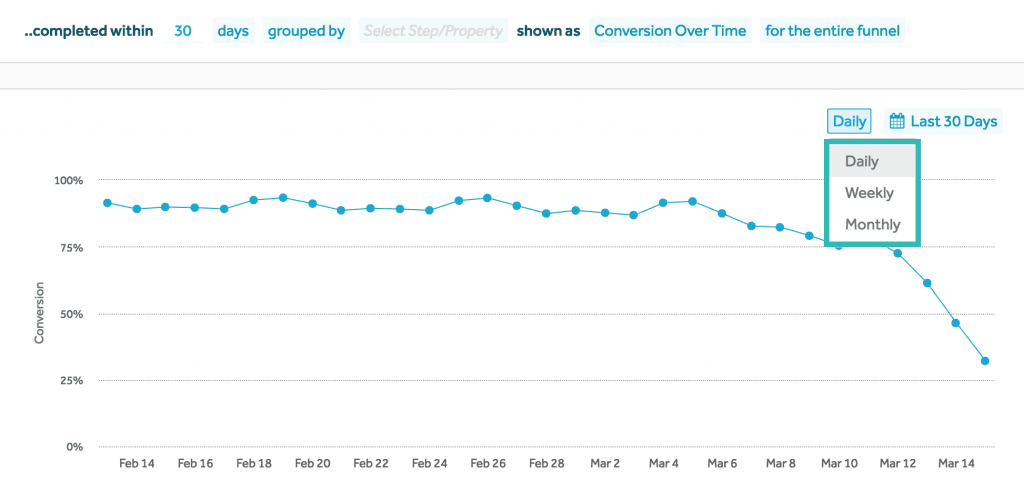
Funnels: Weekly and Monthly “Conversion Over Time”
You can now view “Conversion Over Time” in weekly or monthly intervals. Previously, only daily intervals were available.
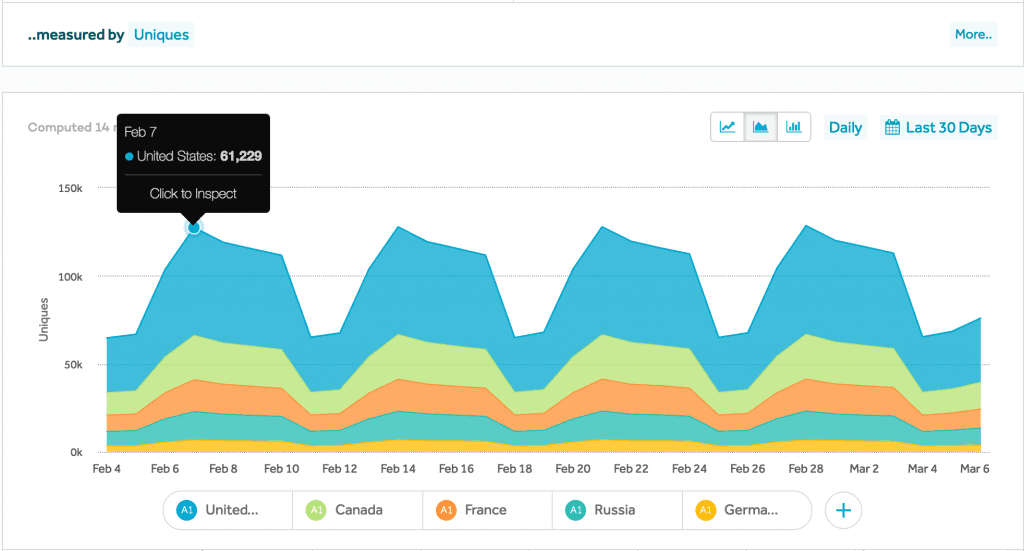
Event Segmentation: Stacked Area Chart Visualization
You can view certain measurements as a stacked area chart now. To view data in a stacked area chart, click on the stacked area chart icon in the top left corner. Find information on how to read the stacked area charts for each measurement here.
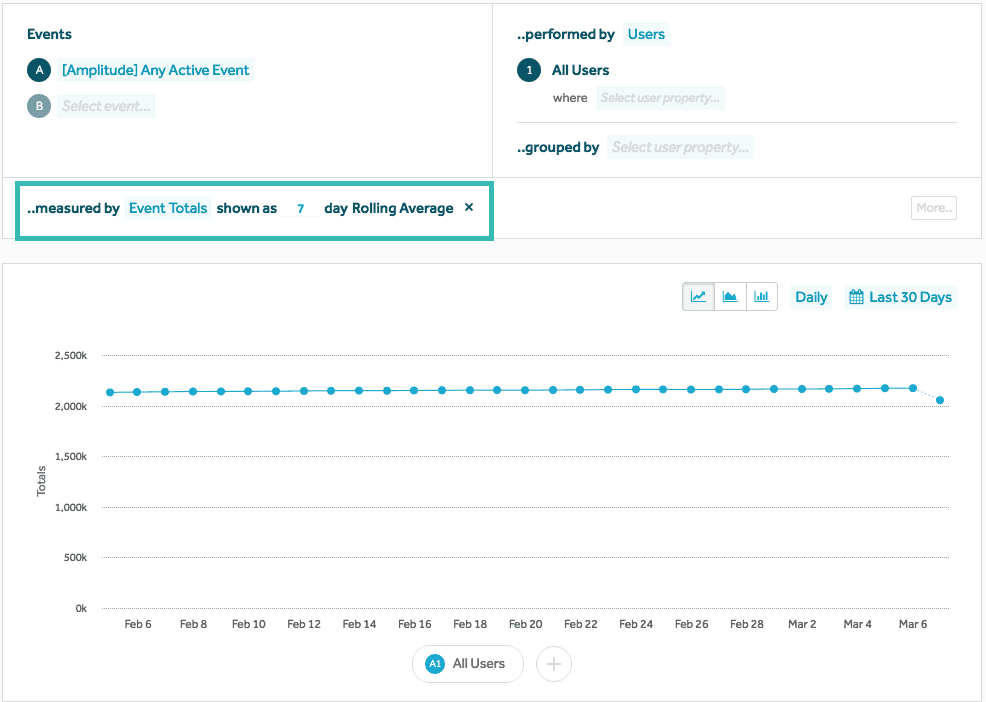
Event Segmentation: Measure by Rolling Averages
You can now measure by rolling averages which will “smooth out” a chart. To switch to this view, click the “More…” button in the right side of the bottom module. Find more information about how to interpret rolling average charts here.
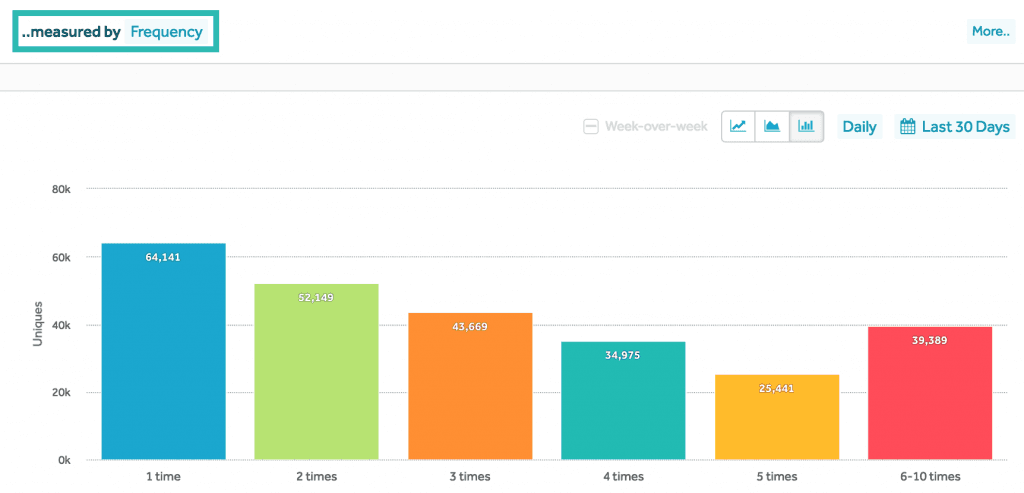
Event Segmentation: Frequency
The previously-named “Histogram” metric has been changed to “Frequency”. You are also now able to view that metric as a line chart, stacked area chart, and bar chart.
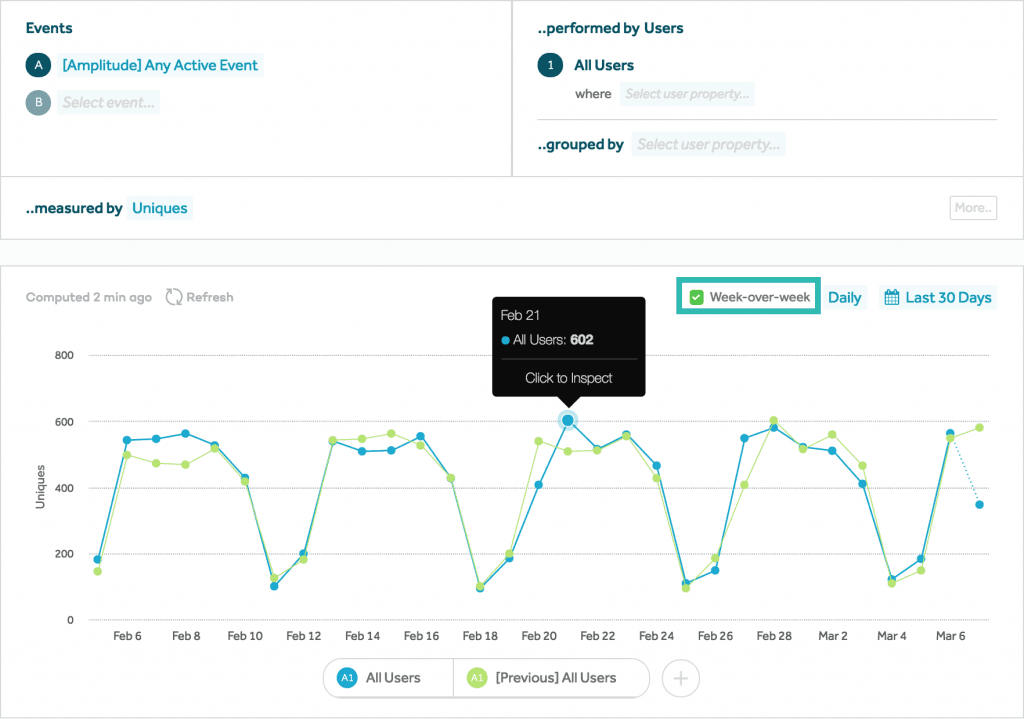
Event Segmentation: Period-over-Period Comparison
(Enterprise Only)
You now have the ability to perform a period-over-period comparison on your data. To do this, click the checkbox to the left of the datepicker. Find more information about this feature here.
Behavioral Cohorts: Conditional Cohorts
(Enterprise Only)
We introduced a new “or” clause that you can use to compare the number of times a user performed one event to another. To do this when creating a cohort, select “relative count” under the “performed Event” clause. Read more about how to create conditional cohorts.

3) Delete Event Types
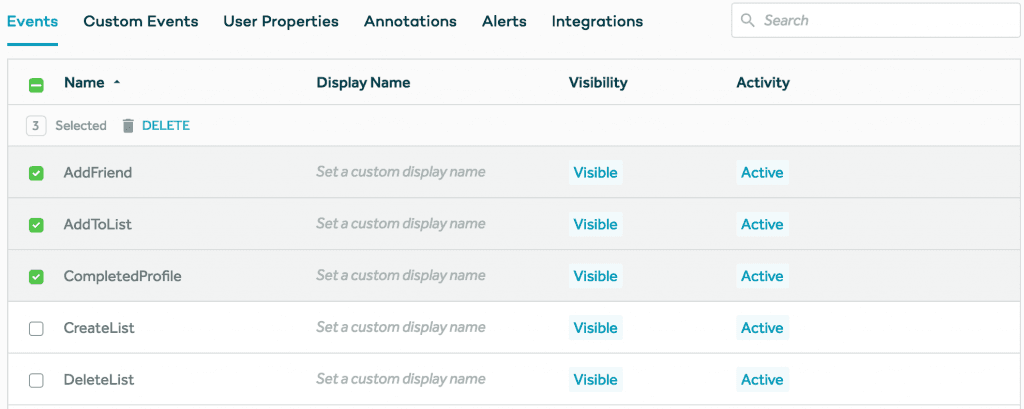
Organization admins and managers now have the ability to delete unneeded event types directly from each project’s settings page. Please be sure to thoroughly read the documentation as deleting data is permanent and irreversible. Instructions on how to delete event types can be found here.
4) Customize the ‘[Amplitude] New User’ Definition (Beta)
(Enterprise Only)
We are now offering our Enterprise customers a beta service to customize Amplitude’s auto-generated definition of the ‘[Amplitude] New User’ event and cohort. The beta service allows you to define a new user by a selected set of trigger events, i.e. a user would only be considered “New” if they perform at least one of the trigger events.

5) Resources
Here are some new resources we think you or your team will find helpful!
Product Analytics Playbook: Mastering Retention
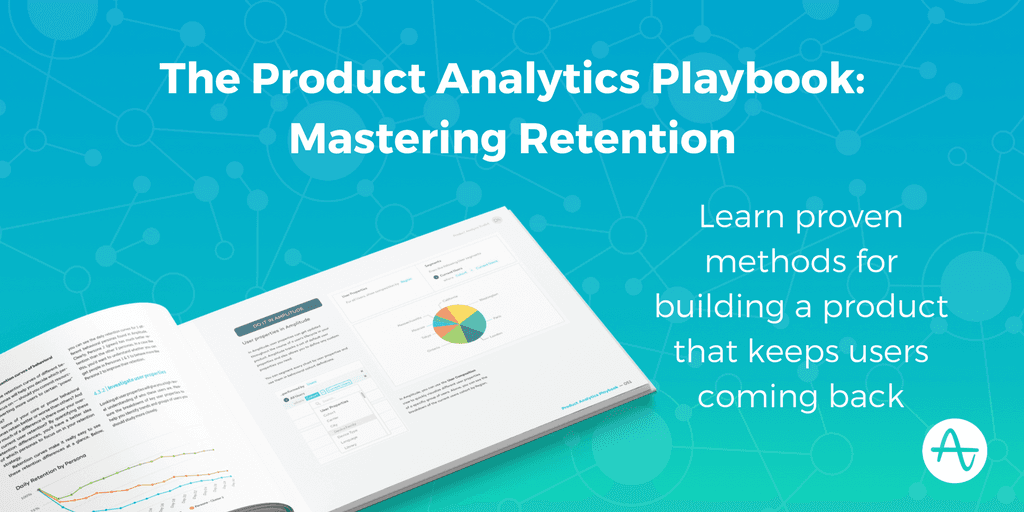
A couple weeks ago, we released the Product Analytics Playbook, Volume 1: Mastering Retention. This first volume provides a thorough 155-page guide on how to use data to make better product decisions and improve user retention. You can download the full volume online.
Webinar Series
Since January, we’ve been hosting a weekly webinar series on the Amplitude platform. During the webinar, you can ask questions via a chat box and someone at Amplitude will immediately respond to your question, so that the webinar host is not disrupted. Some previous webinars include an Amplitude Platform Training for New Users and a Deeper Dive in Retention & Stickiness. You can find and register for our next webinars here.
6) SDK Updates
There have been some updates to our SDKs and we highly recommend that you update your SDKs to the latest versions:
- Amplitude-Android v2.13.3 Since v2.13.2:
- Handle exceptions when reading from database. Only affects certain Fairphone and LG devices.
- Handle exceptions when building request to upload event data. Only affects certain Lenovo devices.
- Amplitude-iOS v3.14.1 Since v3.14.0:
- Catch exceptions when looking up device carrier.
- Fix build warnings caused by certificate files in the Podfile.
- Fix warnings for missing new line at end of files.
- Fix linker warnings when using Amplitude framework in an extension target.
7) Questions?
If you have any questions, comments, or concerns, please reach out to contact@amplitude.com. You can find previous release notes here. Lastly, we’d appreciate your feedback on our product updates. Please let us know what’s working well or what you’d like to see improved through this form.

Justin Bauer
Former Chief Product Officer, Amplitude
Justin Bauer is a former Chief Product Officer at Amplitude, where he strove to make it easy for companies to make better decisions from their data. He’s a 2x entrepreneur as well as an alumnus of McKinsey, Stanford GSB and Carleton College.
More from Justin


