New in Amplitude: SQL in the Dashboard, Combined Events Segmentation Tab, & Improved Email Reporting
Check out the simplified Events tab UI, a new real-time activity graph, SQL in the dashboard, and improved email report settings.
We’re excited to announce some product updates from the past month, including a simplified Events tab UI, a new real-time activity graph, SQL in the dashboard, and improved email report settings.
Combined Events Segmentation Tab
After gathering and analyzing all of your feedback, we have simplified our UI by combining the Events Segmentation and Events Properties tab, making it easier to view aggregation of properties. This combined tab is the new Events Segmentation tab.
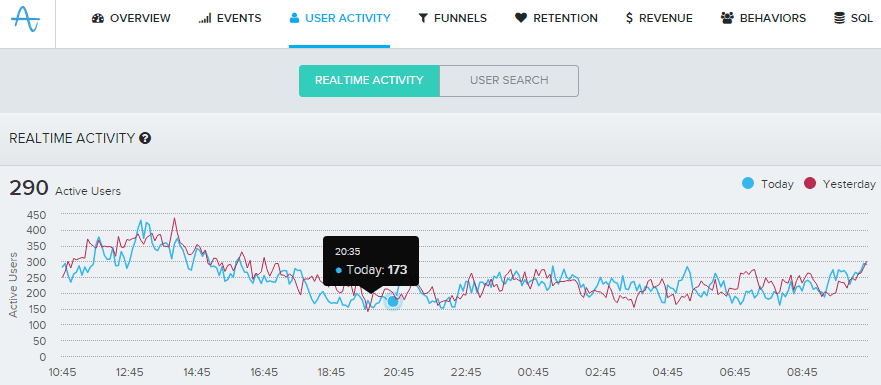
Real-time Active User Counts
For enterprise customers, on the User Activity tab above the realtime map, we now display a graph that shows the** number of active users in your app at 5 minute intervals for the last 24 hours**. You can compare the counts of active users from today vs yesterday to see spikes in usage.
New SQL Tab
Enterprise customers who get access to their raw data in a dedicated Amazon Redshift cluster can now leverage the new SQL tab to write raw SQL queries in the Amplitude dashboard. Tables of amplitude_id’s or user_id’s can be directly saved as as a Behavioral Profile (formerly Behavioral Cohort) for further analysis within the dashboard like on the Retention and Funnels tabs.
Improved Email Report Settings for Custom Dashboards
Enterprise customers who are able to send custom dashboards as email reports now have the power to customize their reports. New customization options are available for: report time, email recipients, and CSV attachments.
Other Updates
User Properties in Events Segmentation Tab
You can now segment on User Properties in the properties dropdown in the Events Segmentation tab. This will filter events done with that user property at the time of the event.
‘Contains’ in Properties Filter in Behavioral Cohorts
You can now use the ‘contains’ function on a property filter when creating a Behavioral Cohort.

Alan Ibrahim
Former Director of Customer Success, Amplitude
Alan is Amplitude's former Director of Customer Success, where he lead our North American Success team. As Amplitude's first employee, he built out our Customer Success function from scratch!
More from Alan


