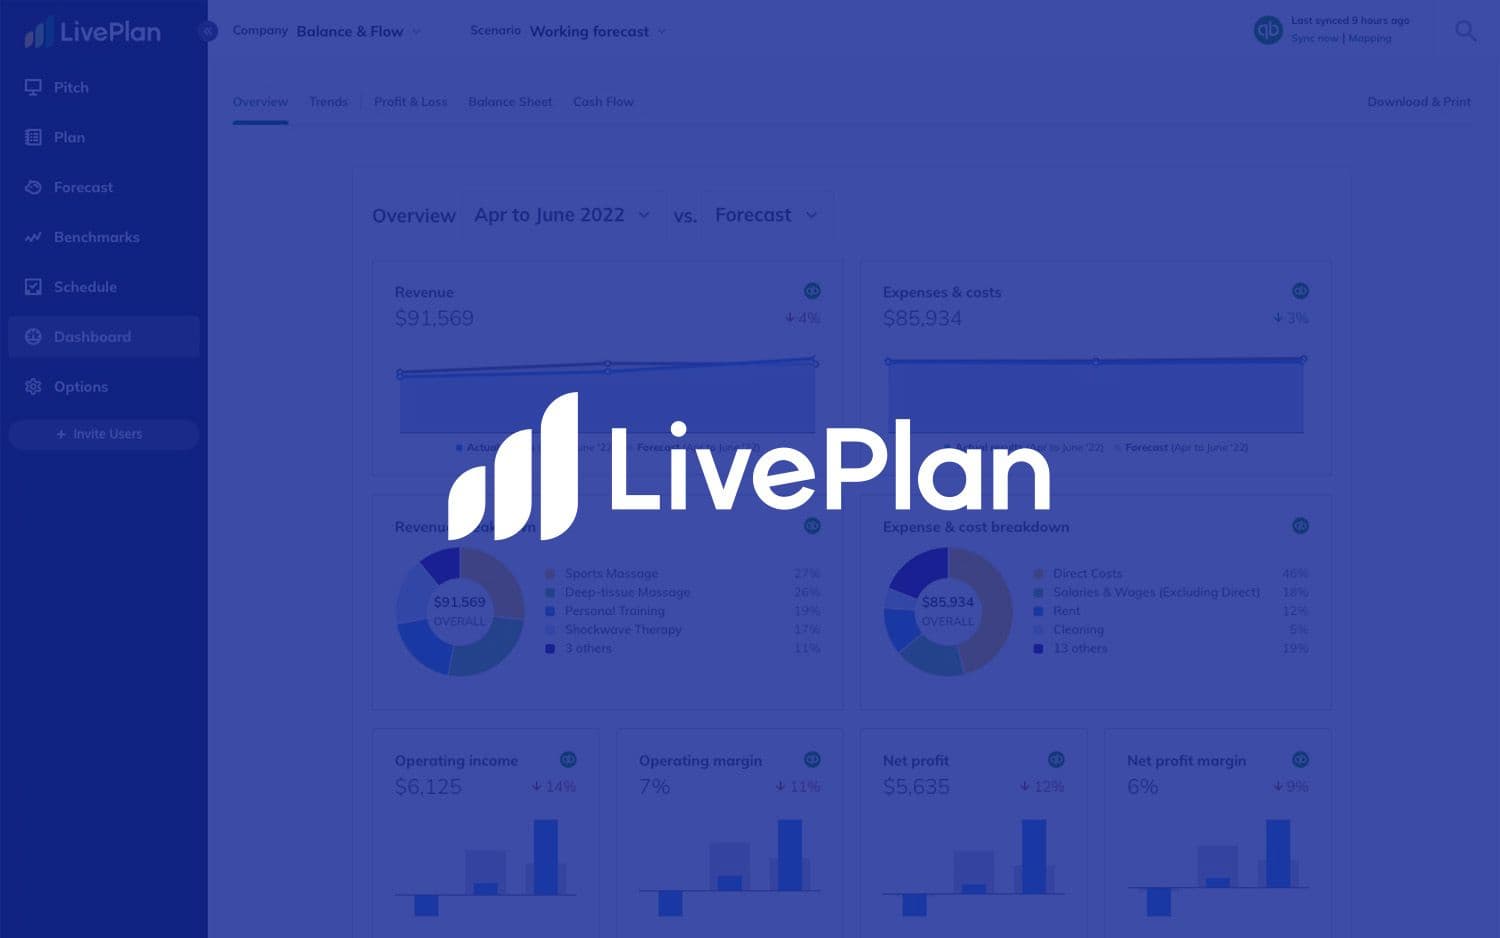
How Better Data Helped Palo Alto Software Improve Engagement and Conversions
Palo Alto Software leverages Amplitude to create more elaborate cohorts and make better decisions about where to spend marketing and advertising dollars.

Insights/Action/Outcome: The marketing team at Palo Alto Software saw that new users were more likely to upgrade to the higher-tier package when asked after the onboarding process. By waiting until users were more comfortable with the platform to introduce the upgrade, users were more likely to convert.
Creating a business plan is just the first step in running a business. A business owner is never really done planning. They have to forecast—and be ready when the forecast changes. The past couple of years has taught us that if a company can’t pivot quickly, it won’t stay in business. That’s not great for business owners, employees, or the economy that relies on their success.
Tim Berry spent years helping startups and tech manufacturers to develop business plans. At one point, he realized he couldn’t write business plans for everyone, but he could try to help people write their own business plans better. So, he created a company that would enable customers to understand how to ensure business success in the long run. Today, Palo Alto Software builds the world’s leading business plan, management, and growth software.
Getting the right message to the right people
Palo Alto Software focuses on ensuring that the customer understands what they need to do and empowers them to make better decisions. That mission is one of the reasons I came to work for the company.
I am a data team of one, and my superpower is offering different insights to various roles within my organization. The marketing team is interested in completely different trends and data points than backend developers, for example. It is my job to interface with everyone and use our data to improve outcomes, which is even more important in unpredictable times.
Despite signs of economic uncertainty, there are still areas of growth. One of our challenges is ensuring we have a foothold in those areas and connecting with potential users who might benefit from those opportunities. The problem was that strategy required a depth of data that wasn’t possible with our old analytics solution. It was time for something new.
Finding Amplitude for better information and smarter decisions
Palo Alto Software used Kissmetrics for just over a decade. We eventually outgrew their toolset and needed something more robust. We have a complicated data setup that doesn’t fit everybody’s schema. So when we found Amplitude, we thought we’d try the platform to see what our data would look like there. We liked what we saw, and we saw a lot.
If you can analyze the habits of a particular group of people, you can get a better sense of how your marketing efforts impact long-term relationships.
Amplitude had a lot of features like stickiness charts, advanced segmenting, and the ability to determine active usage, all of which we wanted. We upgraded to an Amplitude subscription in July 2021, and right away, we could see how many distinct sessions people have in a given day and how long those last. By tying this information to promo codes, we began to analyze the habits of particular groups of people and get a better sense of how our marketing efforts impact long-term relationships.
Making changes based on Amplitude insights
The insights we’ve seen in Amplitude have significantly influenced our work. For instance, we’ve seen how user cohorts based on promo codes have strengthened our growth strategy. We can track and better understand the user journey by slicing user groups through attribution and data tables within the platform. It is now possible to direct advertising dollars toward user groups more likely to maintain long-term relationships.
Perhaps one of the most significant changes of the last two years was our move to a two-tiered system. Where we once had one flat rate for all users, our products now come in two levels.
With Amplitude, we can segment the customers who buy our standard version and we can identify which specific actions are more likely to indicate a future upgrade decision. Amplitude made it much easier to identify these customers and better leverage our relationships.
Our marketing teams have taken this information and run with it. They place a lot of importance on targeting the right users for the right product. We used Amplitude to track several cohorts of users over time to better understand which customers were more likely to increase their spend with us. Surprisingly, we learned that attempting to convince users to upgrade too early in their customer journey could generate more churn.
It turned out that our customers are more likely to be receptive to upselling attempts after they have had a chance to understand the features available in the app. We noticed that if we waited on upgrade messaging until people had a little bit more familiarity with the product, we saw a higher conversion rate. Seeing this, we changed our messaging to say things like, “Now that you’ve finished that part, did you know that you could do this?” and people are much more receptive.
All of these insights are possible using built-in charts rather than creating complicated workarounds. It is easy, for example, to use the platform to gain specific information about intervals within a cohort. We can look at how many users logged in for a specific number of different days within a given month. It is also possible to examine what kind of tasks they completed. These insights are essential to understanding active versus engaged users.
I meet with marketing staff each week to analyze and inform decisions about where to spend advertising dollars. We can group users by promo codes and explore how they interact with our ads and marketing sites. By creating expected lifetime values for each customer group, we can better maximize our marketing dollars. Where once we based these decisions on out-of-date monthly or even quarterly reports, it is now possible to fine-tune a formula that helps us capture the attention of our most important clients. By catching the attention of people ready to make the most of our products, we can position ourselves and our customers for long-term business success.
I also meet with product and user engagement team members weekly where we sync up on how users are interacting with updates to our products. It is exciting to see how ongoing changes we make improve the ease of use, or discoverability of different parts of our app. When we want to roll out a change, Amplitude makes it easy for us to A/B test an improvement to make sure that the updates we make are helpful and encourage the behaviors that we expect them to. The last thing we want is to roll out a new visual improvement that ends up confusing users.
By providing up-to-date and easy-to-visualize data, developers and marketing staff can more directly make inferences that improve their daily work.
Amplitude has made all of our data much more accessible, uncovering opportunities to meet our customer’s needs in new and different ways. It’s also easier for us to interact with each other—which is especially important in my role. By providing up-to-date and easy-to-visualize data, developers and marketing staff can more directly make inferences that improve their daily work.
The Problem with being free
If you’re reading this, you might be thinking, why would I use Amplitude when I can use Google Analytics for free? In a perfect world, some people might be able to send all of their data into Google Analytics, but anyone who’s used Google Analytics for any amount of time knows there are a lot of eccentricities with trying to do real data analysis in their system. Everything is anonymized and most of the data is heavily sampled, so it’s hard to know that the call you’re making is the right call for the more specific user or group you’re trying to see.
When we are binding Google data, we don’t get to see super accurate per-person metrics because we can only bind to the attribution of X person touched X ad. In Amplitude, we can build cohorts out of those and track their data and app usage more specifically than we could if we were sending the massive amounts of data that we’re looking at to Google Analytics.
The data sampling is a problem. On a random Wednesday, we could ask Google Analytics, “How many people did this thing today?” It would come back with, “It was X amount of people.” And then the following week, we could ask, “What did that look like last Wednesday?” And it would come back with a totally different number. While you might think that you’re up 5%, you could be down 6%, we especially notice this when trying to look at changes year over year.
With Amplitude, our data is always 0.5% of where we expect to be all the time, and that’s not something I could say of Google Analytics. It’s great to be free, but sometimes you get what you pay for.
Amplitude has been much more reliable. We always want to double-check our data. With revenue, for example, we have three ways to check: our database, our payment processor, and Amplitude. With Amplitude, our data is always 0.5% of where we expect to be all the time, and that’s not something I could say of Google Analytics. It’s great to be free, but sometimes you get what you pay for.
Our success is our customers’ success
Our business is about helping smaller companies make smarter decisions. Palo Alto Software is full of entrepreneurs running businesses on the side, which makes us sensitive to the needs of our customers. I’ve worked for several different companies, including those in the mobile and social gaming community. What I love about my current work is that my success means the success of others.
Small business owners support workers, families, and industries. If we can help them survive and thrive by making smarter business decisions, that is a powerful thing.

Shawn Hymer
Data and Strategy Analyst, Palo Alto Software
Shawn Hymer is a Data and Strategy Analyst at Palo Alto Software. He has 10+ years of experience analyzing data for social/mobile games and SaaS products and is passionate about tracking patterns and analyzing user behavior.
More from Shawn


