

_This article is an excerpt from the first volume of The Product Analytics Playbook: Mastering Retention. Retention is the one metric that matters for sustainable growth. The Playbook is a comprehensive guide to understanding user retention that provides a novel framework for analyzing retention at every stage of the user journey.
“Retain or die” is a commonly repeated mantra here at Amplitude and is gathering momentum throughout the tech industry as a whole. We’ve spent a lot of time talking about what retention is and why it’s important–but before diving into the various strategies and tactics that can improve the metric, we have to first take a step back and think of retention in the context of how users use your product. This comes in two parts.
- Understanding your critical event.
- Determining your product’s usage interval.
A few weeks ago, we talked about how understanding your product usage starts first with defining your app’s . Your critical event is the one meaningful action you want users to perform in order to be counted as truly “active” or “retained.” This could be submitting an order, sending a message, or starting a new game. The important thing is that this action is at the core of your app’s product experience; it differentiates users who just “show up” from those who actually derive value from your app. (Check out our post on for more details).
Just as important as defining your critical event is determining how often people do it. Today, we’ll be talking about your product’s usage interval, or how often you expect people to use your product, and why it matters for your retention metric.
Not all apps have daily usage
You can’t draw conclusions about your retention numbers without first having an understanding of your product’s usage interval. The product usage interval is the frequency (daily, weekly, monthly, etc.) with which you expect people to naturally use your product.
Some apps are built to be used daily—think social networking, media, casual gaming, or productivity apps. Other apps, like on-demand, e-commerce, and expense reporting apps, would be used much less frequently.
Why does product usage matter for retention?
Say you have an on-demand restaurant delivery app. Your product intuition tells you that most of your users place an order about once a week. If you look at the proportion of users who come back on a daily basis, you might see something like this:
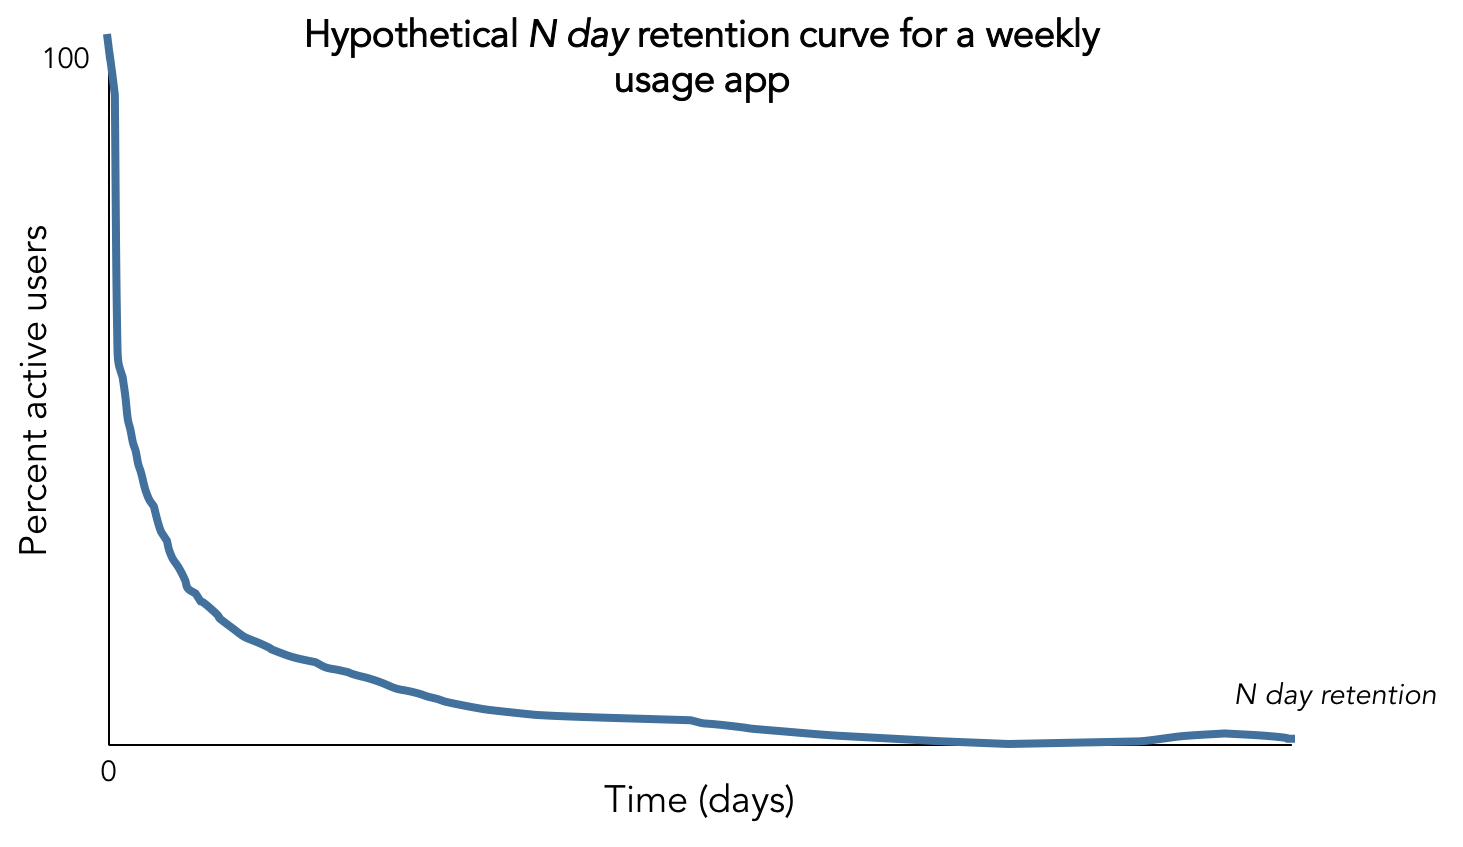
A massive drop-off after Day 0, and then a scarily low proportion of users coming back on any subsequent day. (For a refresher on N day retention, ).
But that retention curve isn’t a good indication of the health of your product; would only give you the proportion of users who are active on one arbitrary day. You would expect these numbers to be small, because most of your users don’t order on every single day.
Instead, you should be looking at your retention on a week by week basis. That is, the proportion of your users come back any time during Day1-7, Day 8-14, Day 15-21, etc. Your weekly retention curve might look something like this:
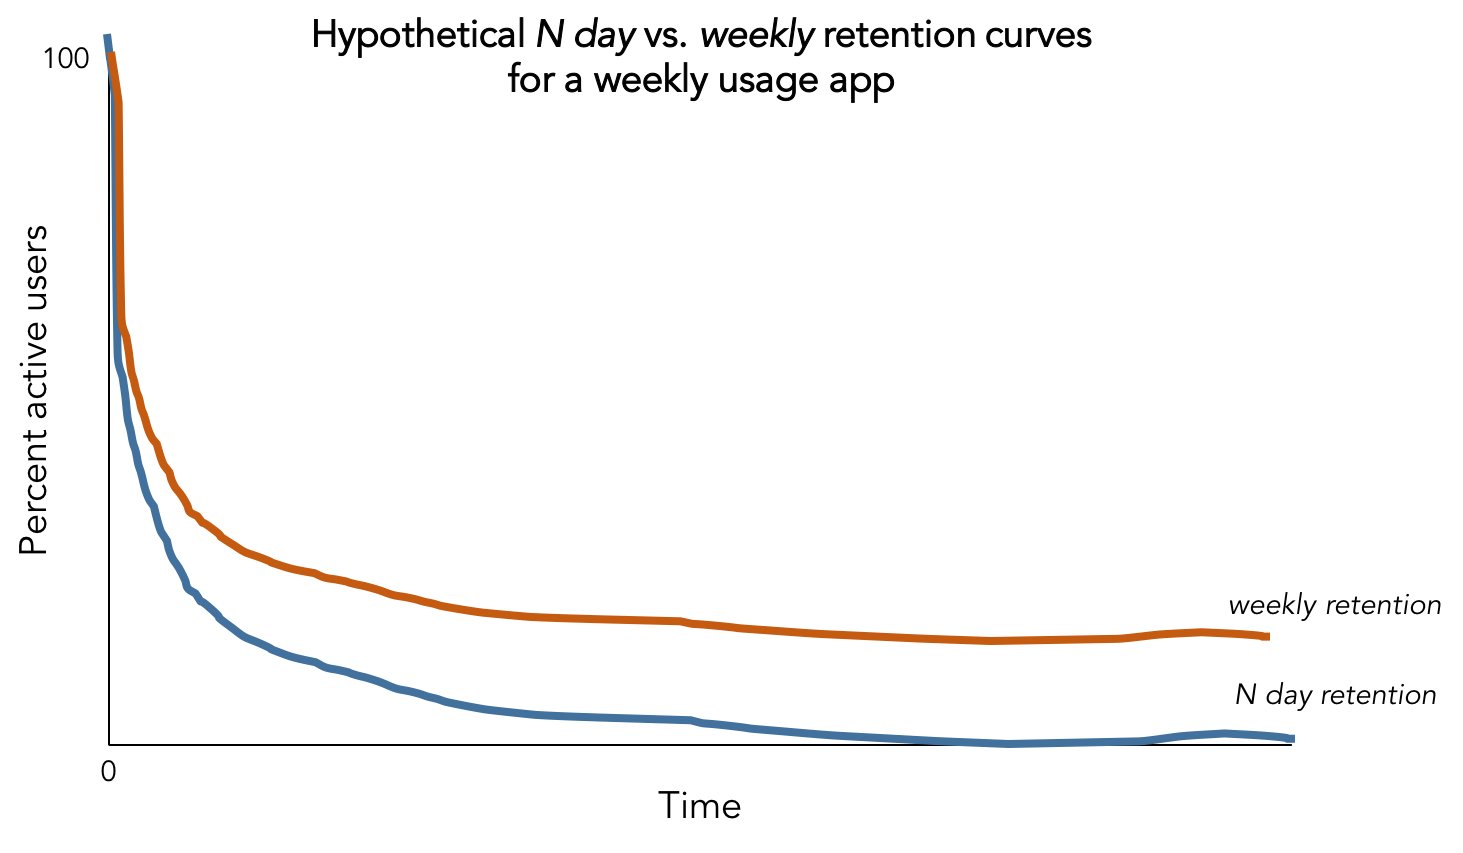
Compared to your daily retention numbers, weekly retention numbers gives you a much better indicator of your product’s health because it’s aligned closely with how frequently your users naturally come back to your product.
To be able to accurately calculate user retention across all stages of their product journey, you have to first determine how often you can expect them to come back to your app. Not doing so can cause you to misinterpret your retention metrics and misinform the strategies to improve them.
The Usage Interval Framework
So how do you figure out what your app’s usage interval is? You might already have some idea based off your own product intuition.
We’ve developed a quantitative framework that utilizes your existing user behavior data to determine your product’s usage interval more definitively:
- Identify all users who repeated the critical event at least twice within a certain time period. Note you’ll want to use a time period that is longer than your usage interval; for most apps 60-90 days is sufficient. Most products probably have, at maximum, a monthly usage interval–which means we expect users to repeat the critical event at least twice within 60 days).
- For those users, measure the length of time they took between completing the event the first and second time.
- Plot a cumulative distribution function – i.e., the percentage of users who performed the second event over different time intervals.
- Identify the time interval at which 80% of users have completed the second event—this is your product usage interval.
EXAMPLE: Determining your usage interval in Amplitude
Let’s look at an example of a hypothetical wellness app. Since this app’s core value is in guiding its users through mindfulness exercises and meditation, their critical event–the action they cared most that their users performed–was completing a meditation session.
Note: All graphs and data presented in this example are hypothetical.
Step 1: Identify current users who meditate at least twice in a 60 day period.
Since this wellness app wants to understand how often their current users return to meditate, they first needed to define a cohort of users who were:
- active during the 60 days under consideration
- not newly acquired in this time period.
Here’s what your cohort creation would look like in Amplitude:
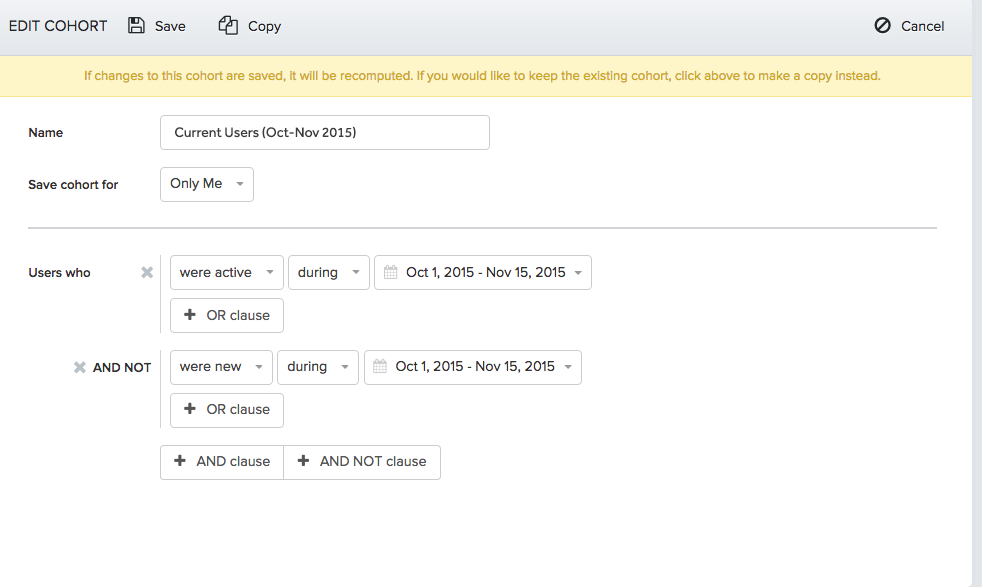
Now we have our cohort all users have been active in the past 60 days.
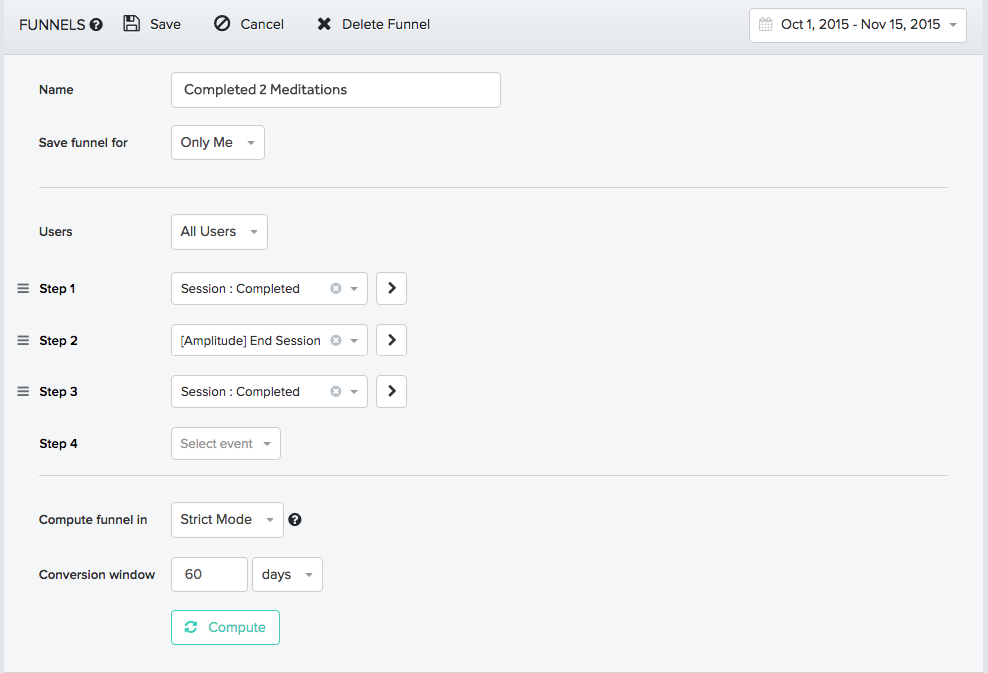
Next, we want to get to the cohort of current users who have meditated twice, in two separate sessions, within 60 days. We’ll need to use basic for this. The steps in this funnel are simple. We need users who have:
- Completed a meditation
- Exited the app [more on this]*
- Completed another meditation
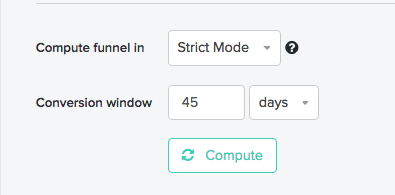
Set the conversion window to 60 days and you’re good to go. The conversion window indicates the amount of time a user has to complete the funnel, from the time they enter the funnel. In this case, as long as the user completes the funnel within 60 days of starting the first step, they will be counted as converted.
Here’s what the setup for that funnel would look like in Amplitude:
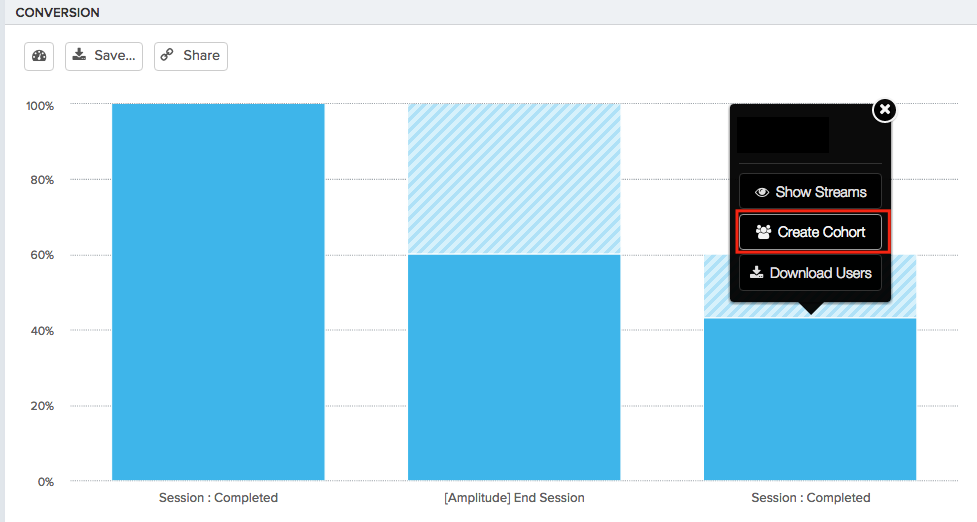
Now compute the funnel to get the percentage of users who have completed two meditation sessions in 60 days. This funnel analysis shows that just over 40% of current users completed at least 2 meditation sessions within a conversion window of 60 days. In Amplitude, you can create a cohort of these users in just two clicks. Just select the relevant part of the graph and click ‘create cohort.’
Step 2: Analyze when users come back for their second meditation session.
Now that we have the cohort of users who meditated at least twice in 60 days, we can move onto the next step—analyzing how long it took these users came back to complete the second meditation event. We we want to see whether a lot of users are coming back just a few days after the first event, or not until a few weeks have passed. In order to do this, we need to measure the proportion of users who performed the second meditation session at different time intervals.
We can do this by taking the same conversion funnel that we set up in Step 1 and applying it across the cohort of users who completed two meditations in 60 days, which we saved at the end of Step 1. The only difference is, this time we narrow down the conversion window for the cohort—we recommend starting from 60 days and narrowing the conversion window to 45 days, then 30, 15, 7, 2, down to 1 day.
Essentially what we’re doing is checking to see what percentage of this cohort converted within the specified window. In the funnel analysis below, we’re checking to see how many of the users who completed two meditation sessions within 60 days converted within 45 days.
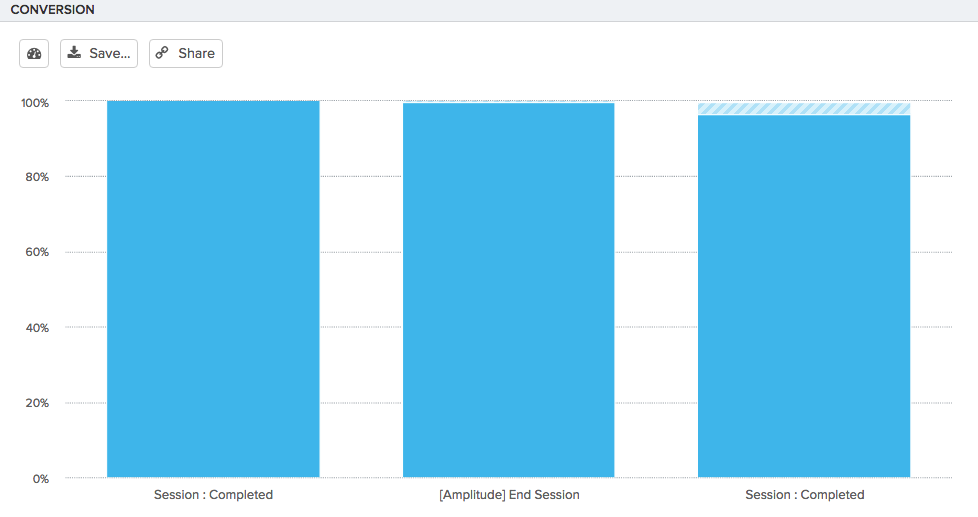
In Amplitude you can view the conversion rate for each step of your funnel.
As you run the analysis for the different conversion windows, keep track of the numbers in a table, because we’ll be plotting them in the next step.
Step 3: Plot the CDF
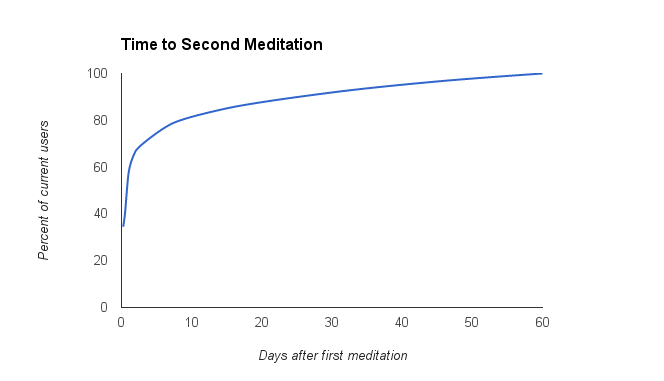
After running the funnel analysis in Step 2 over a series of conversion windows, plot your conversion window on the x-axis and your conversion rate on the y-axis; this will be simple if you kept track of your conversion rate over different conversion windows like we mentioned in Step 2.
This will give you a graph that shows you what percent of your active users completed the second meditation event at different time intervals.
Step 4: Determine usage interval
At Amplitude, we generally define usage interval based on when approximately 80% of users have completed the second critical event.
From the curve above, we can see that 80% of the app’s current users completed the second meditation in roughly 1 week. We can say that users of this app can be expected to come back at least once a week to meditate, or that this app is a weekly usage product.
One more thing…
As we said before, determining your product usage interval–how often your users are naturally inclined to use your product–should inform your retention analysis and your retention strategies.
This framework is great for determining your product usage in a methodical, quantitative way (which is how we like to do things at Amplitude!). But it’s also important to supplement this with your own product intuition, as well as with solid user research. Qualitative user feedback can be just as valuable as, if not more, than your quantitative findings.
*Note: You need the ‘exited app’ step to make sure you’re not counting users who completed two critical events within the same session. Make sure you have an event that logs the end of a user’s session in the app so you can make this distinction.
Additional information if you’re using Amplitude:, our SDKs no longer send ‘[Amplitude] Start Session’ and ‘[Amplitude] End Session’ by default. Instead, sessions are calculated as the period of time a user has the app running in the foreground. If you want to re-enable the default [Amplitude] session events, you can toggle it via the SDK. An alternative to this would be to instrument your own event that represents the end of a session. For example, some of our customers have ‘AppOpen’ and ‘AppClose’ events.