Release Notes: August 2020
Pipelines and Govern, downloadable CSV data and more. Check out our latest product updates.
New in Data Management
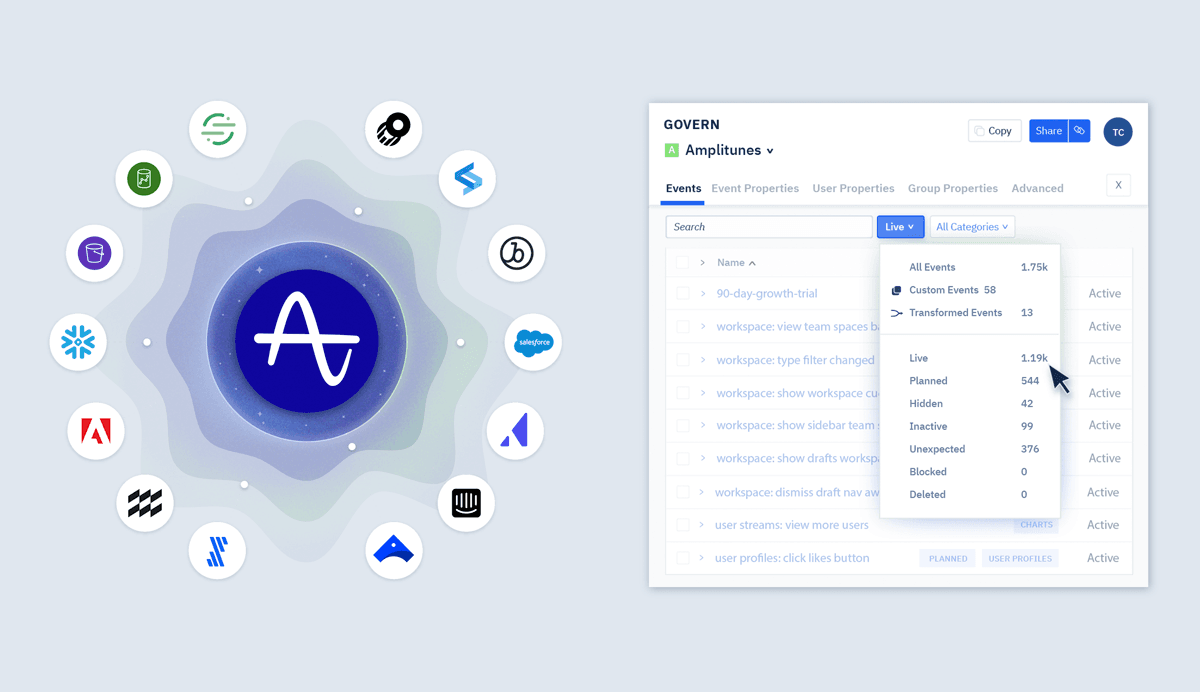
Comprehensive, accurate event data is integral to making data-driven decisions with Amplitude. That means it’s our responsibility to help data leaders provide the right data in the right places to the right people. Today we’re taking two big steps forward in this mission with the release of Pipelines and Govern.
Read the story behind Pipelines and Govern here, and see functional details below.

Pipelines
Available on the Scholarship, Growth, and Enterprise plans.
Pipelines makes connecting and creating data sources and destinations easier through improved workflows, and new import/export capabilities. Adding new data sources is quicker and easier thanks to a dedicated hub, and guided workflows. In addition, direct connections to Adobe Analytics, Amazon S3, Intercom, and upgraded server-side SDKs join our ever-growing collection of supported integrations.
On the destination side, Pipelines simplifies the process of adding behavioral cohort destinations for Amplitude Engage, by bringing them into one place. Pipelines can also guide you through our new export to S3 option, so you can sync events that are enriched in Amplitude back to your source of truth.
See our docs for full instructions to add Sources and Destinations to Amplitude.
Govern
Basic Govern capabilities available on Scholarship and Growth plans, with advanced features available as an add-on or with the Enterprise plan.
With Govern, we reimagined data management in Amplitude, and built a new central hub to make governance a seamless and enjoyable experience.
Govern streamlines existing workflows like event planning, validation, and transformation. It also includes new capabilities like bulk actions, query metrics for each event, and links to charts and dashboards where events are in use. Govern steps beyond filters and controls – it helps you understand whether events are providing insight to your team, or if they’re just creating noise.
See our docs for full instructions on Govern.
New in Analytics
Download CSV Data in Your Selected Chart Format
Available on all Amplitude plans.
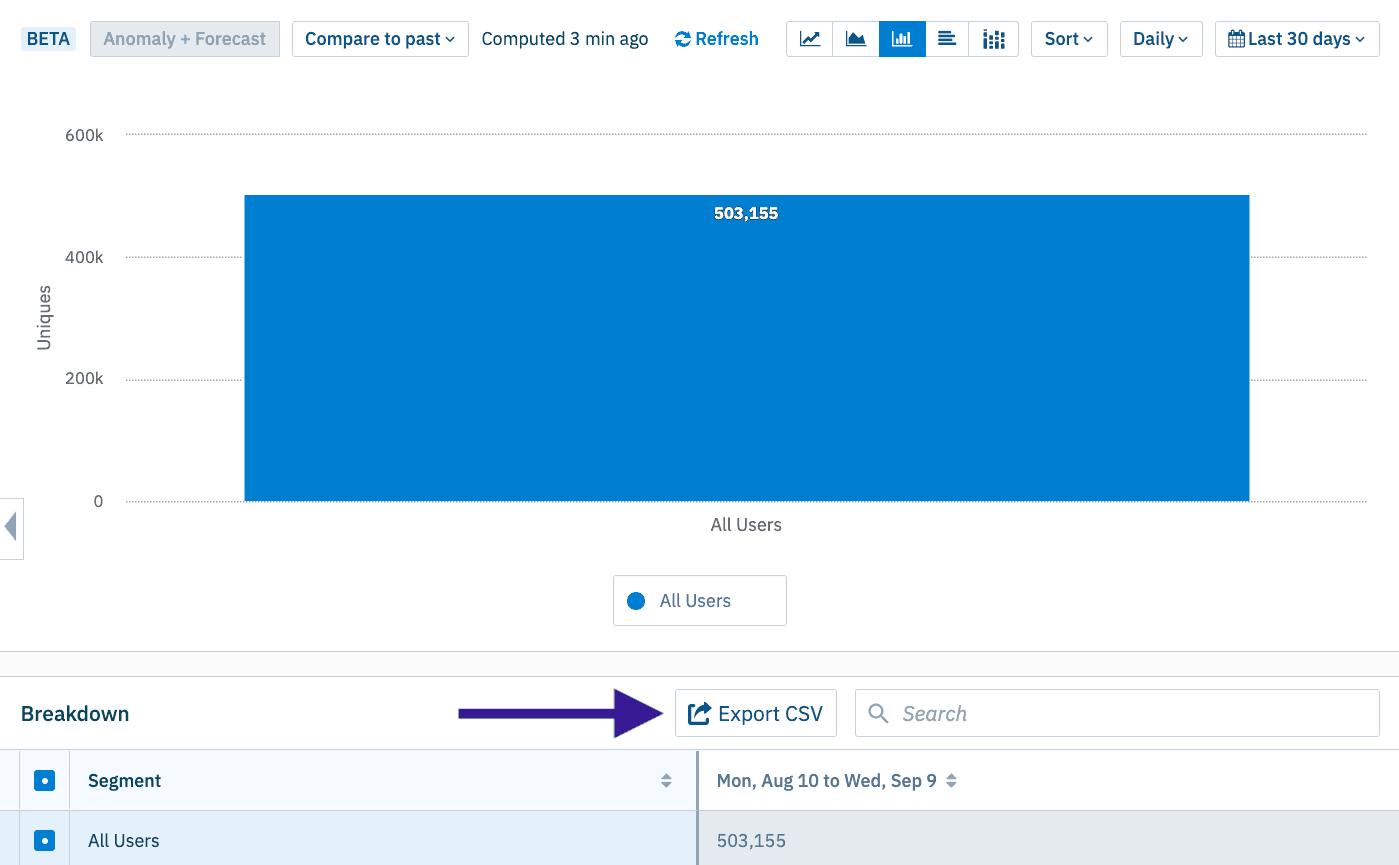
Below Amplitude charts you’ll find a table with all values shown on the chart. This table can be downloaded as a CSV for further analysis in excel, or for visualization in other tools.
To date, downloaded results were broken down by interval (day/week/month), regardless of the chart format. Now, CSV downloads adapt to the selected chart format. So if you’re looking at an aggregated bar chart, a downloaded CSV will include just one value.

New in Collaboration
New in Bulk Filters
Available on the Scholarship, Growth, and Enterprise Plans.
Bulk Filters allows you to temporarily or permanently update all charts in a dashboard with alternate date ranges, intervals, or user segments. Last month we shipped two updates to Bulk Filters to enable requested customer workflows.
First, you can save bulk filters to a dashboard permanently by clicking “Save Over Dashboard” as shown below. This allows you to make a permanent, one-time change to all charts in a dashboard, like at the conclusion of an A/B test.

In addition to the ability to save, Bulk Filters will now persist to charts temporarily when you click into a chart from the filtered dashboard. This saves time for customers trying to get a closer look at charts on filtered dashboards, who previously had to add filters to each individual chart even when launched from the filtered dashboard.

Grant Wensley
Former Technical Product Marketing Manager, Amplitude
Grant is a former technical product marketing manager, writing the “how we do it” section of Amplitude’s story.
More from Grant


