Release Notes: February 2019
February might've been a short month but we had a ton of things in the works, including exciting new functionalities for Notebooks, Google AMP support, and cohort syncing to Iterable.
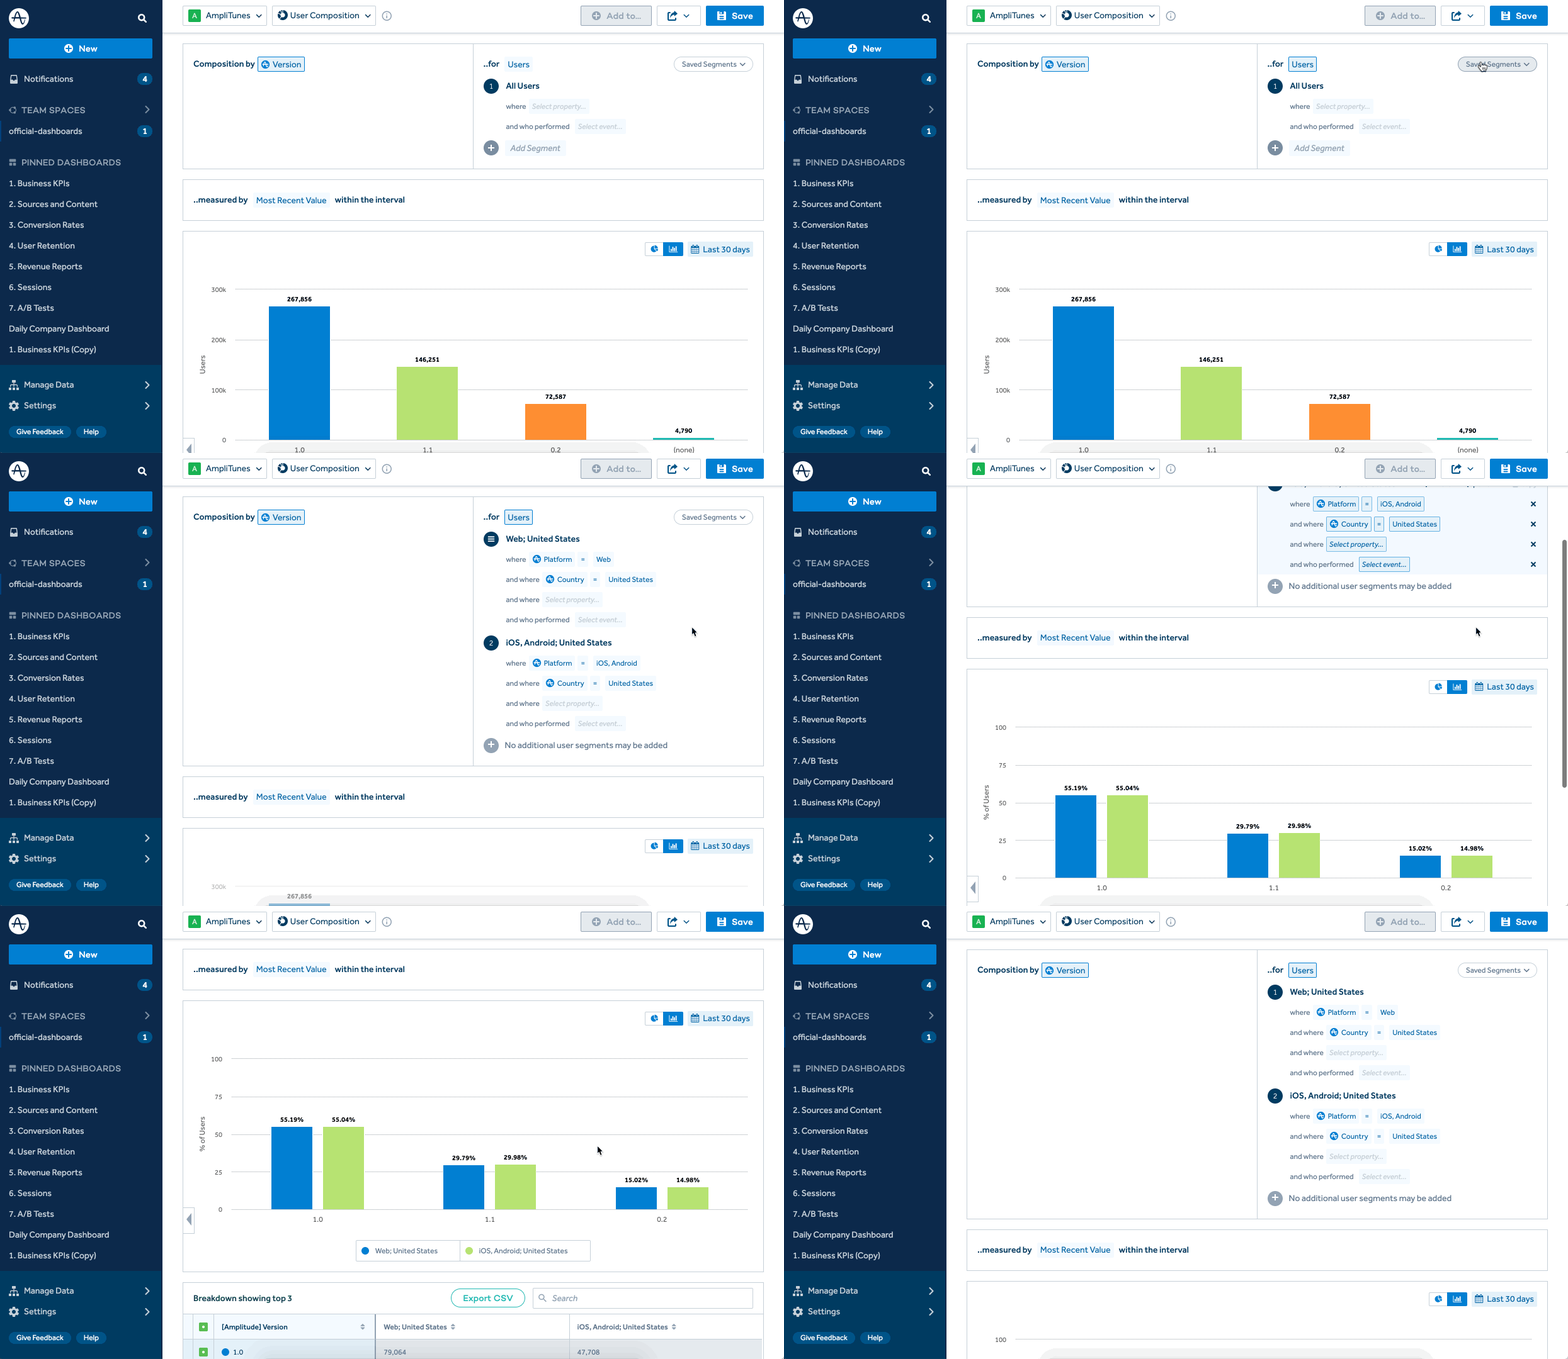
Build your queries efficiently by applying Saved Segments to all chart types
Available for all customers
Do you find yourself filtering to look at the same set of users over and over again when creating or editing charts? With Saved Segments, you can easily apply the sets of filters you use frequently, like device type, account plan, cohort, etc. to your analysis. Previously we had the ability to save filters as in our Event Segmentation chart; now you can now apply those Saved Segments to every applicable analysis type. Pro-tip: You can pin a Saved Segment to automatically apply those filters to every new chart you create. Visit our documentation to learn more.
Measure how your metrics vary over time with expanded period-over-period reporting
Available for all Scholarship, Growth, and Enterprise customers
Does seasonality affect your users’ engagement with your product? If so, you may find it useful to use time period comparisons to see the impact of your product changes. For example, you could see how your KPIs for this week compare to previous week or to the same week in the previous month. Now, you can also view how those KPIs compare to the same interval in the previous quarter and year.
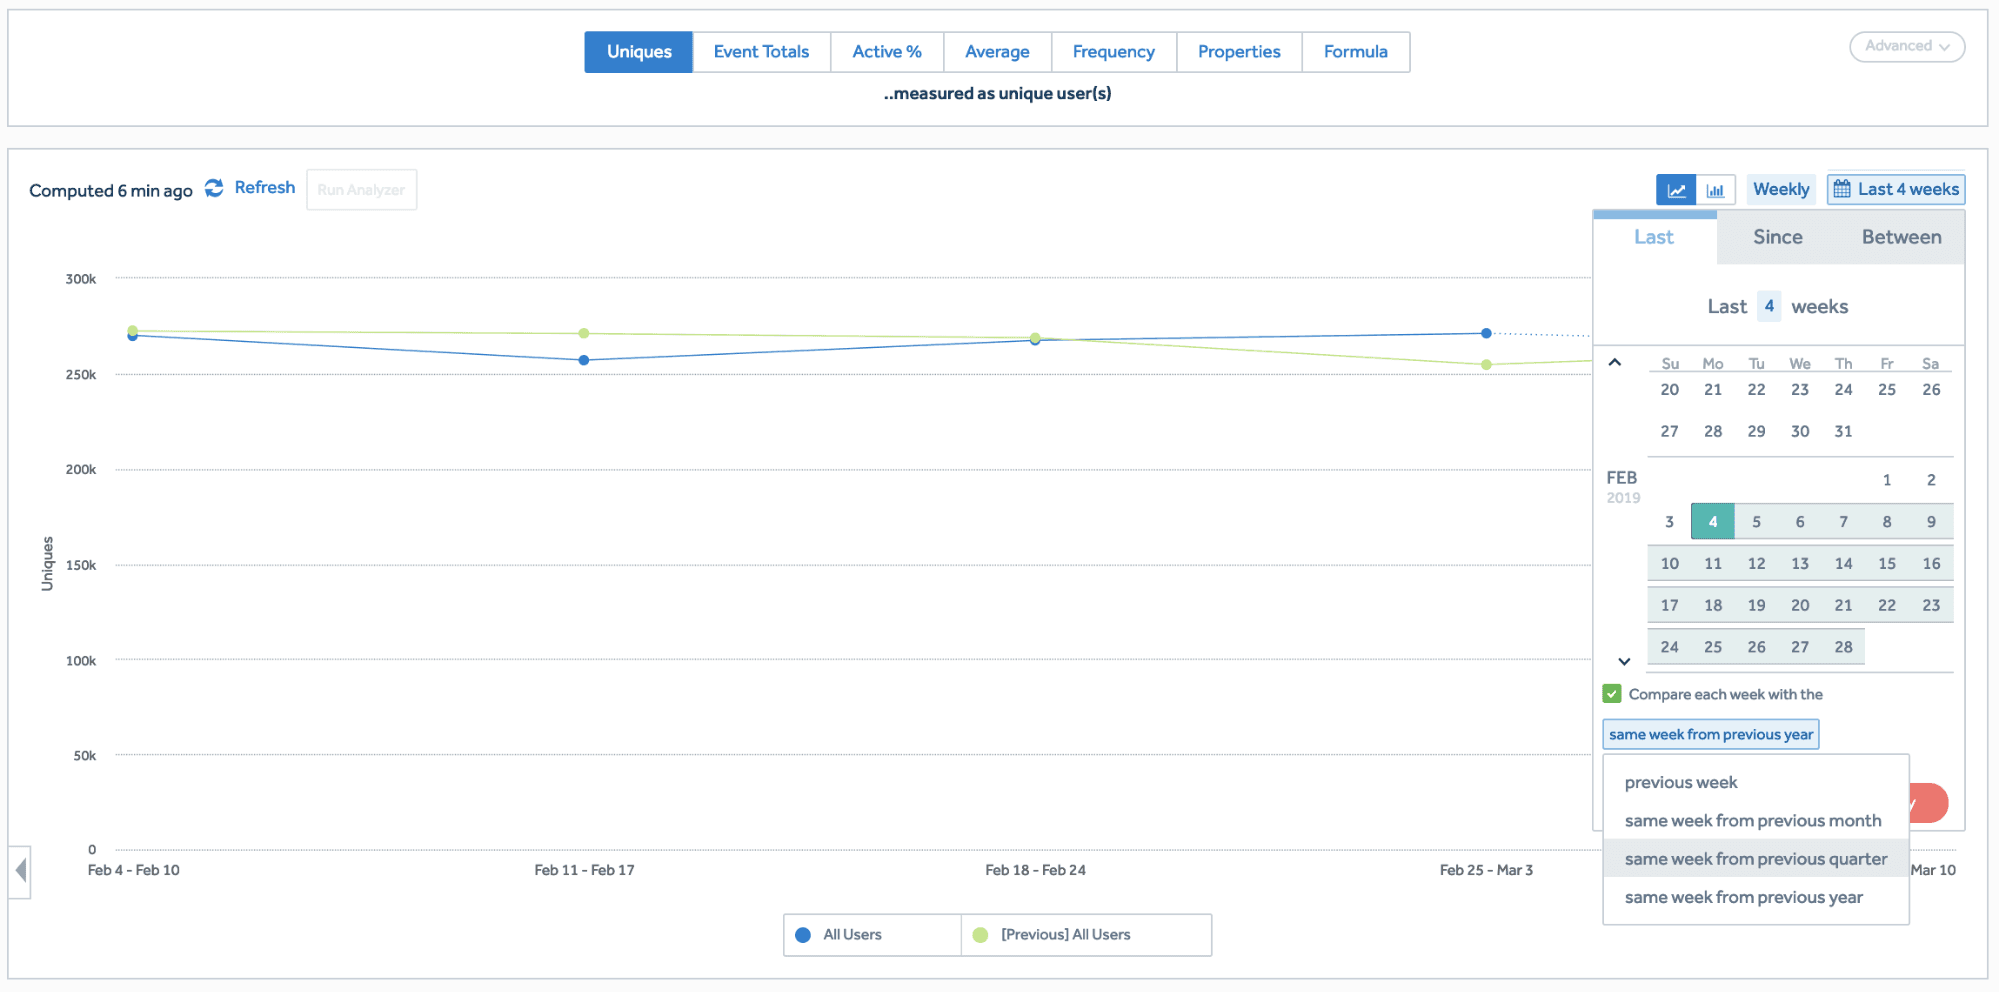
Previously, our customers could do period-over-period analyses in time series visualizations; now, you can also view these reports as bar charts. Visit our documentation to learn more.
Easily visualize quarterly OKRs
Available for all Scholarship, Growth, and Enterprise customers
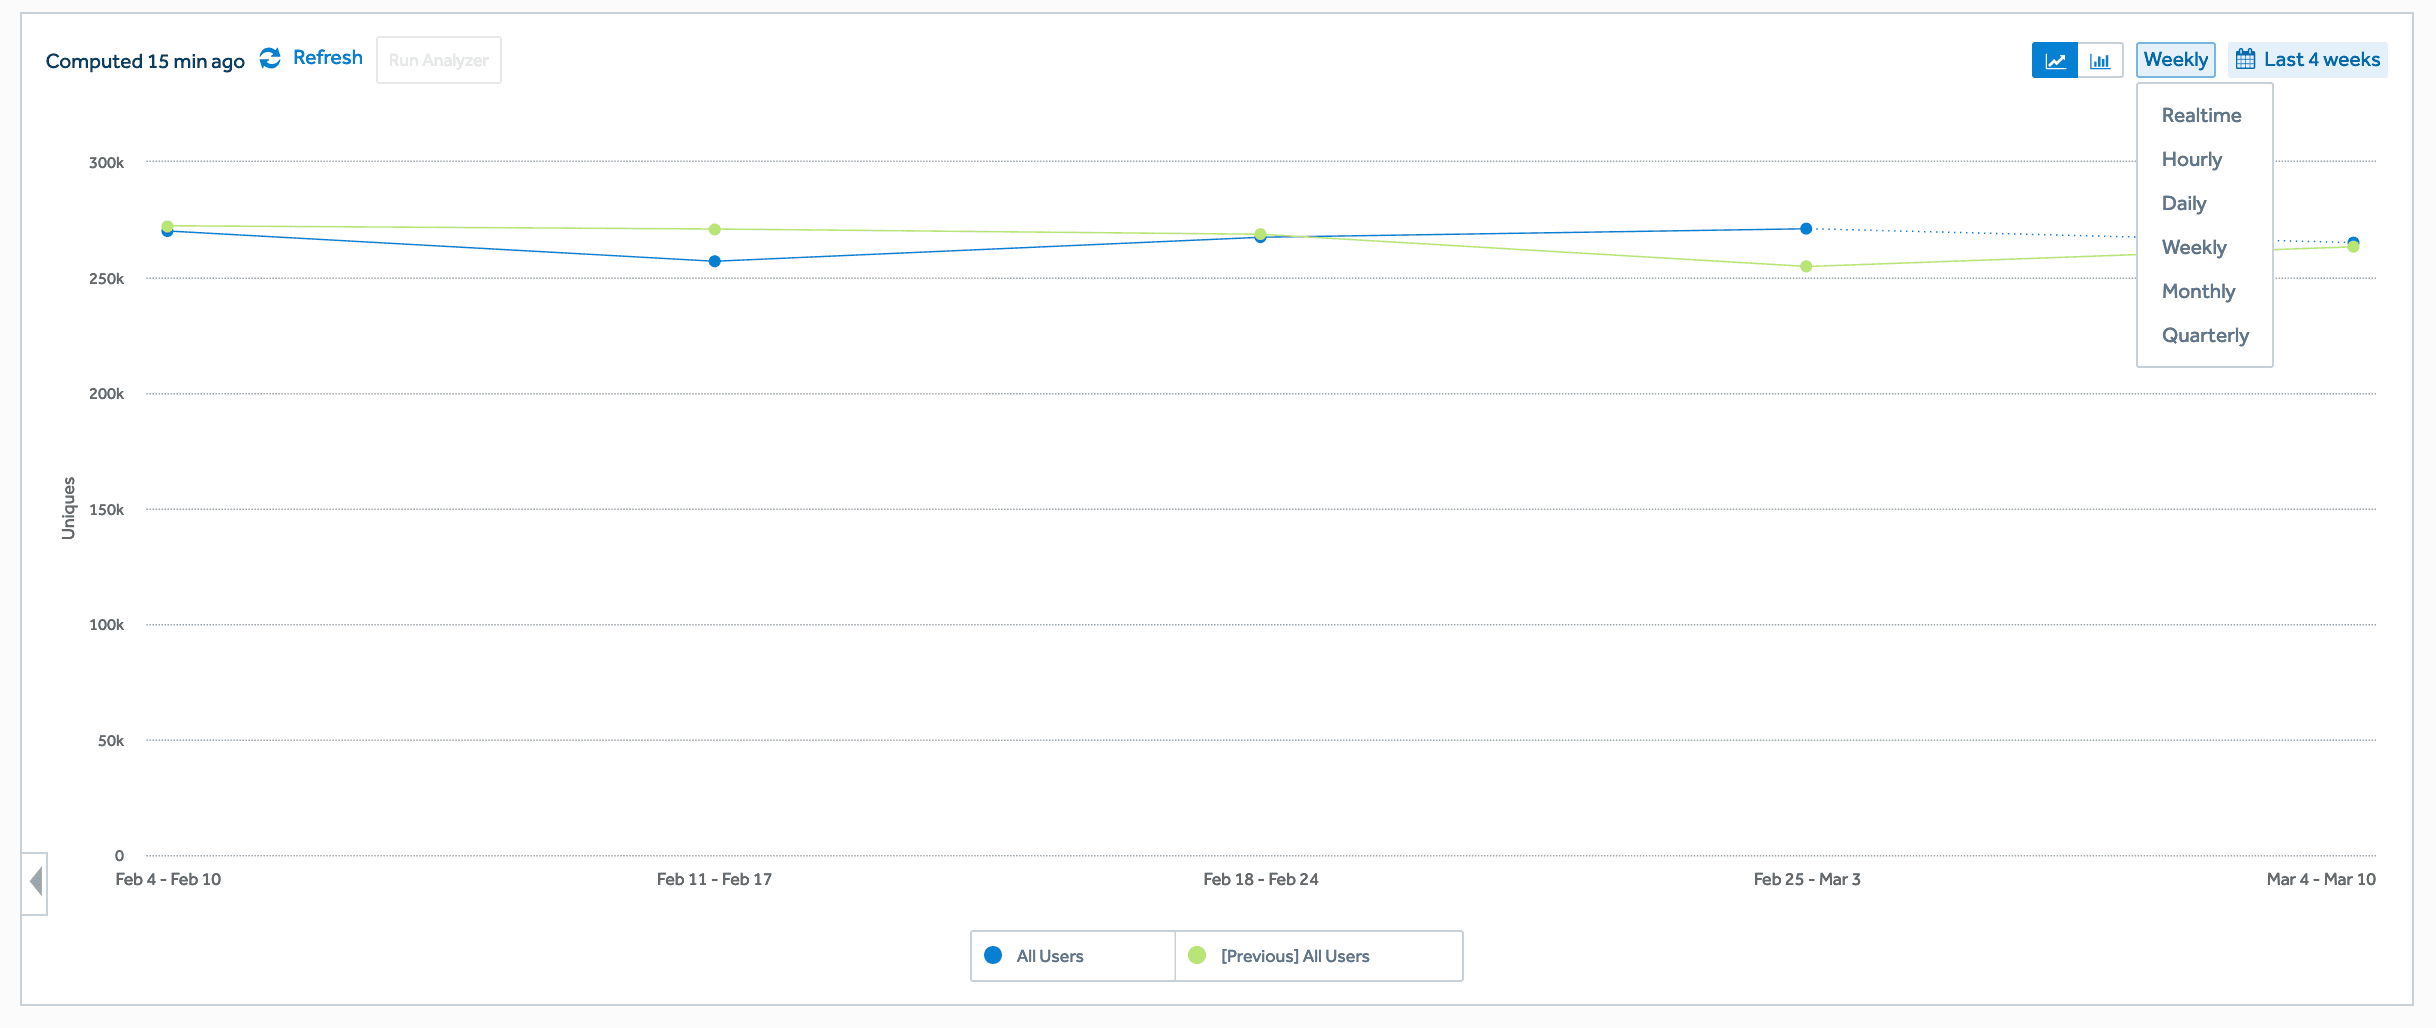
We know that visualizing product-related OKRs on a quarterly basis is important for many teams. Now you can see time series data on a quarterly basis in Amplitude and executives can easily follow the status of a team’s OKRs live on a dashboard.
Get your executives the information they need with monthly email reports
Available for all Scholarship, Growth, and Enterprise customers
Not everyone wants a weekly report, especially executives who care about high level OKRs. Customers can now configure email dashboard reports to be delivered on a monthly cadence.
Spruce up your Notebooks with easy-to-find Markdown shortcuts
Available for all Scholarship, Growth, and Enterprise customers
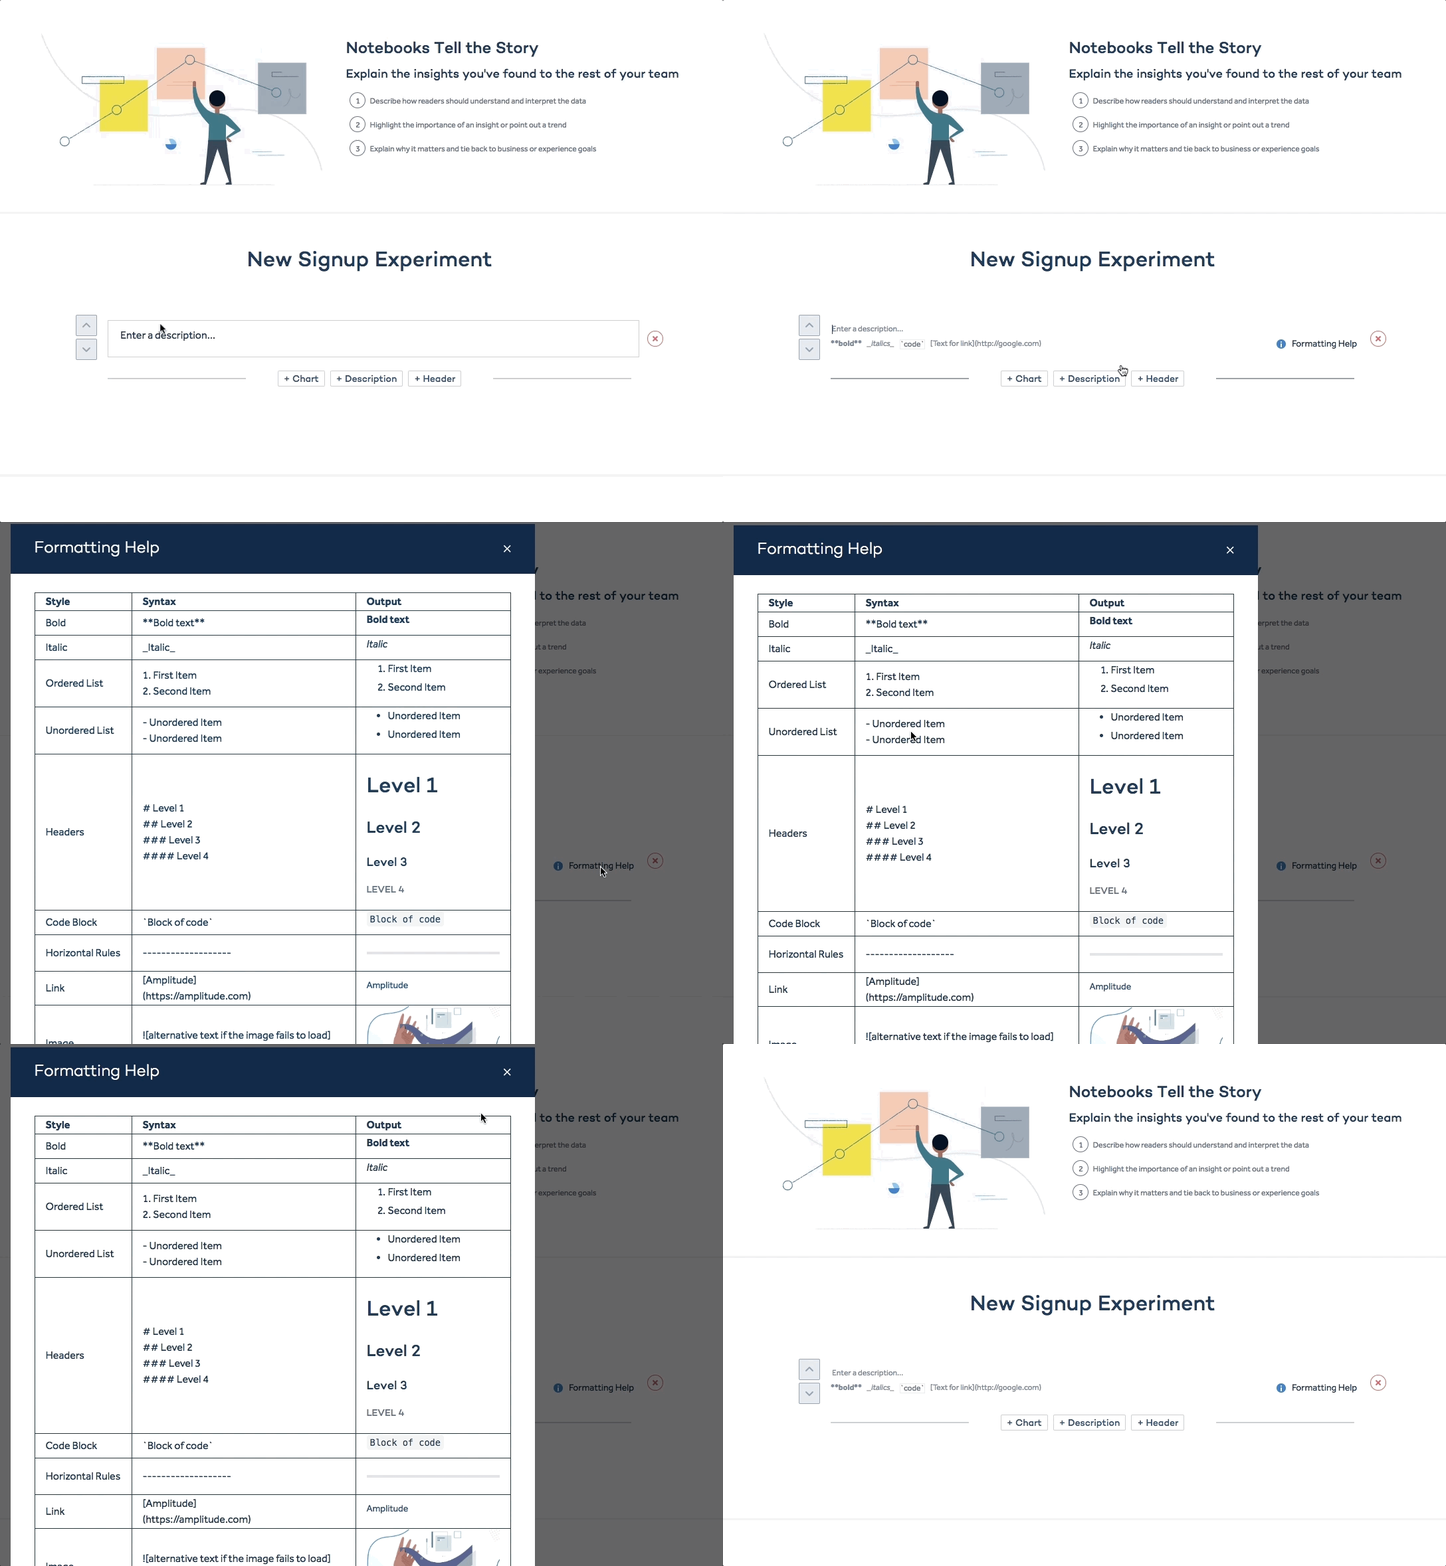
Notebooks lets you share the story around your latest experiment, design update, or product launch. Using Markdown, you can easily add rich-text formatting to add polish to your content. Not familiar with Markdown syntax? Customers can now open up a modal to see Markdown shortcuts, without leaving the Notebook they’re creating. You can find more documentation on Notebooks here.
Have better conversations around your data insights with these brand new Notebooks functionalities
Available for all Scholarship, Growth, and Enterprise customers
Speaking of sprucing up Notebooks, we’ve added several new funtionalities to make it easier to share, discuss, and collaborate around a data story right within Amplitude.
Copy & Delete Notebooks
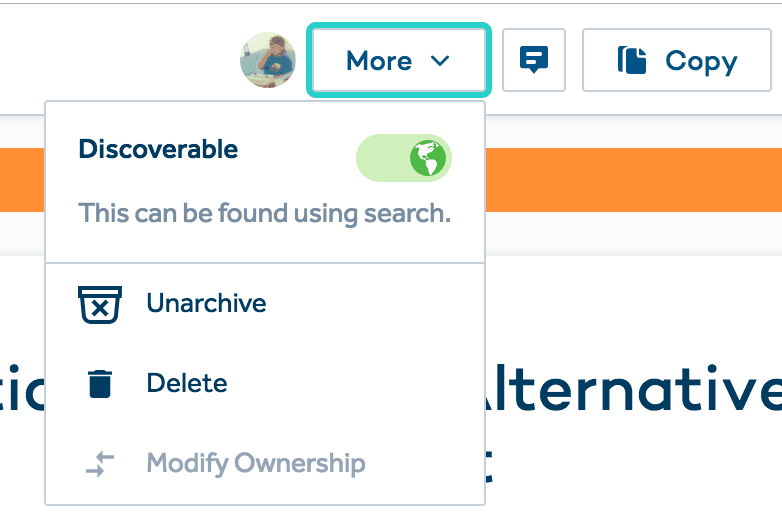
Pivot off of existing Notebooks to begin telling your own stories. Customers can now duplicate Notebooks that they own or are owned by other users and easily copy things like rich text formatting and images so they don’t have to re-write content.
Comment on Notebooks
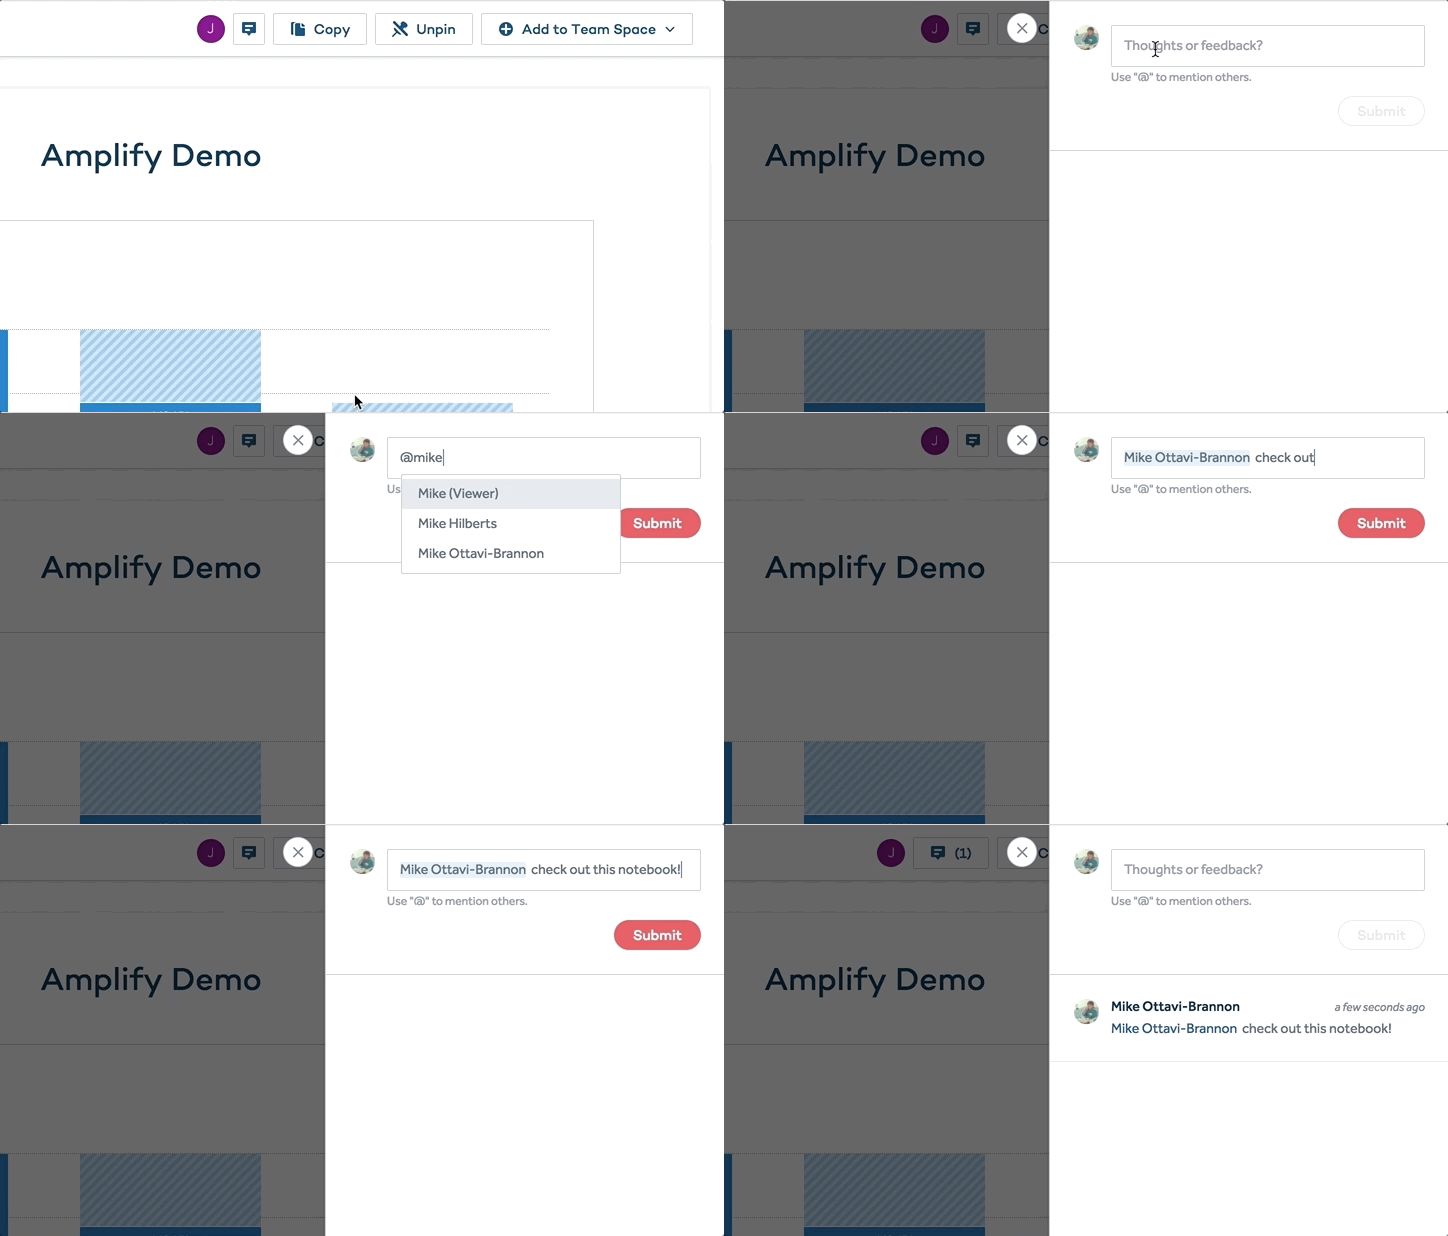
Customers have always been able to comment on charts and dashboards and now they can comment on Notebooks took. Use the new commenting capabilities to ask questions, make recommendations, and provide feedback on a Notebook you’re viewing. Bring the conversation you want to have about the data right into Amplitude.
Co-author Notebooks
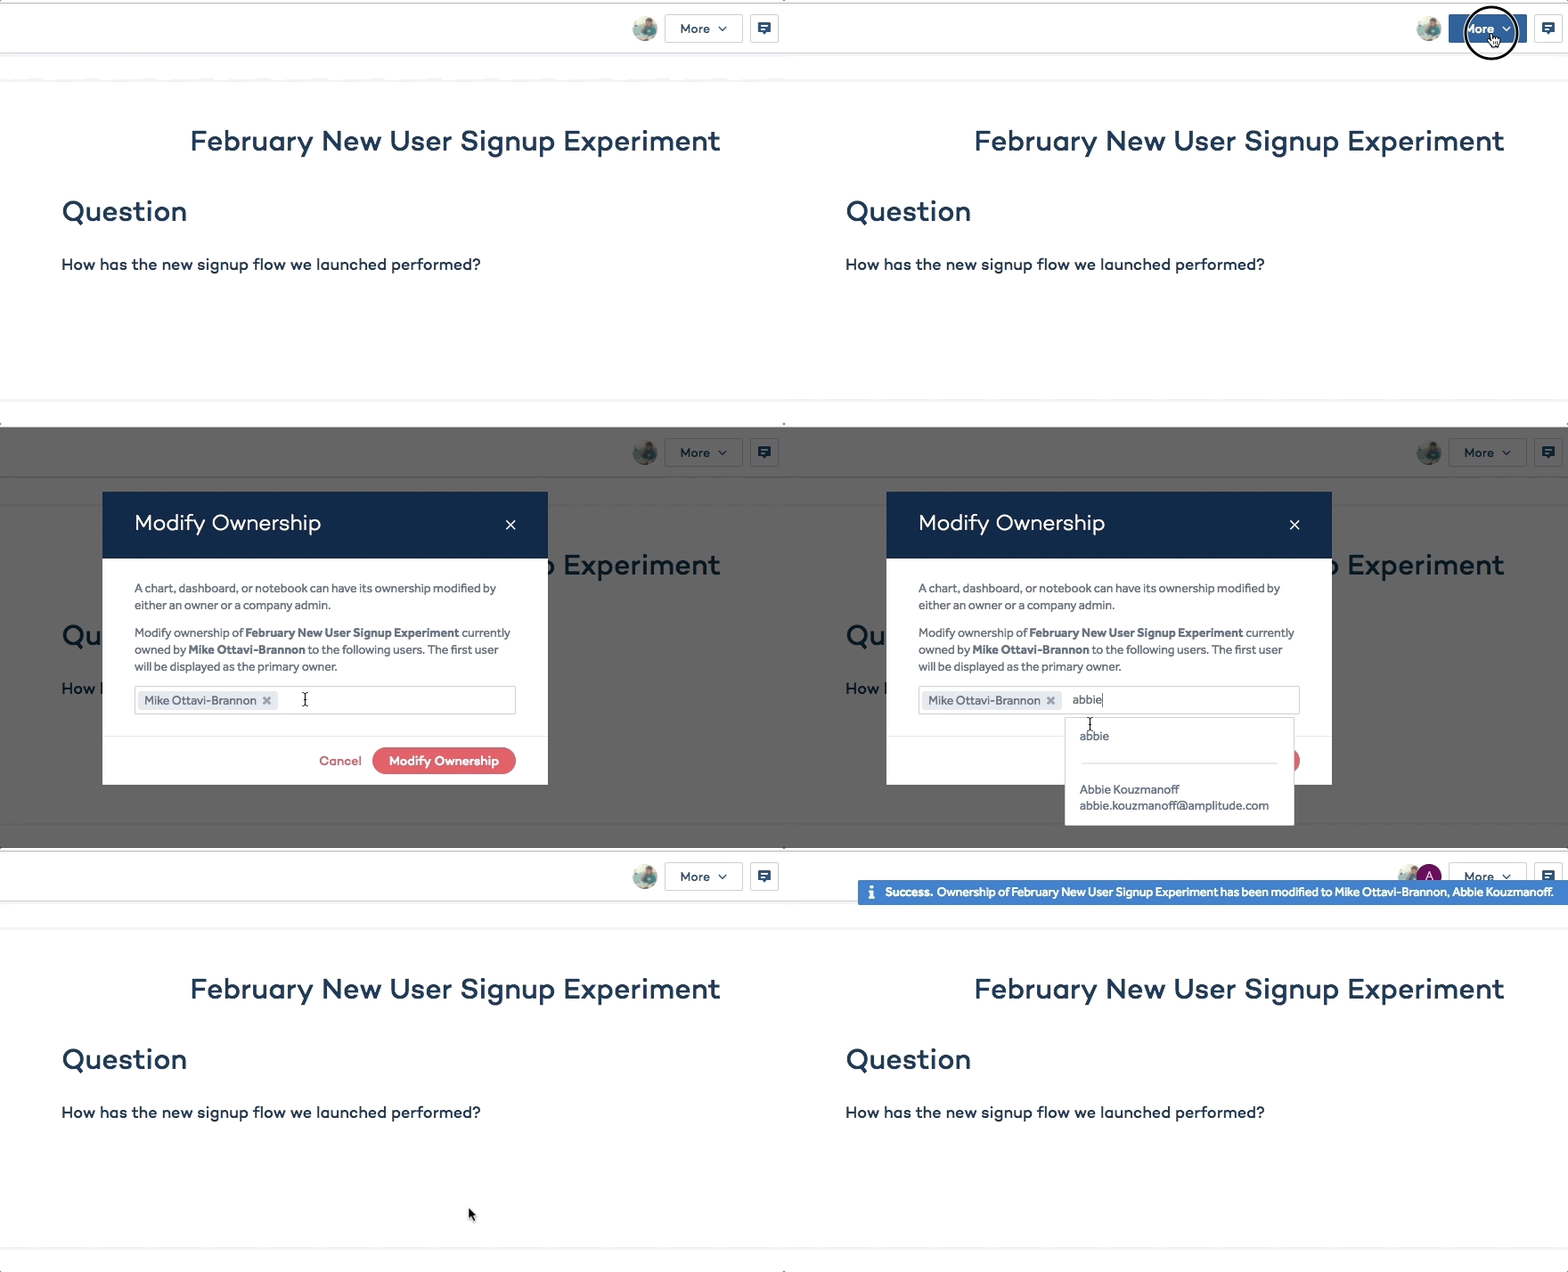
Collaborate with your team to create a great Notebook with co-authoring capabilities. Notebooks can now have multiple owners, allowing more than one user to make edits and share with colleagues.
Interested in learning more about how to use Notebooks? Check out our feature spotlight post here!
Better target your engagement campaigns with simple cohort syncing to Iterable
Available for Growth and Enterprise customers
If you’re using Iterable for email and push campaigns, you can now use behavioral data in Amplitude to target your campaigns to specific cohorts without the need for any data pipelining. Keep those cohorts up to date with daily and hourly syncing. Visit our documentation to learn more.
Amplitude launches AMP Support!
Available for all customers
Amplitude recently launched support for logging events from AMP Pages. AMP (or Accelerated Mobile Pages) is an open source initiative started by Google that allows web pages to load faster for mobile users. Now you can track user actions on these pages and link them to interactions on your web apps. Find our AMP documentation here.
Instrument your React Native apps with our new SDK
In beta for all customers
Due to popular demand, we are rolling out a first-party React Native SDK written in pure JavaScript. No longer will you need to write nasty bridge code to log to the iOS and Android SDKs. Just log events and $profit.
*Header photo by Amanda Jones *

Archana Madhavan
Senior Learning Experience Designer, Amplitude
Archana is a Senior Learning Experience Designer on the Customer Education team at Amplitude. She develops educational content and courses to help Amplitude users better analyze their customer data to build better products.
More from Archana


