Release Notes: February 2020
Here's what was new in Amplitude through February 2020: an inbound data integration with Intercom, a revamped My Workspace, co-ownership of cohorts, and more.
Inbound data integration with Intercom
Available for Scholarship, Growth, and Enterprise customers who are also Intercom customers
Amplitude now supports ingesting event data from Intercom using webhooks. We previously supported sending Amplitude cohorts to Intercom; now, you can stream your Intercom campaign data into Amplitude and leverage behavioral analytics to dig into the success of your campaign.
With this bi-directional integration, you can use Amplitude and Intercom to optimize campaign performance and assess impact on in-product engagement, conversion, and retention. To learn more about how our bi-directional integration with Intercom works, check out our documentation.
Find your recently viewed content in My Workspace
Available for all customers
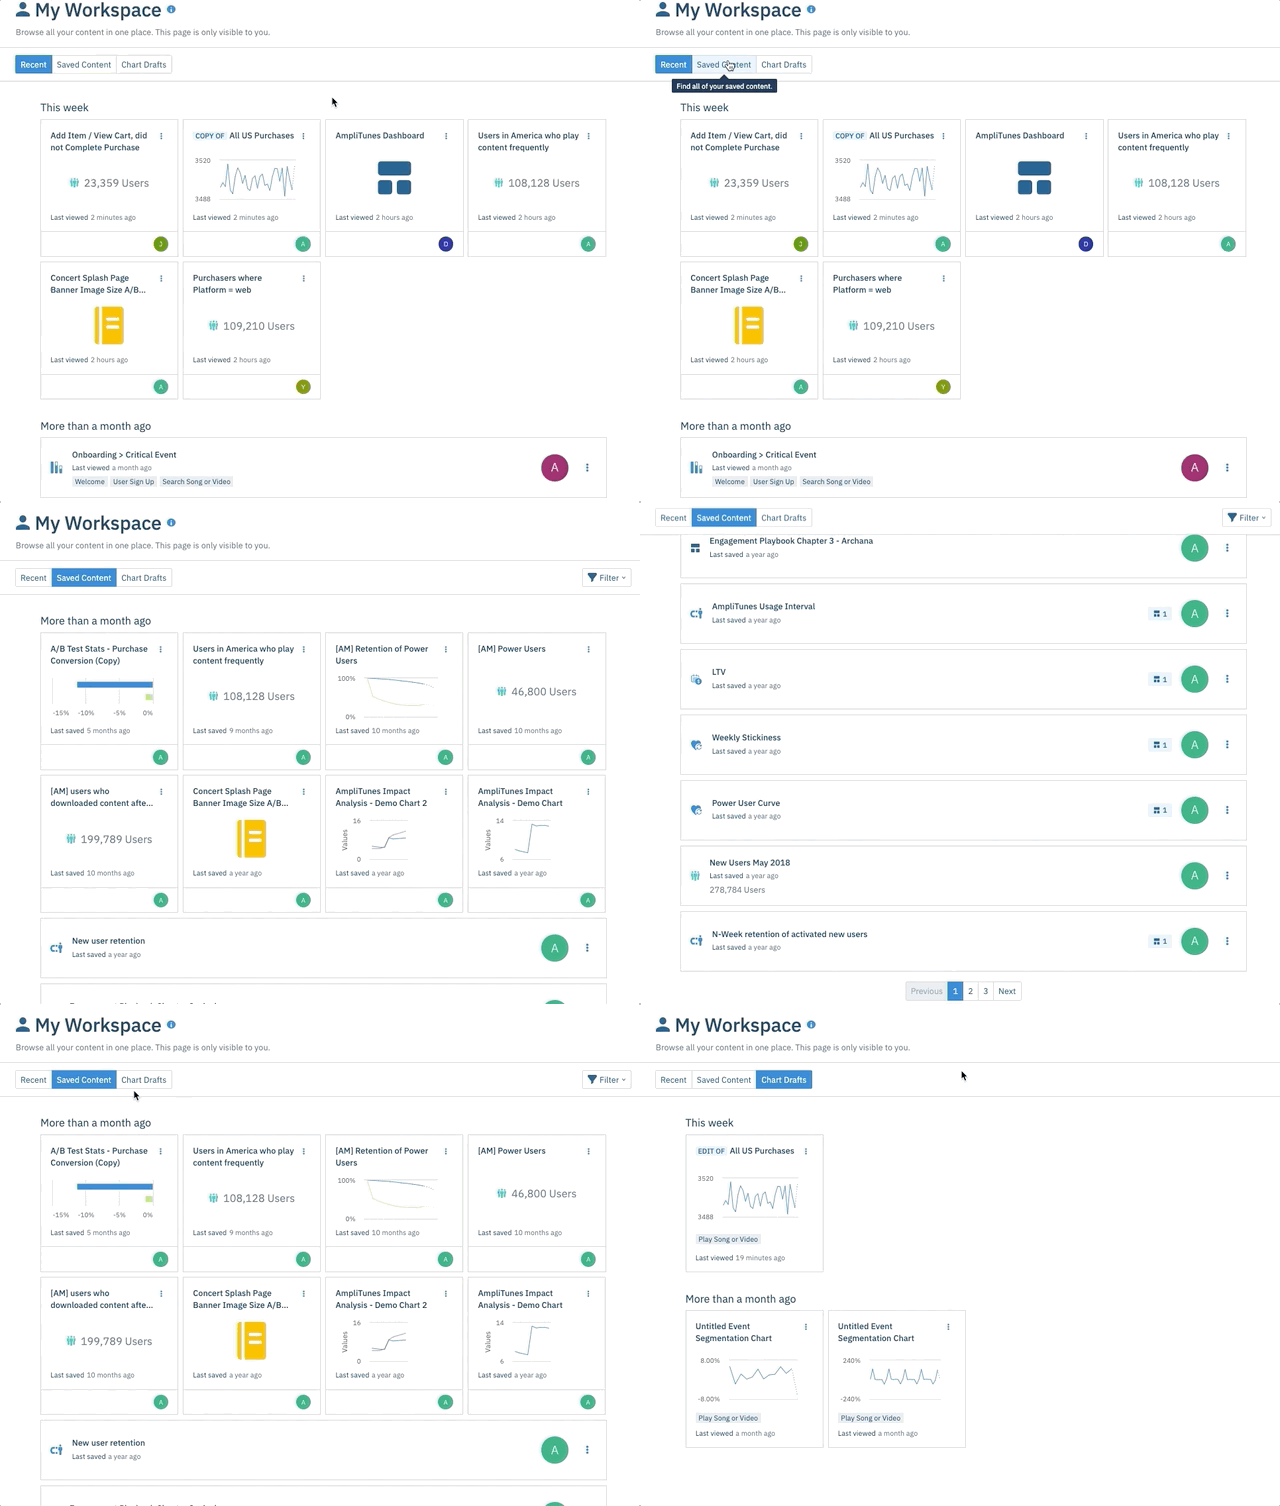
We’ve revamped My Workspace to help you find the content that’s relevant to you so you can quickly jump back to your analyses.
- Recent: In the Recent tab, you’ll now find your recently edited and recently viewed content, including content you don’t own. This will help you navigate to the content that’s most helpful and actionable to you faster than ever.
- Saved Content: The Saved Content tab is now sorted by the time of your last save.
- Chart Drafts: This tab now includes untitled drafts of your content.
An example of the three tabs in My Workspace

Co-ownership of cohorts
Available for all Scholarship, Growth, and Enterprise customers
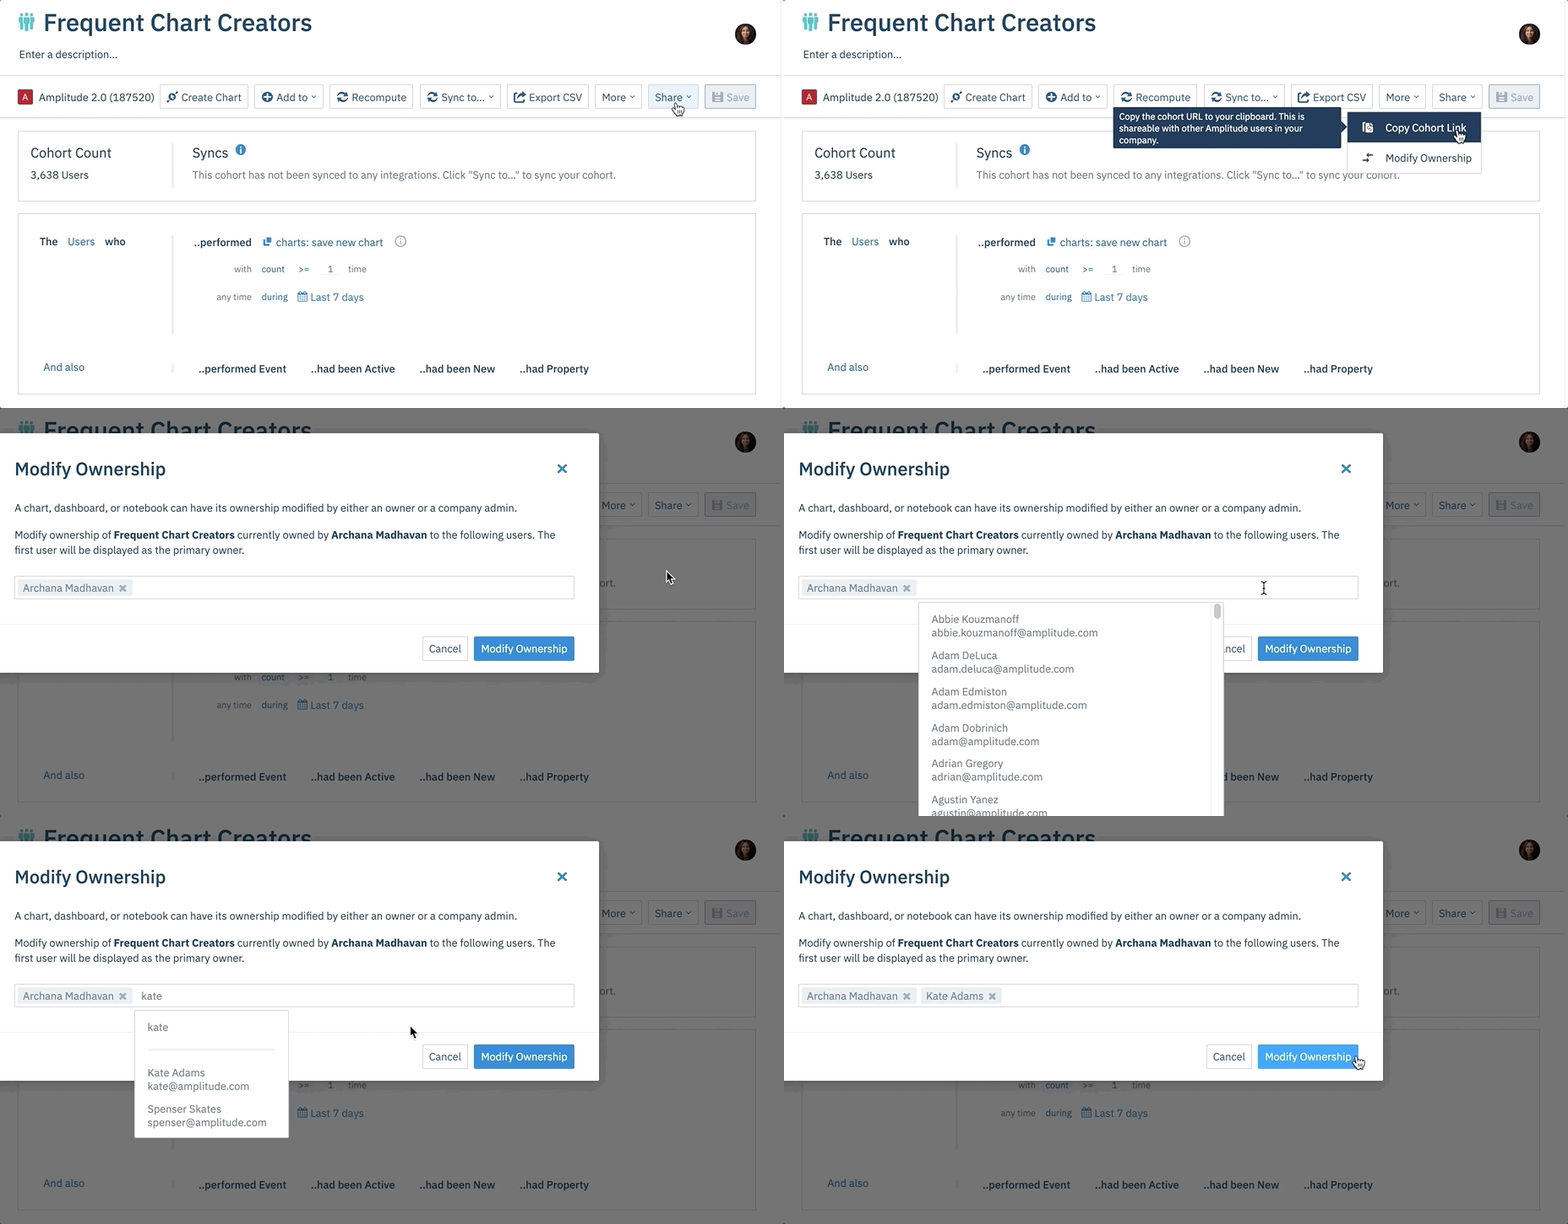
Amplitude cohorts can now be co-owned by multiple users. Admins and managers can also transfer ownership or add additional owners to a cohort. This is particularly useful if your team is using Amplitude Engage, so multiple people can manage on-demand or scheduled cohort syncs.
An example of adding an additional owner to a cohort.

Easily share findings from Conversion Drivers
Available for all Scholarship, Growth, and Enterprise customers
Found something interesting with Conversion Drivers? Now you can easily share your analysis by copying and pasting a unique URL that takes people straight to your findings. Just click the ‘Share’ button.
An example of copying the URL for the Conversion Drivers page

Calculate median property value with a simple click
Available for all customers
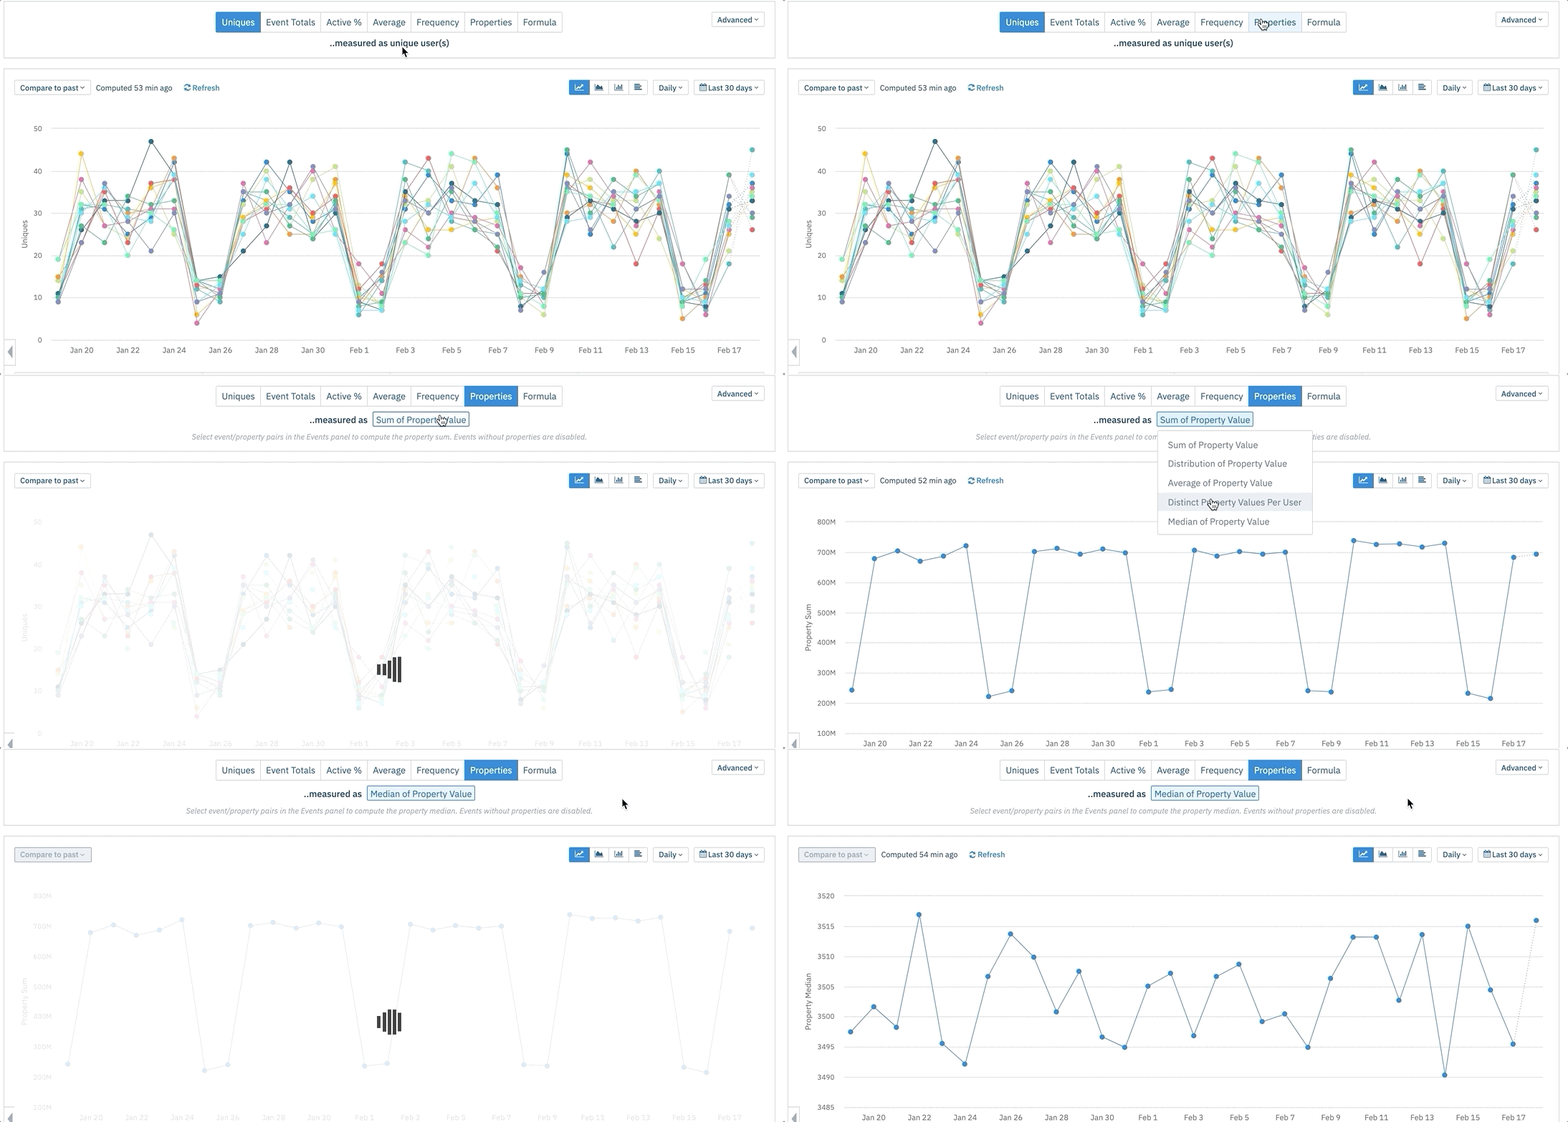
You can now easily capture the median of a property value. Previously, this analysis had to be done with our PERCENTILE formula; now you can do this by simply clicking on the dropdown option in the Metrics Module.
An example of calculating median property value. This example looks at the median length of songs played by users over the past 30 days.

Collapse categories in the events module
Available for all customers
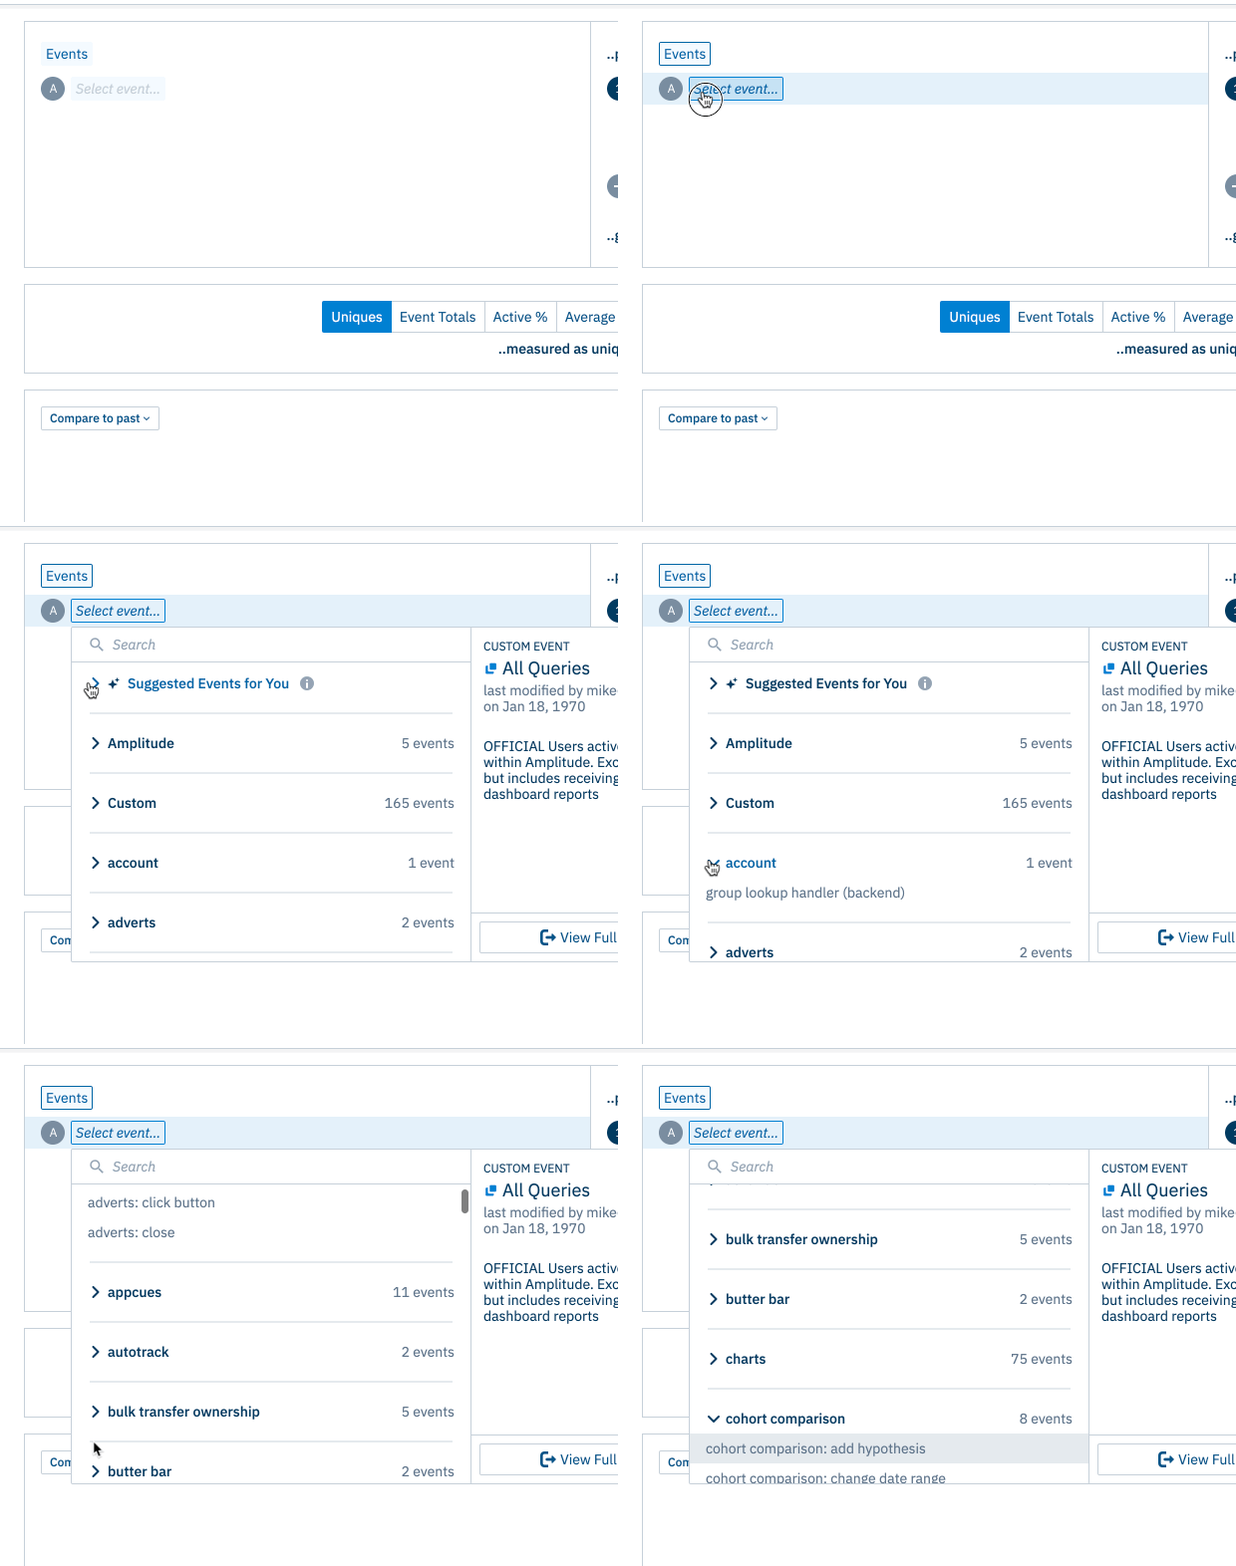
Not every event or event category may be relevant to the type of analysis you frequently do. To make it easier for you to see and select the events you care about, you can now collapse categories in the events dropdown menu of the Events Module. This includes the ability to collapse the Suggested Events section if you don’t find it useful. The categories you do or do not collapse will be remembered for you the next time you create a chart.
An example of collapsing event categories in the Events Module


Archana Madhavan
Senior Learning Experience Designer, Amplitude
Archana is a Senior Learning Experience Designer on the Customer Education team at Amplitude. She develops educational content and courses to help Amplitude users better analyze their customer data to build better products.
More from Archana


