Release Notes: July 2020
We launched new features and updates in July! Check out what's new.
New in Collaboration
Templates
Available on the Scholarship, Growth, and Enterprise plans.
Through working with our customers we’ve learned that great product teams each have common Amplitude workflows, regardless of their industry or company size. Additionally, many of these analyses are repeatable, except for small chart adjustments for the latest experiment, feature release, or campaign. Today we are thrilled to announce the release of Templates, a workflow tool to leverage your existing Amplitude dashboards to empower new teammates, and apply previous work to new product initiatives.
Templates analyzes the chart filters on an existing dashboard, allows you to edit those filters in one centralized view, and saves the updated charts as a new dashboard. For example, you could set up an A/B testing template with core metrics, and simply change the experiment name filter to apply this to new experiments.
This saves time for experienced Amplitude users who want to repurpose previous charts, and for admins looking to share Amplitude best practices at scale. Check out the video below for example use cases, and see our documentation here for detailed instructions.
New Improvements to Public Links
Available on the Scholarship, Growth, and Enterprise plans.
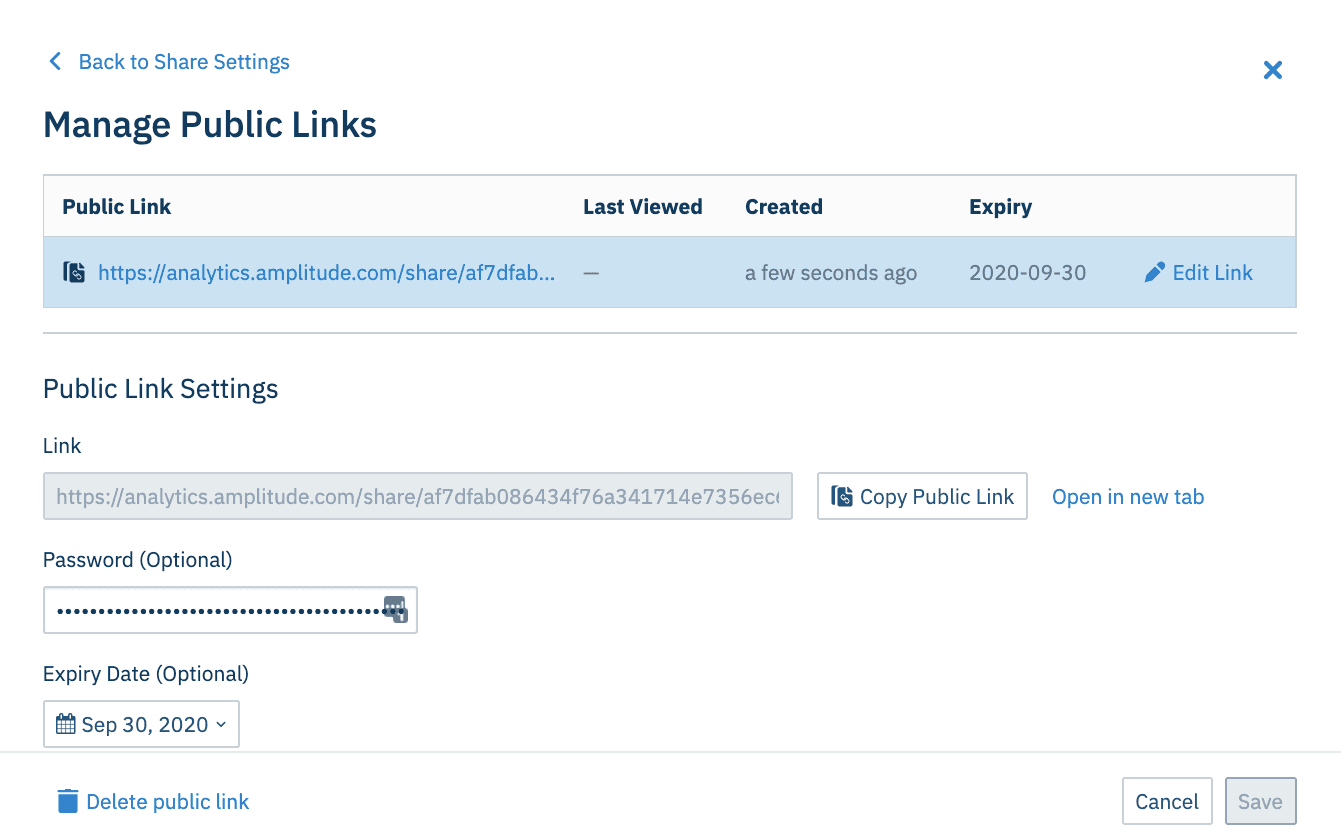
Public links allow you to share charts and dashboards without granting the viewer full access to your Amplitude org. Enterprise customers now have the option to set org wide security settings for their public links, including required/optional passwords, and maximum expiry days (how many days until links expire). With these improvements you can share Amplitude analysis outside your org with greater confidence that the data will remain private.
Additional improvements available to all paying customers include TV mode compatibility for public dashboards, the ability to request org access from public content, a streamlined content sharing UI, and the consolidation of public link and dashboards subscription management within Settings. See here for more on Public Links.

New in Analytics
Anomaly + Forecast
Currently in Beta. Available on the Scholarship, Growth, and Enterprise plans.
Product metrics fluctuate on a daily basis, and it’s hard to know whether changes accurately reflect your customer experiences, or if they’re driven by outliers. Anomaly + Forecast are new features in Amplitude to combat this problem, so you can monitor growth with clarity, and set more-informed goals for your product.
Anomaly Detection helps you uncover statistically significant changes on any time series chart with just one click, so you can understand the significance of changes as you discover them. Anomaly Detection comes with three mode settings: Agile, which is optimized for quick analysis on recent data; Robust, which analyzes a longer historical interval to account for seasonality; and Custom, which lets you designate a confidence interval and analysis period.
Forecast analyzes your historical data, and visualizes your expected future metrics so you can estimate trends, and use them to inform your goals. Check out the quick demo below, and see here for full instructions on the feature.
We are currently rolling this out to our paying customers in phases. If you are interested in turning on this feature, please contact your Customer Success Manager.
Conversion Drivers: Expand by Event/User Properties
Available on the Scholarship, Growth, and Enterprise plans.
Conversion Drivers surfaces which events correlate to conversion or drop off in Amplitude funnels. This signals which experiences are driving positive outcomes and growth, and which parts of your product are causing friction or drop off in key processes. Now, you can expand conversion drivers by user and event properties.
This improvement answers important contextual questions about the signals you find. For example, which campaign channels correlate with greater signups? Or, which offers lead to more purchases? Additionally, content-focused customers like NBC or Peloton can now use conversion drivers to understand which shows or workouts lead users to their target outcomes.
See the demo below, or documentation here for full details.
Hourly Intervals for Conversion Over Time View in Funnels
Available on all Amplitude plans.
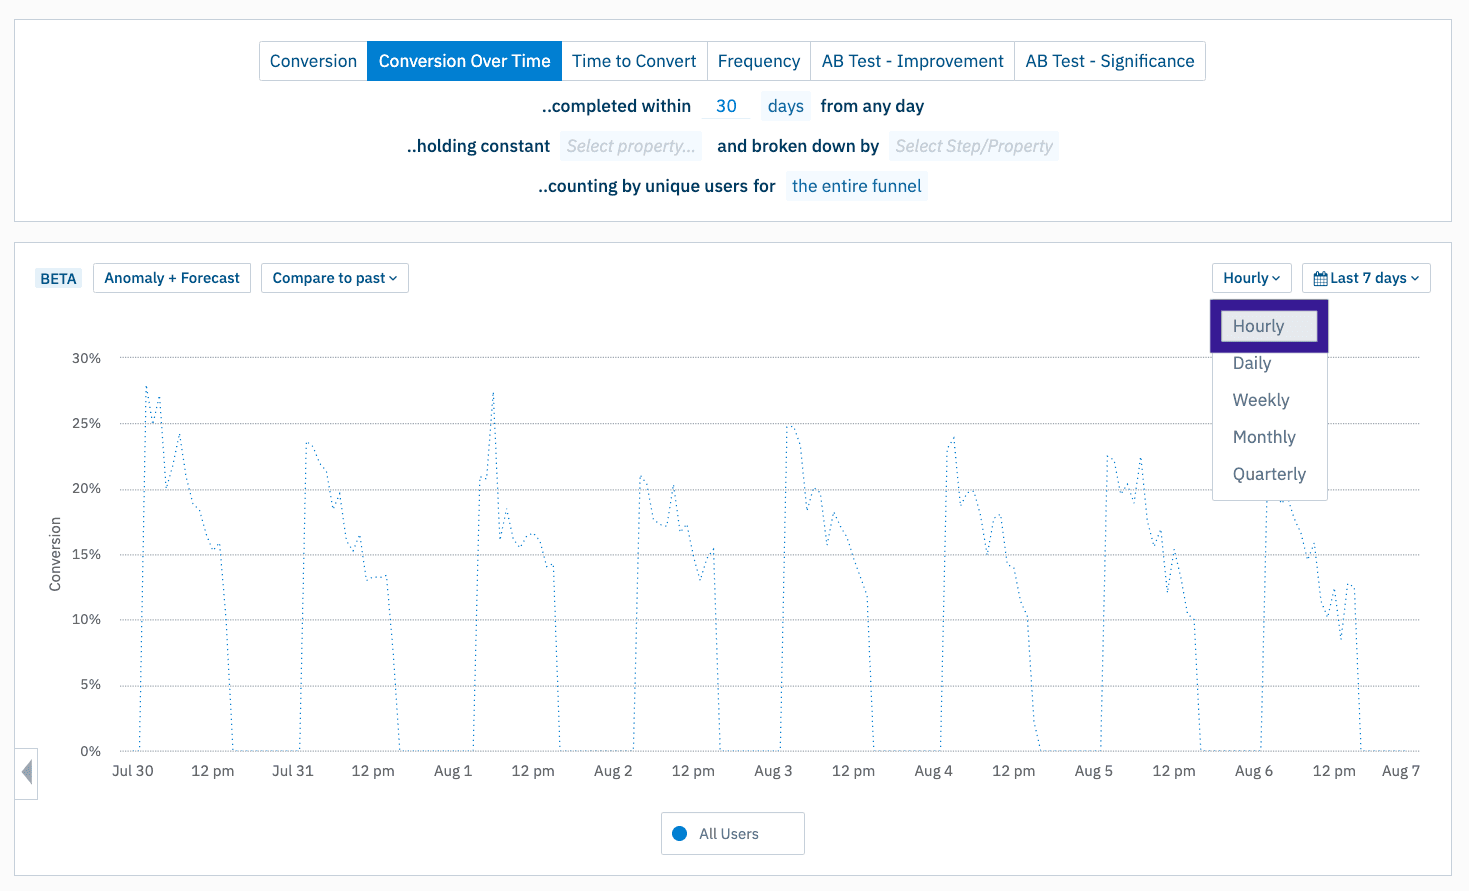
Conversion Over Time View helps customers understand whether their investments are helping or hurting their conversion rates, and to identify when critical processes break. We’ve improved the view with hourly intervals, so you can now monitor these changes across days, rather weeks. That way, you can monitor how features or experiments impact your funnel throughout release day, or pinpoint exactly when a conversion rate dropped off.
As an added bonus, customers who purchase the Insights add-on are now able to set monitors for conversion rates at an hourly interval.

New in Behavioral Targeting
Google Ads & Salesforce Marketing Cloud Integrations
Available to Growth and Enterprise plan customers who purchased the Engage add-on.
Amplitude Engage lets you automatically send your behavioral segments in Amplitude to ad networks, marketing automation tools, and personalization engines for retargeting.
We’ve extended our Engage partner network to include Google Ads, and Salesforce Marketing Cloud, so you can extend the power of Amplitude’s behavioral cohorting to your ad campaigns and marketing automation.
Click here to learn about Amplitude Engage.

New in Data Management
Permission Groups
This feature is currently in Beta. Available on the Enterprise plan.
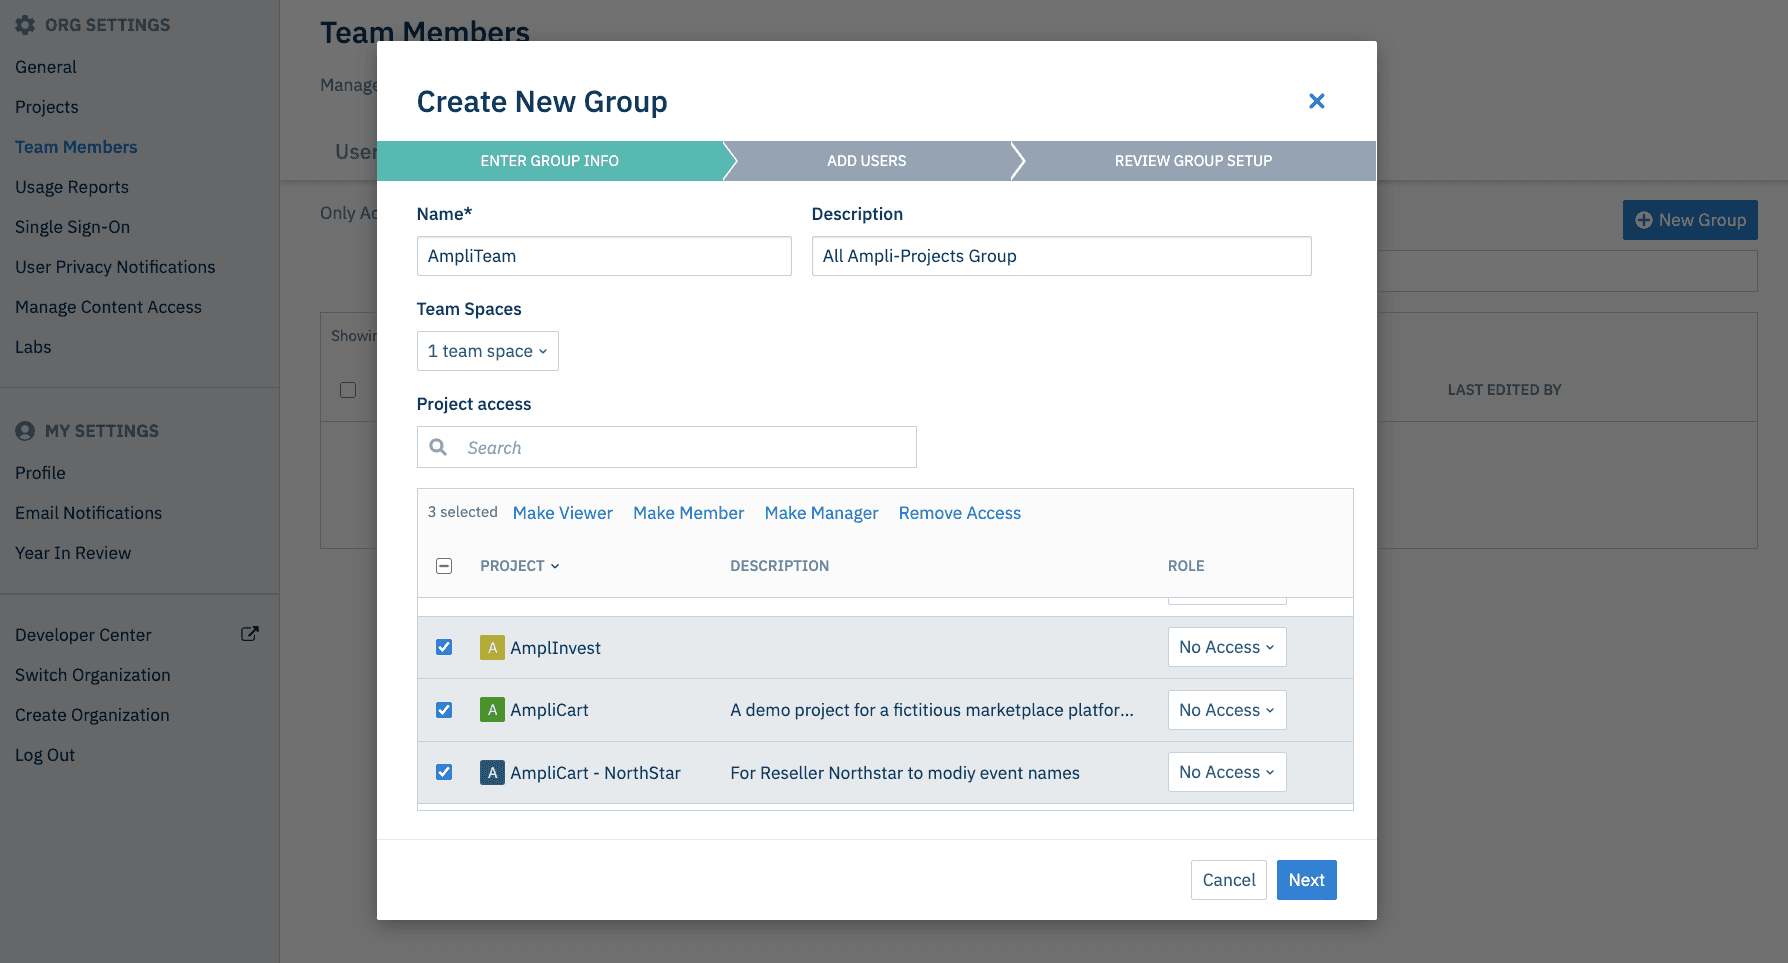
Permission Groups allow you to manage Amplitude user permissions at scale. With Groups, you can add multiple users to a Group and quickly assign them sets of permissions, allowing you to easily provision and manage your Amplitude organization.
For example, create Groups of users like “Marketing Team” or “Payments Team” and assign project permissions to them in bulk. This allows you to control different groupings of users rather than managing each individual user’s permissions.
Want to start using permission groups? Reach out to a member of our team to opt into the Beta and follow the instructions in Settings ->Team Members -> Groups (shown below).


Grant Wensley
Former Technical Product Marketing Manager, Amplitude
Grant is a former technical product marketing manager, writing the “how we do it” section of Amplitude’s story.
More from Grant


