Release Notes: June 2020
Updates to Pathfinder, a brand new feature to understand critical user milestones, and more. Take a closer look at the features our team shipped this June.
New in Analytics
New in Pathfinder
Available on the Enterprise, Growth, and Scholarship plans.
Amplitude strives to deliver clear, actionable insights with every aspect of our platform. Our customers continue to use the Pathfinder chart as a springboard to understanding the critical paths in their product, but from recent feedback we saw an opportunity to improve clarity in the chart results, and make it easier to take action once interesting paths are discovered.
Pathfinder now counts total conversions for a given sequence you select on the chart, and visualizes it at the top of the page. The value is two-fold. First, counting the total conversions of a sequence helps you understand its popularity in your product, and more importantly, you can create cohorts directly from the visualization for use in other analysis like retention, or for behavioral targeting through Amplitude engage.
Visit our docs, or watch this demo to see how it works:
Historical Count
Available on the Enterprise, Growth, and Scholarship plans.
Historical Count property is an industry-first innovation that powers milestone analysis at scale. It helps you find and analyze the milestones that propel users on their journey to becoming a high-value customer. For example, Mindbody used Historical Count to learn that finishing your 5th workout is a critical step for users to become loyal customers. Now they monitor 5th workout as a KPI in Amplitude, and make product bets to help users get there faster.
Historical Count is more accurate than just differentiating between new and returning users. Instead of categorizing a user’s events as “new” because they were new to your product that week or month, we’re now able to measure how many times a user has done this specific action — ever. With Historical Count, you can filter events for “Nth time” performed, just as you would filter for any other event property.
Learn more about Historical Count and milestone analysis here.
Stacked Bar Chart
Available on all Amplitude plans.
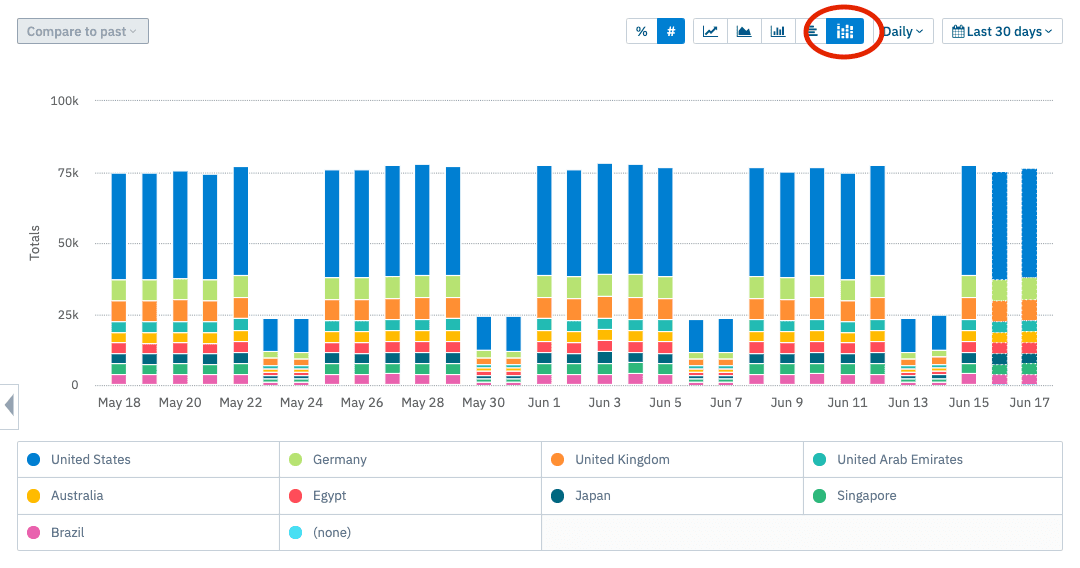
A popular feature request, Event Segmentation’s new Stacked Bar Chart visualization displays time series metrics as a stacked bar of either total event count, or percentage of total events.
New in Behavioral Targeting
Appcues Integration
Limited to growth and enterprise customers who purchased the Engage add-on.
Amplitude Engage lets you automatically send your behavioral segments in Amplitude to ad networks, marketing automation tools, and personalization engines for retargeting.
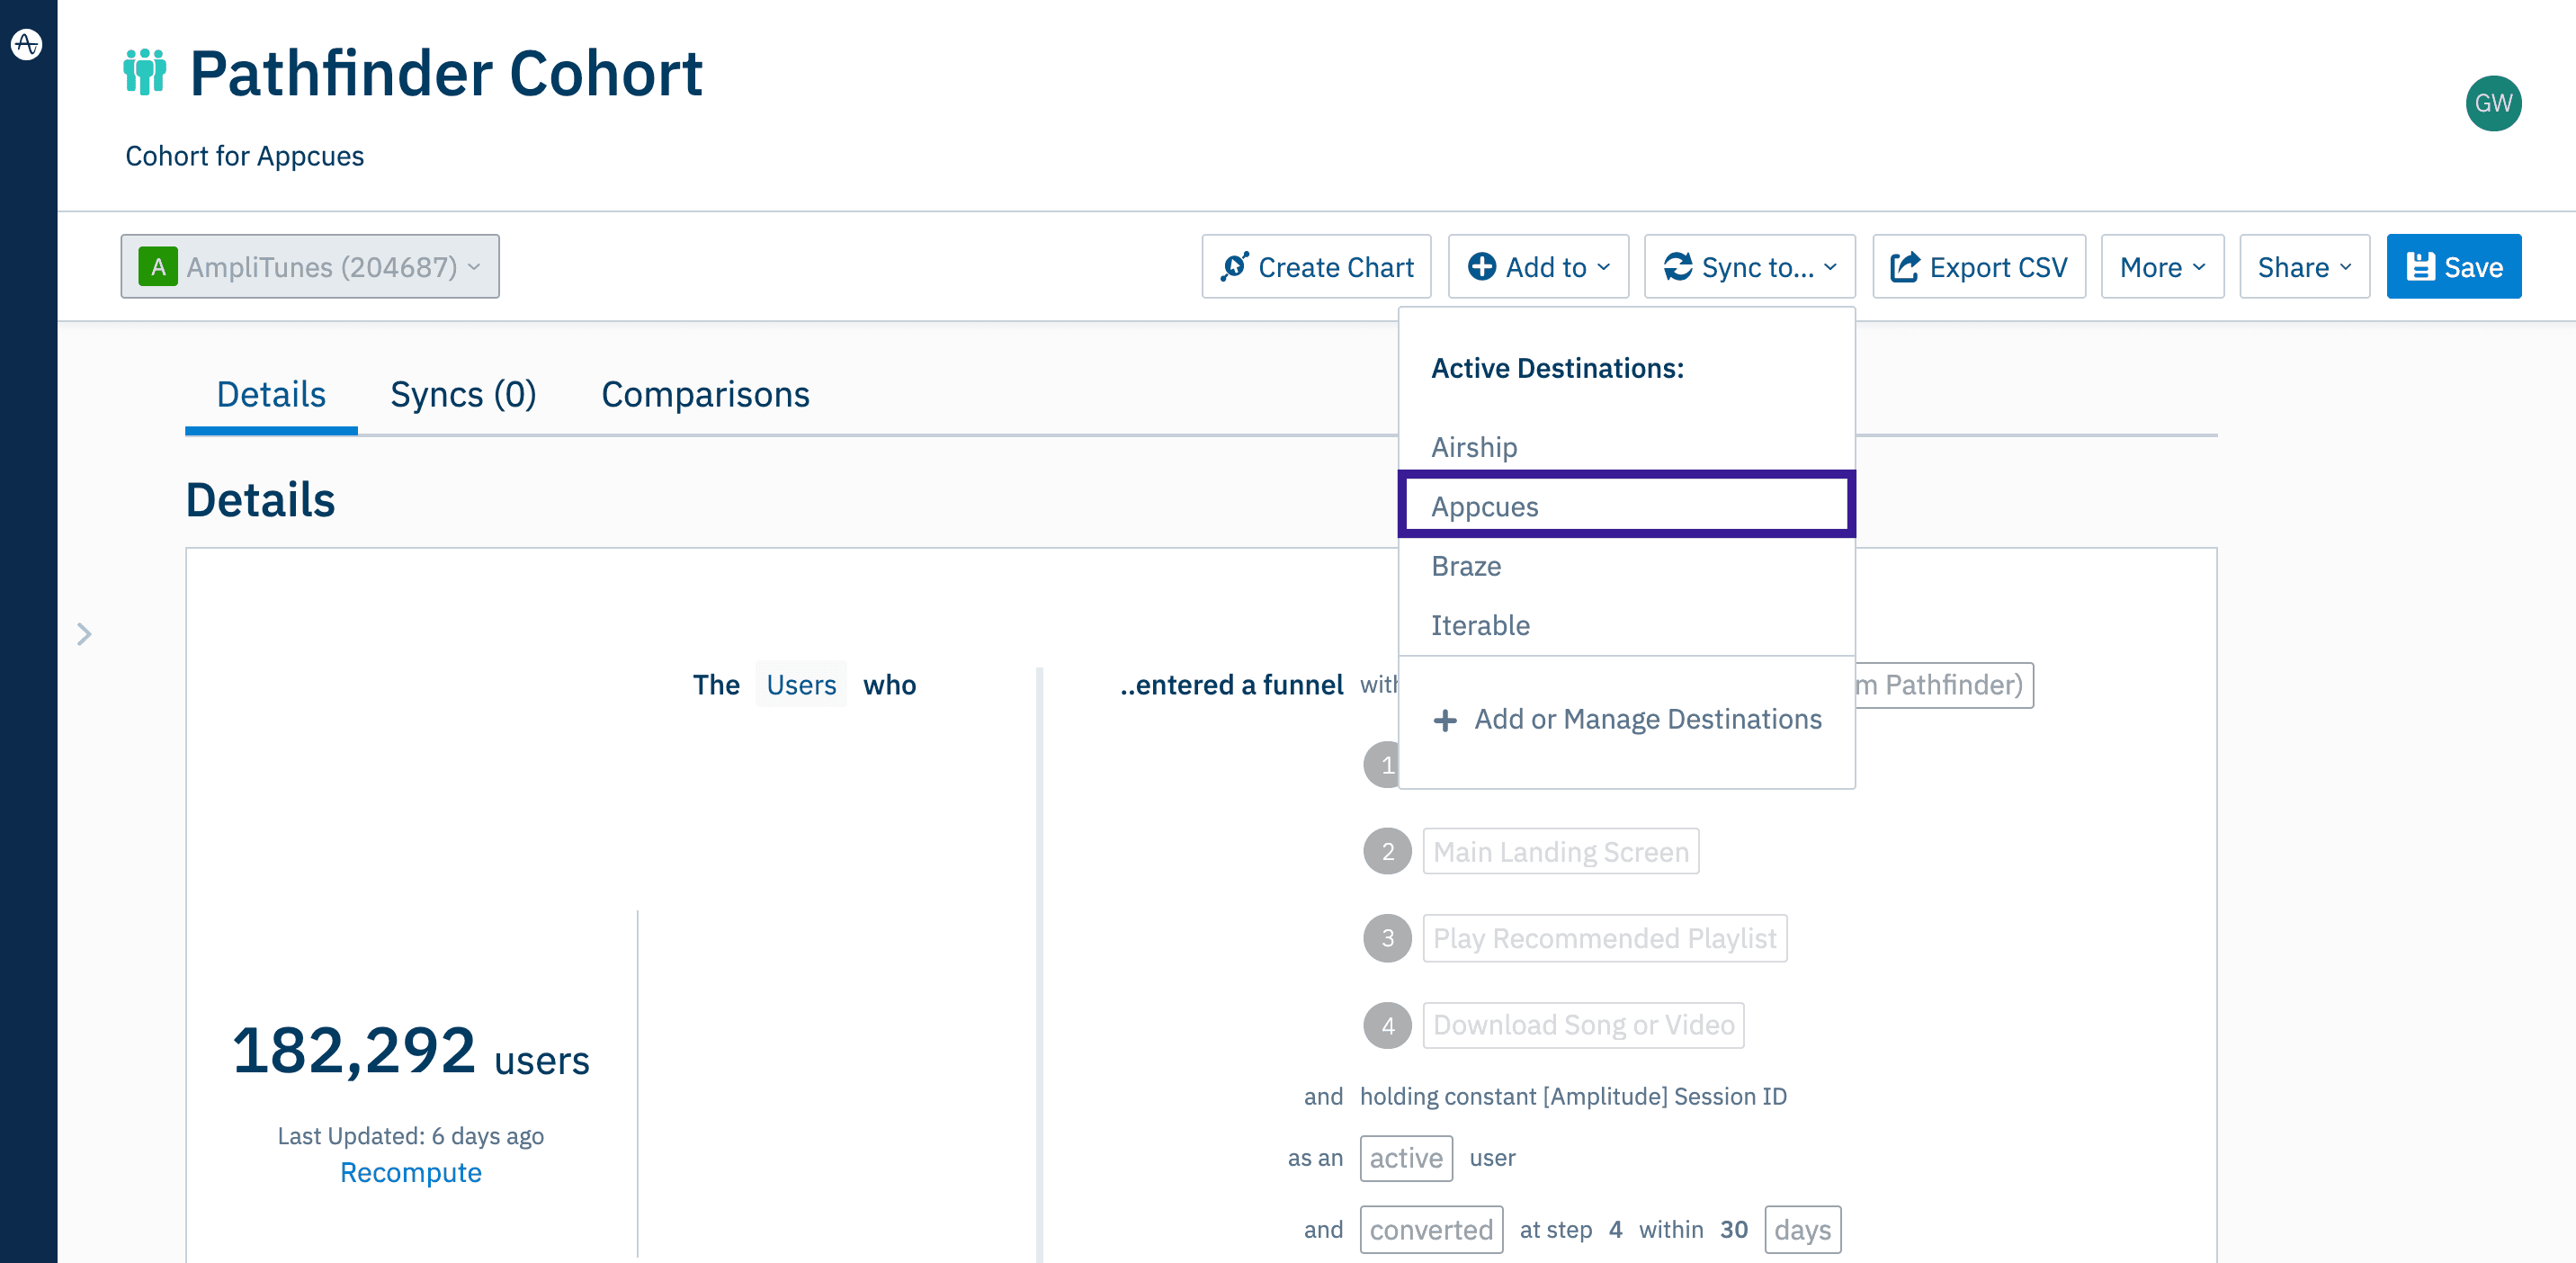
We’ve extended our Engage partner network with a new two-way Appcues integration, so you can send target cohorts tool tips and walkthroughs, and measure their impact in Amplitude. To get started, click “Sync to…” from the cohort page and select Appcues under “Add Integration”:
New in Collaboration
Share bulk dashboard filters
Available on all Amplitude plans.
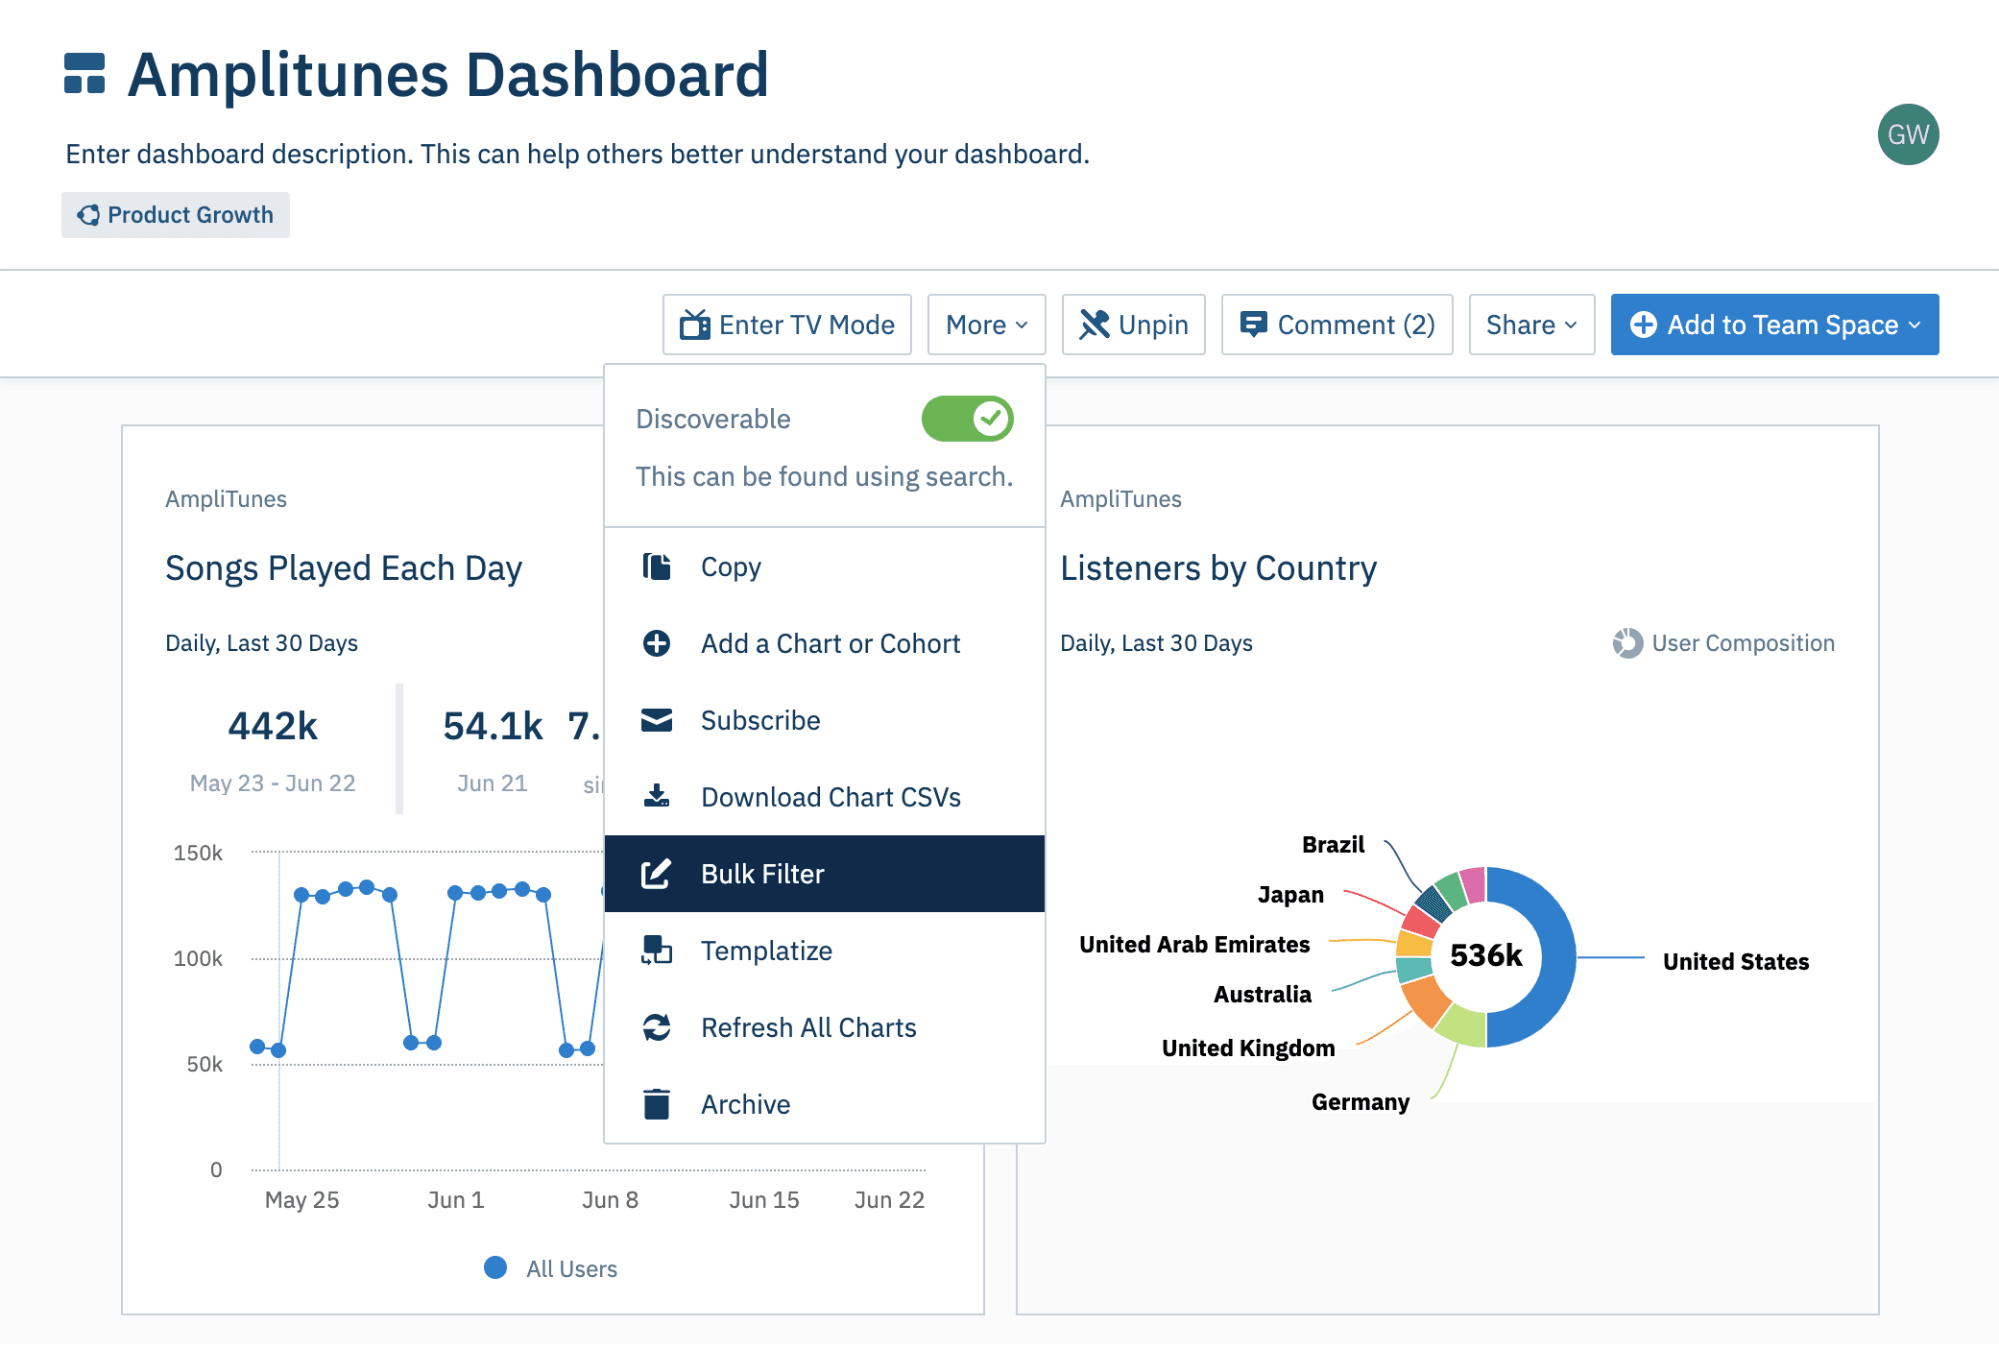
Bulk Dashboard Filters temporarily update all charts on a dashboard with alternate date ranges, intervals, or user segments. They allow new users to build off their teammates’ previous work, and they help experienced users quickly answer questions like, “how do these KPIs look for my book of customers?” To enable users to share the insights found on filtered dashboards, Amplitude now generates unique chart URLs as you apply bulk filters. Find bulk filters under the “more” button on saved dashboards as shown here:
Team member filtering
Available on all Amplitude plans.
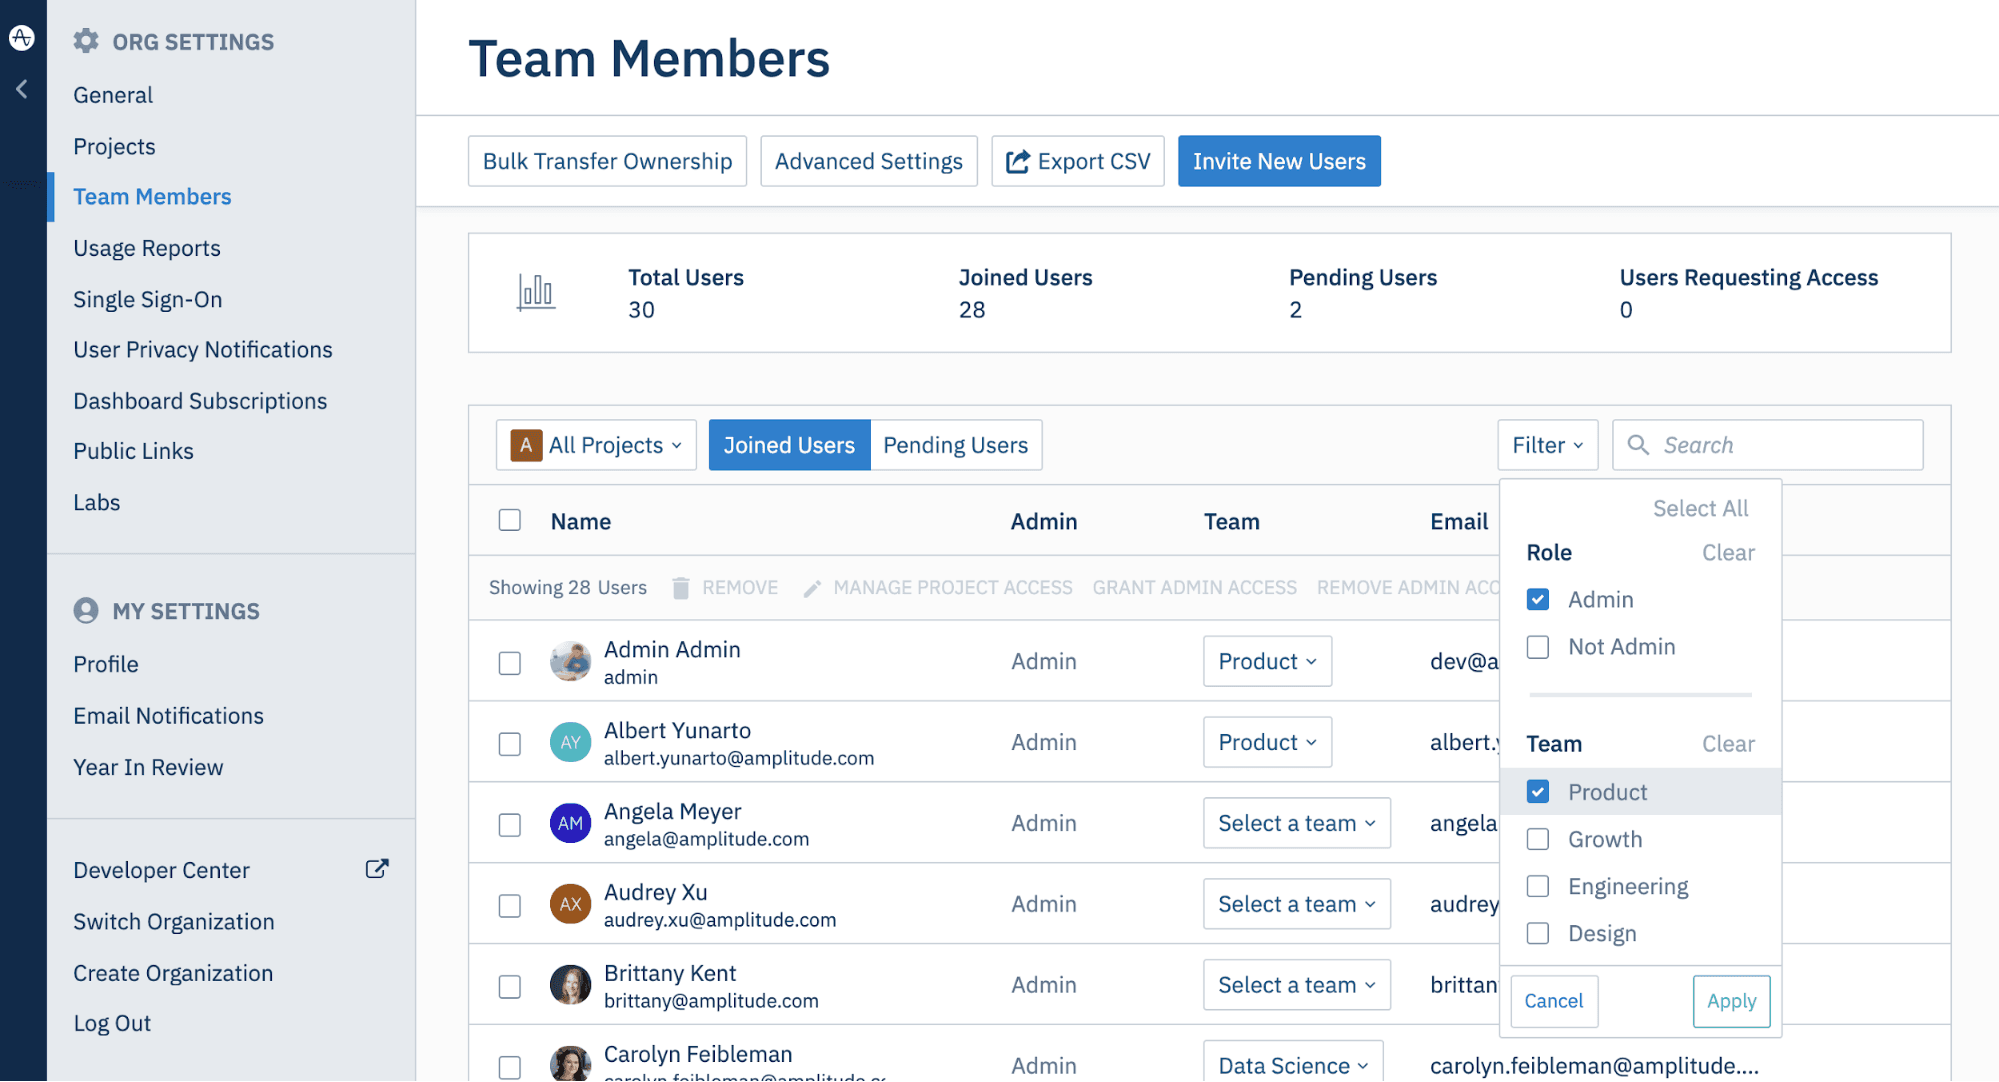
Amplitude Admins often manage users in bulk, so it helps to drill down by role, team, or invitation status (expired/active). For example, they may want to assign all non-admins to a particular project or to bulk delete expired invitations. Now, Team Member Filtering allows organizations to filter by role, invitation status, and team within the Team Members settings page.
Have you ever had to recreate the same dashboard for different customer accounts, countries, platforms, or other user properties?
New in Data Management
Adobe Analytics Data Source
Currently in open Beta.
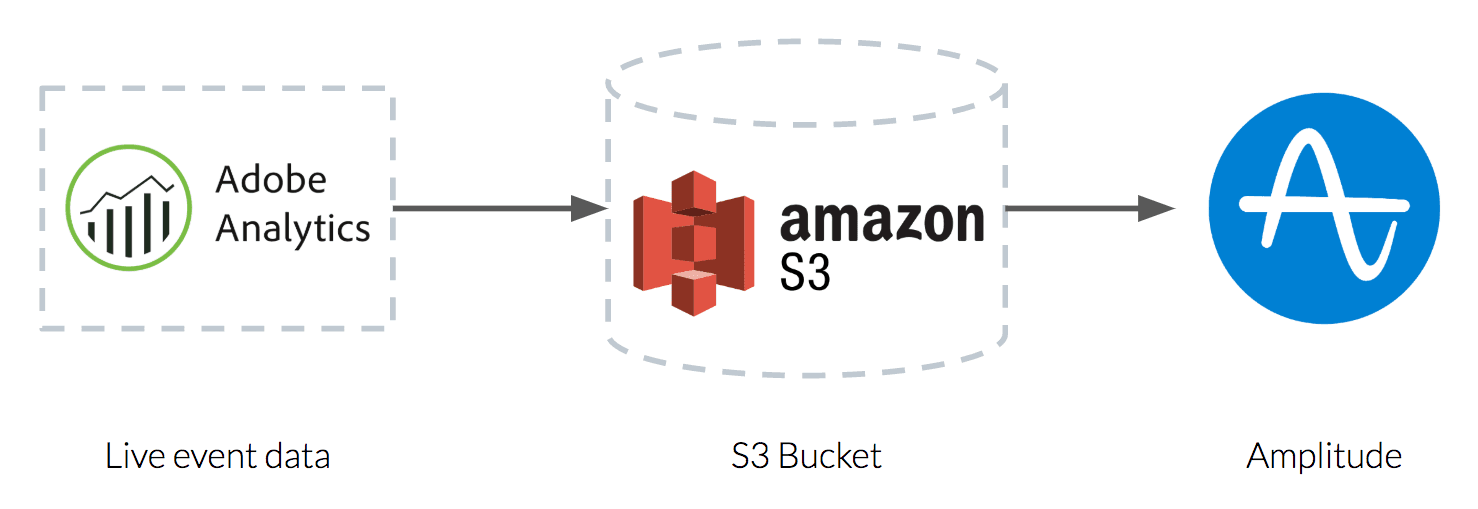
By integrating Amplitude into their workflow, Adobe Analytics customers can expand their web and channel reporting to analyze their complete customer journey across any device. Additionally, Amplitude provides non-technical users access to product data, who would otherwise need an Adobe expert to run queries for them. To make this a seamless experience, we’ve built an in-product connector to pass events from Adobe Analytics to Amplitude without any engineering work.
See here for our documentation on the integration.
Amplitude Export to S3
Currently in Beta, available for growth, enterprise, and scholarship customers.
Amplitude data is often used in conjunction with a data warehouse for business and financial reporting, or SQL analysis. To make this easier, our new Amazon S3 connector lets you pass data from Amplitude projects to a designated S3 bucket automatically.
Reach out to your success manager, or platform@amplitude.com to opt into the beta program.
Data Subject Access Request API
To maintain compliance with GDPR/CCPA, we’ve built a Data Subject Access Request API to export all events for a given user. See here for full documentation.
Amplitude SDK Updates
- Amplitude’s iOS SDK now supports macOS Applications. Access the cocoapods here.
- Amplitude has launched a new Flutter SDK for better performance and complete functionality. Access the flutter SDK on GitHub here.
- We understand the importance of backend SDKs, and are pleased to announce a dedicated Node.js SDK. The SDK provides basic models for event reporting, the ability to customize event processing prior to ingestion, and lays the groundwork for future server-side SDKs. Access the Node.js SDK on GitHub here.

Grant Wensley
Former Technical Product Marketing Manager, Amplitude
Grant is a former technical product marketing manager, writing the “how we do it” section of Amplitude’s story.
More from Grant


