Release Notes: Q3 2021
Funnel analysis within Experiment, new data connections to Recommend, and improvements to our core Analytics product - here are Amplitude's key releases from Q3 2021.

In Q2, Amplitude’s product and engineering teams were laser-focused on launching new products, and the first unified Digital Optimization System. In Q3, they shifted focus to refining that system. Amplitude’s first complete quarter as a multi-product company brought innovations to Experiment, Recommend, and Analytics. Together, they help customers more deeply understand the impact of product bets, recommendations, and experiments, and allow them to operationalize those learnings in more platforms across their stack. Here are Amplitude’s biggest releases from Q3 2021.
Funnel Analysis for Experiment
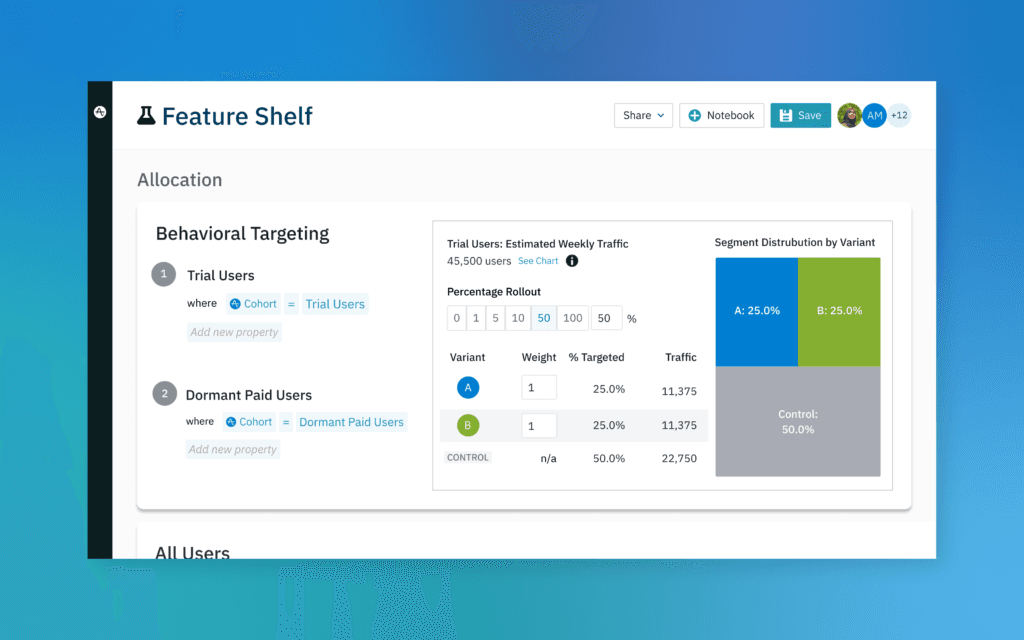
The magic of Experiment is its integration with Analytics and Recommend. It allows you to run high impact A/B tests and remotely configure experiences for any user segment, and measure their behavioral impact in the same system. Now, we’ve made the experiment analysis workflow more seamless by integrating Amplitude Analytics’ most popular chart, Funnel Analysis, directly into Amplitude Experiment.
Experiment and Experiment Results customers can now access two Funnel views directly from Amplitude Experiment:
- Unique conversions per user over time
- Totals / property sums.
You can also compare two variants based on the property sum or average in the last step of the funnel. This provides the benefits of sequential testing, while simultaneously allowing you to dive deeper to understand which steps of the user journey are most likely to see significant dropoff. Watch the quick demo below, or read our help docs here for full guidance on funnels in Experiment.
Funnel Analysis for Experiment is only available to customers who have purchased Amplitude Experiment.
Experiment Exposure Tracking Made Easy
A common problem when running experiments is conflating the assignment of one user to one variant, with the exposure of another user to the same variant. In other words, just because a user has been assigned a variant for a flag, doesn’t always mean they have been exposed to the variant within an application. For example, say you’re running a new checkout experiment, where the exposure event is incorrectly given the default assignment. Users who are assigned a variant (e.g. treatment) but never exposed to the checkout page may skew the experiment results.
Client-side Experiment SDKs now provide a mechanism to automatically generate exposure events, which are tracked via a configured analytics provider interface. The exposure event is generated and tracked when the variant() method is called and a valid variant is found in the SDKs storage.Automatic Exposure Tracking with Amplitude Analytics SDK integration is now available on all client-side Experiment SDKs (JavaScript, iOS, Android, and React Native). See our full Experiment SDK documentation here.
Additionally, experiments can now have sticky bucketing enabled through a simple toggle in the experiment config. Sticky bucketing means that users that have already been allocated to a variant will continue to receive that same variant even if bucketing, allocation, or rollout are changed.
Experiment SDK improvements listed above are only available to customers who have purchased Amplitude Experiment.
New Data Connections for Analytics and Recommend
LaunchDarkly
With Amplitude’s LaunchDarkly integration, you can export your Amplitude cohorts and use them as segmentation and targeting criteria in the LaunchDarkly platform. From there, you can create feature flags for specific segments of users defined by your Amplitude data. To get started, contact your success manager to opt you into the integration program, and follow the self service setup process described in our documentation here.
Self-Service Merge User S3 Export
Amplitude’s behavioral graph includes a powerful identity resolution tool. Our engineering team is working hard to make this unique approach to tracking users across devices useful to our customers in other platforms. Now, you can export the merged user logic created in Amplitude, into your data warehouse or source of record through the new Self-service Merged User S3 Export. To get started, follow the instructions in our documentation here.
OneSignal
OneSignal offers a powerful multi-channel platform that includes mobile and web push notifications, in-app messaging, SMS, and email. When you integrate OneSignal with Amplitude, you can develop sound messaging strategies that drive user engagement and optimize conversions. For example, you can export behavioral cohorts from Amplitude to OneSignal to create dynamically responsive audiences. You can also send OneSignal engagement events back to Amplitude, initiating a cohesive data loop from one platform to the other. See full documentation here for additional use cases, and instructions for integrating Amplitude and OneSignal.
Hubspot
Last but not least, HubSpot is now available as an Amplitude destination! This allows you to sync your Amplitude-built cohorts to your HubSpot contacts lists for targeting purposes. Please contact your CSM if you are interested in using this integration, and check out the integration setup instructions here.
The data connections listed above are only available to customers on the Growth, Scholarship, or Enterprise plan.
Historical Count for Revenue Events
Amplitude’s Historical Count feature helps you achieve a deeper level of understanding when you’re investigating why your users are retaining, converting, or engaging—or why they’re failing to do that. It captures each Nth instance of any user action (up to the fifth), right out of the box. This helps you quickly pinpoint and resolve areas of friction for first-time users, so that you can boost your overall North Star metric. By popular customer requests, historical count is now supported for revenue events in both charts and cohorts! This applies the power of Nth time analysis to revenue.
Historical count is only available to customers on the Growth, Scholarship, or Enterprise plan.
Directional Anomaly Support in Monitor
Amplitude’s Insight package provides access to Monitor – advanced data mining and machine learning techniques that automatically detect anomalies in your product data and instantly surface these hidden trends to you. Now, When creating a confidence interval condition in chart monitors, you can specify whether to monitor anomalies in a positive direction, negative direction, or both.
Monitor is only available to customers on the Growth, Scholarship, or Enterprise plan, who have also purchased the Insight package.
To stay up to date on Amplitude releases as they are shipped, visit Product Updates in the Amplitude Community.

Grant Wensley
Former Technical Product Marketing Manager, Amplitude
Grant is a former technical product marketing manager, writing the “how we do it” section of Amplitude’s story.
More from Grant


