

Update: In May 2016 we updated our analytics architecture to NOVA. .
Three weeks ago, that we are giving away for free for up to 10 million events per month. That’s an order of magnitude more data than any comparable service, and we’re hoping it enables many more companies to start thinking about how they can leverage behavioral analytics to improve their products. How can we scale so efficiently? It comes down to understanding the nature of analytics queries and engineering the system for specific usage patterns. We’re excited to share what we learned while scaling to hundreds of billions of events and two of the key design choices of our system: pre-aggregation and .
Existing Technologies
Performance is the most critical factor when building an analytics platform. It is necessary that the end user be able to interactively run queries and reports on the data because a major part of analytics is exploration. If you have to wait minutes or hours for a question to be answered, you simply can’t iterate on hypotheses and investigate in a meaningful way. Our goal at Amplitude is to allow our customers to throw as much data as they want at the system while still being able to load reports in seconds, all without paying more than $10 per million events. This is the core principle driving the systems we build — we aim to provide powerful, interactive analytics to our users at a reasonable price.
Before we go into the details of our architecture, it’s useful to take a look at some existing technologies in the space. We don’t believe in reinventing the wheel, but we also aren’t afraid to when third-party solutions can’t do the job well enough. In this case, while there are systems out there capable of handling the scale we’re at, they all fall short in the performance vs cost tradeoff. At one extreme, you can store all of your data in an in-memory database, e.g. or , which will have good performance and allow for flexible queries. While suitable for certain types of data, in-memory databases are usually cost-prohibitive for processing the event data that drives behavioral analytics due to scale. This is especially true for apps experiencing a lot of growth or those who have yet to figure out the best monetization strategy (which is often what analytics is used to determine!).
Comparison of analytics technologies: performance vs cost
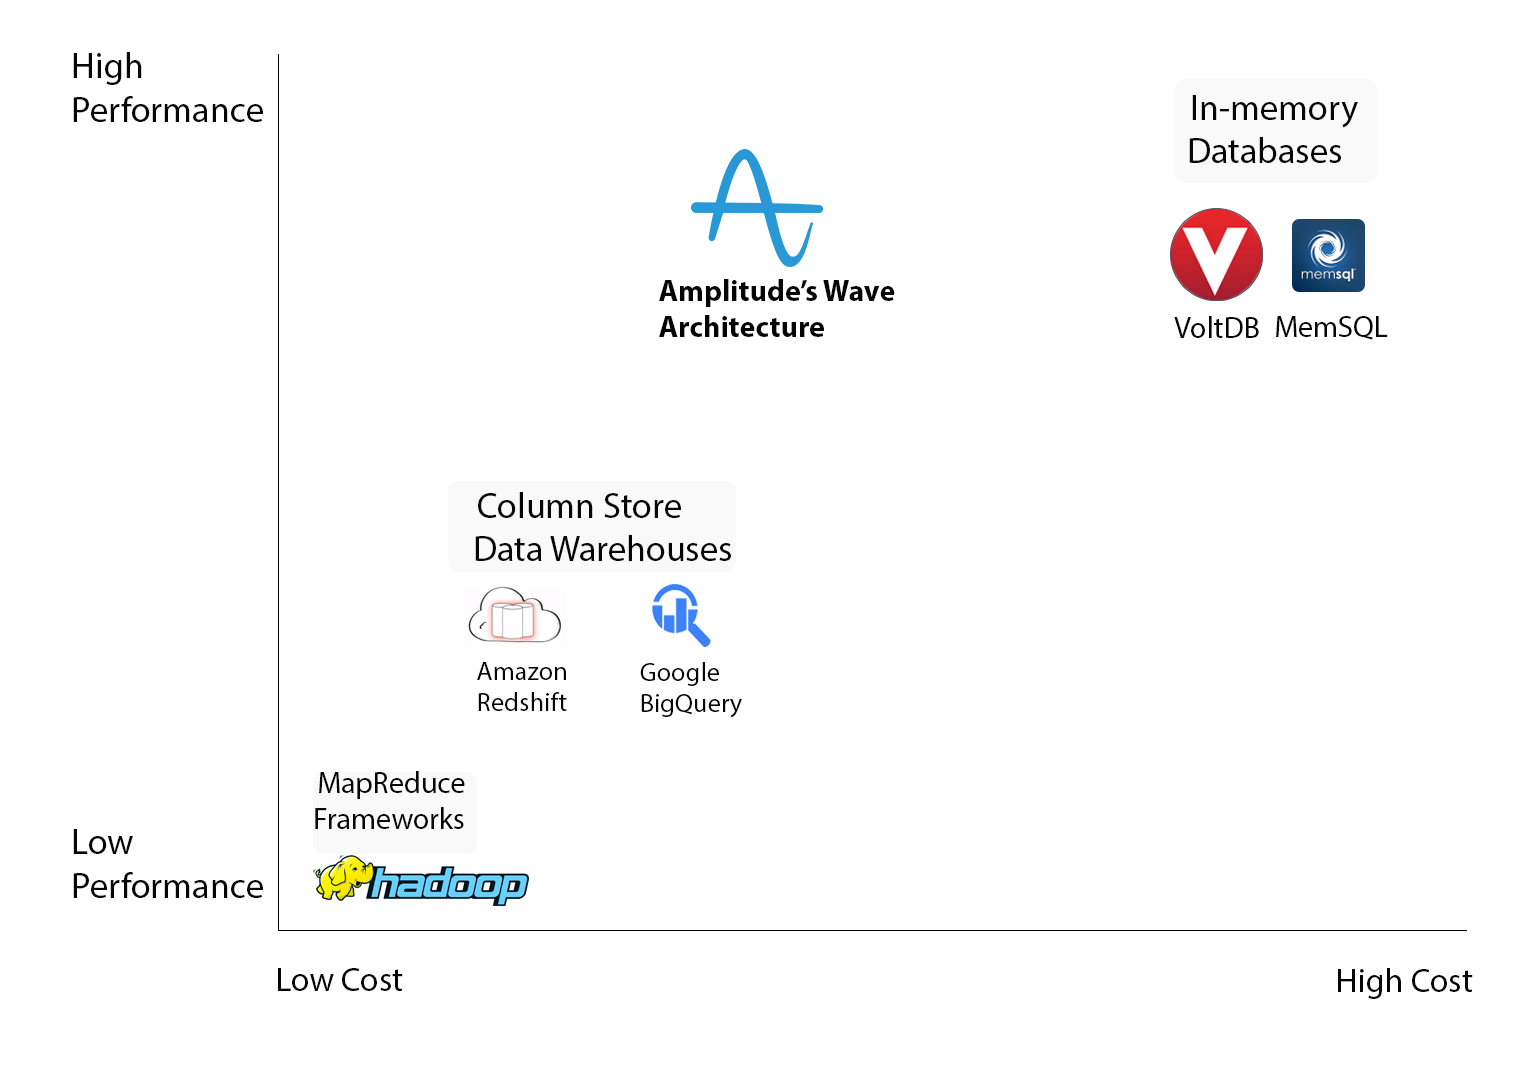
Most other technologies fall closer to the low-cost, low-performance end of the spectrum. Column-store data warehouses, e.g. , and MapReduce frameworks, e.g. , are popular tools for building analytics platforms that have seen widespread adoption thanks to their ability to handle data at scale. Redshift is a great product, and we actually , but as a generic column-store data warehouse, it lacks context around usage patterns and the types of complex queries that are common in user analytics. Hadoop, on the other hand, was designed explicitly for non-interactive analytics and thus has significant intrinsic latency on queries, regardless of the complexity. Furthermore, both Redshift and Hadoop suffer from perhaps the most common issue among all such systems: storing all the raw event data on disk (even in an optimized, columnar format) and querying over it will never lead to the most performant system.
None of these existing solutions satisfied what we wanted for Amplitude’s underlying architecture: a high performance system that could still cost-effectively scale for storing and querying on billions of events. We went through several major iterations, trying combinations of various third-party tools that ultimately failed to deliver. Over the past couple years, we’ve custom-built many of the components of our infrastructure, which we’re collectively calling the Amplitude Wave Architecture, to meet our goal of a high performance, yet low cost system. Pre-aggregation and lambda architecture are two foundational design choices that we’ve used to build and scale Wave.
Pre-aggregation
To achieve the speed that users expect and return results in a reasonable time frame, many analytics services are forced to sample data, which is . As a result, we’re continuously focused on improving performance at Amplitude so that we can provide the most accurate results in a timely manner. It turns out that the easiest way to make queries fast is perhaps the most obvious one: pre-aggregate partial results beforehand so that at query time it is faster to construct the final result. We started with this basic idea and built a system around it.
When looking at the types of questions that a behavioral analytics service needs to answer, you can boil it down to one thing: what sets of users exhibit certain behaviors? These behaviors can range from simple, e.g. they were active on a particular day, to more complex, e.g. they are using an Android phone and came back to the app 7 days after installing it (retention). Most of the core metrics, including , can be expressed as computations involving various sets of users. Let’s look at our retention example in detail:
Users on an Android phone who came back to the app 7 days after installing it = (Android users) ∩ (Users who installed 7 days ago) ∩ (Active users today)
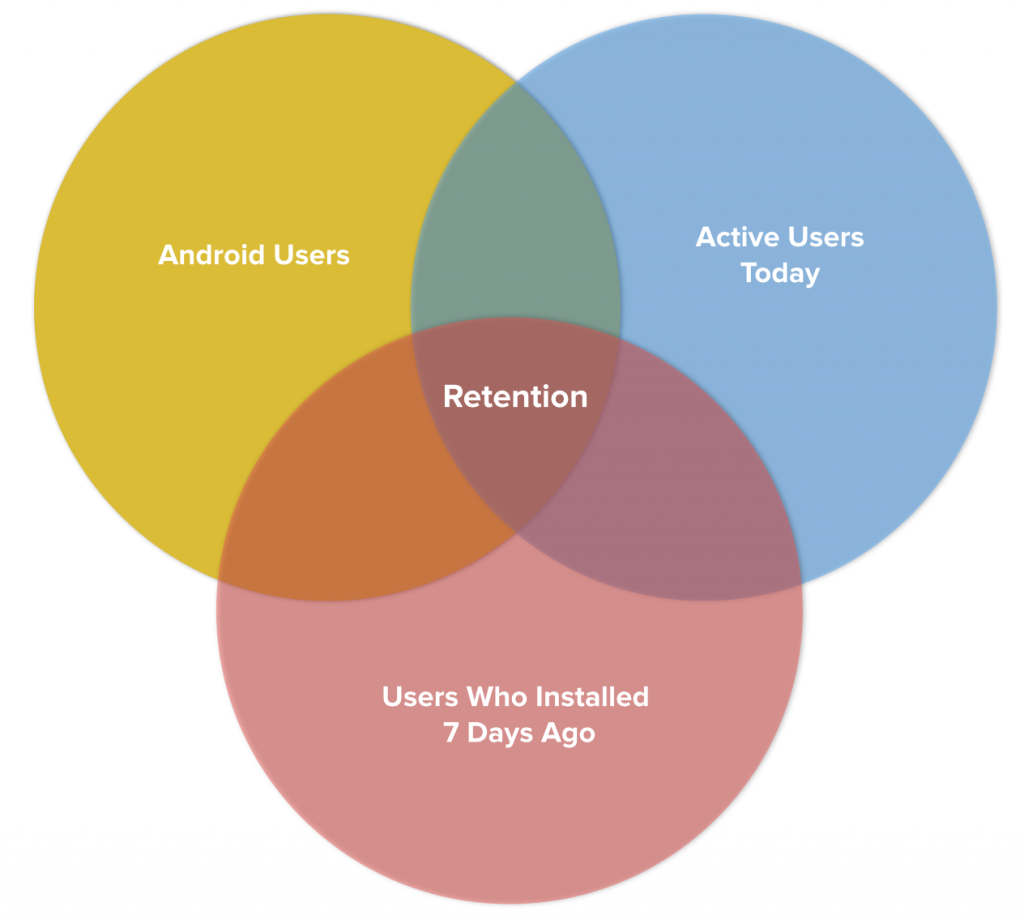
The complex retention behavior is broken down into an intersection of three sets, each of which is simple in nature. We pre-aggregate each of these classes of user sets, i.e. users on each OS, users who install on each day, and users who are active each day, so that at query time it’s simply a matter of fetching the proper sets and performing the intersection. For an app sending one billion events per month, the total amount of raw data is around 1TB whereas the size of these specific sets is a few hundred MB — an over 1000x reduction in data processed compared to a MapReduce job that looks at all the individual events (this is an intentionally unfair comparison to emphasize how many orders of magnitude we’re talking about). By representing queries in terms of pre-aggregated sets, we significantly reduce the resources that need to be allocated at query time while maintaining high interactivity.
Lambda Architecture
There are two major disadvantages to the pre-aggregation approach: , in order to update the pre-aggregated results in real-time, and high storage overhead, in order to store all of the pre-aggregated results. Fortunately, people have been thinking a lot about how to build these kinds of systems recently, and we were able to leverage recent research on to address both of these issues. When our CTO Curtis and I came across Nathan Marz’ original blog post on (the inception of the lambda architecture) a year and a half ago, we realized that it contained many of the ideas necessary to build the foundation of Amplitude’s infrastructure.
First, a quick detour to explain what lambda architecture is and why it matters. We start with the basic principle that “data is immutable,” which is true because data represents a piece of information at a point in time. Events in the context of analytics are a perfect example of this; the piece of data is that a user performed an event at a specific time. Each dashboard or report can be thought of as a query function applied over all of the data in our system in the way that a naive MapReduce job would look at every field of every event to compute a metric. This works fine as a mental model, but it won’t be performant over any dataset of significant size.
Lambda architecture overview (Adapted from: http://lambda-architecture.net/)
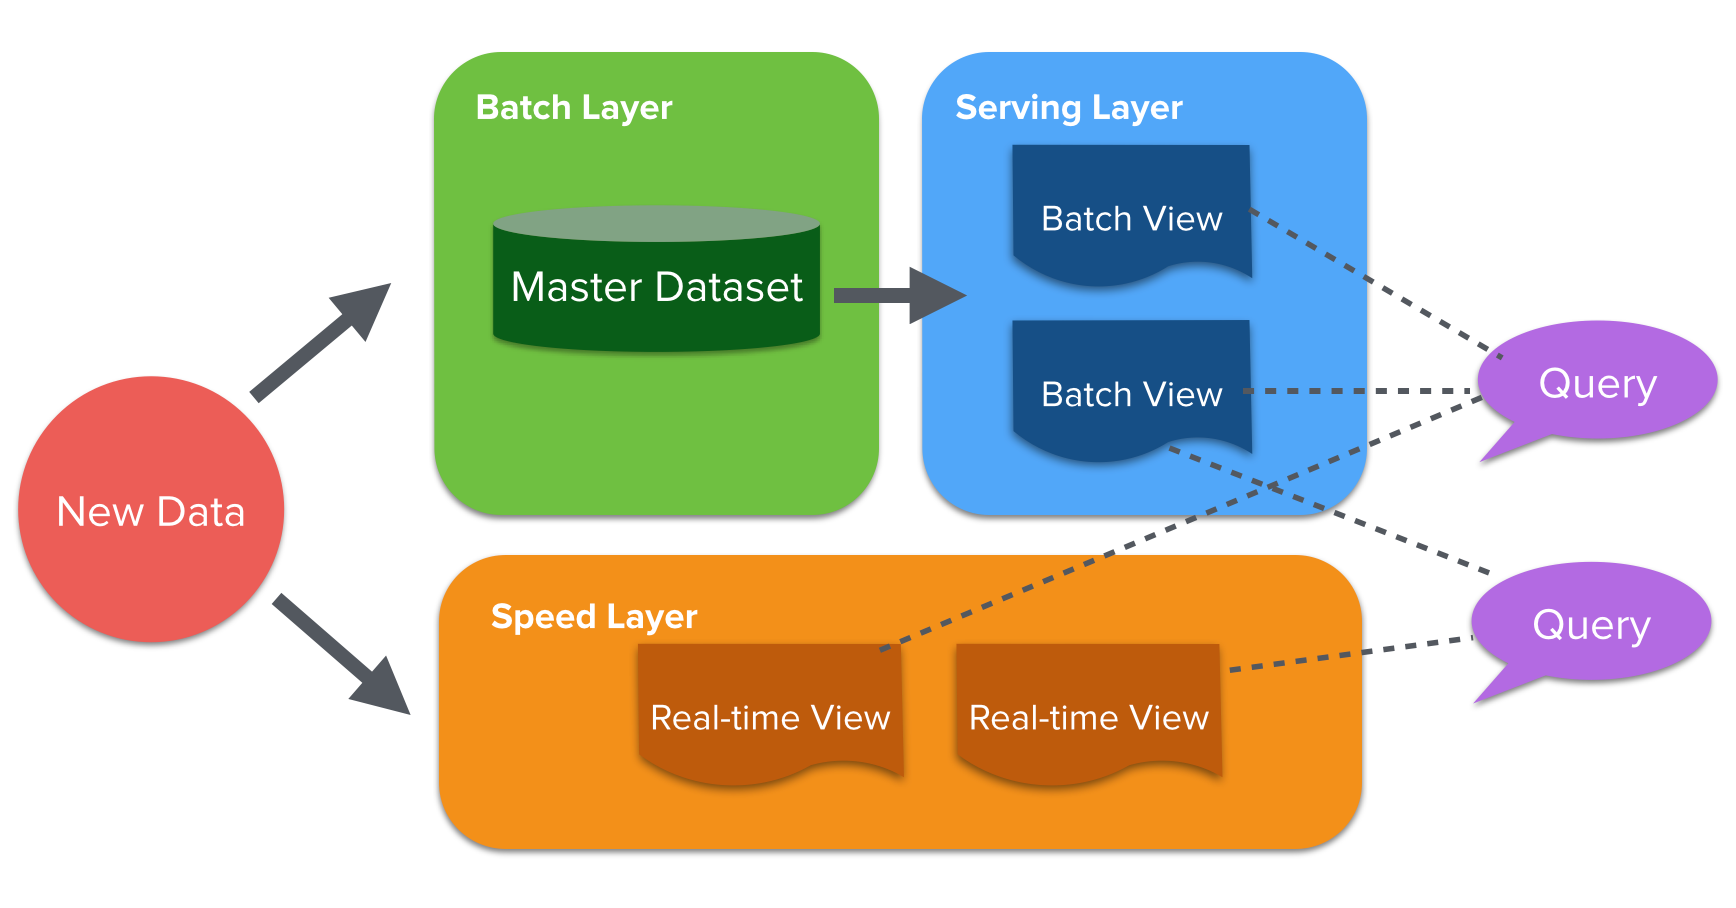
The natural direction to go is our conclusion from earlier: pre-aggregate partial results for the query function, i.e. “views” on the data. Now, imagine a scenario in which you didn’t care about real-time updates, e.g. you only run reports daily. Then you simply collect the data over the course of a day (the “batch” layer) and run the pre-aggregation at the end of the day to produce the resulting views (the “serving” layer). Assuming the views you’ve computed in the serving layer can be assembled into the final query result, you’re done — well, except for real-time data. That’s where things get more interesting: batch computations are easy, but maintaining mutable views that are updated in real-time is another beast. The premise behind lambda architecture is accepting that incremental state updates are hard and minimizing their impact (the “speed” layer). If pre-aggregated batch views are available daily, we only need to maintain real-time views for the last day of data — after the data has been processed from the batch layer, we can throw away the results from the speed layer. The implications of this turn out to be significant in the context of building our architecture and addressing the issue of high storage overhead.
In summary, lambda architecture is a data processing model in which you break down queries into views that are produced by layers: the batch and serving layers process data at a longer interval, e.g. an hour or a day, while the speed layer processes data in real-time. The main benefit is that the system supports real-time updates without needing to maintain infinitely growing mutable state, which is prone to both “.”
Amplitude Wave
So lambda architecture is a nice theoretical model, but what does that look like in practice? Let’s revisit the concept of the pre-aggregated sets (our manifestation of views) that are used to power many of the dashboards in Amplitude.
Amplitude Wave architecture
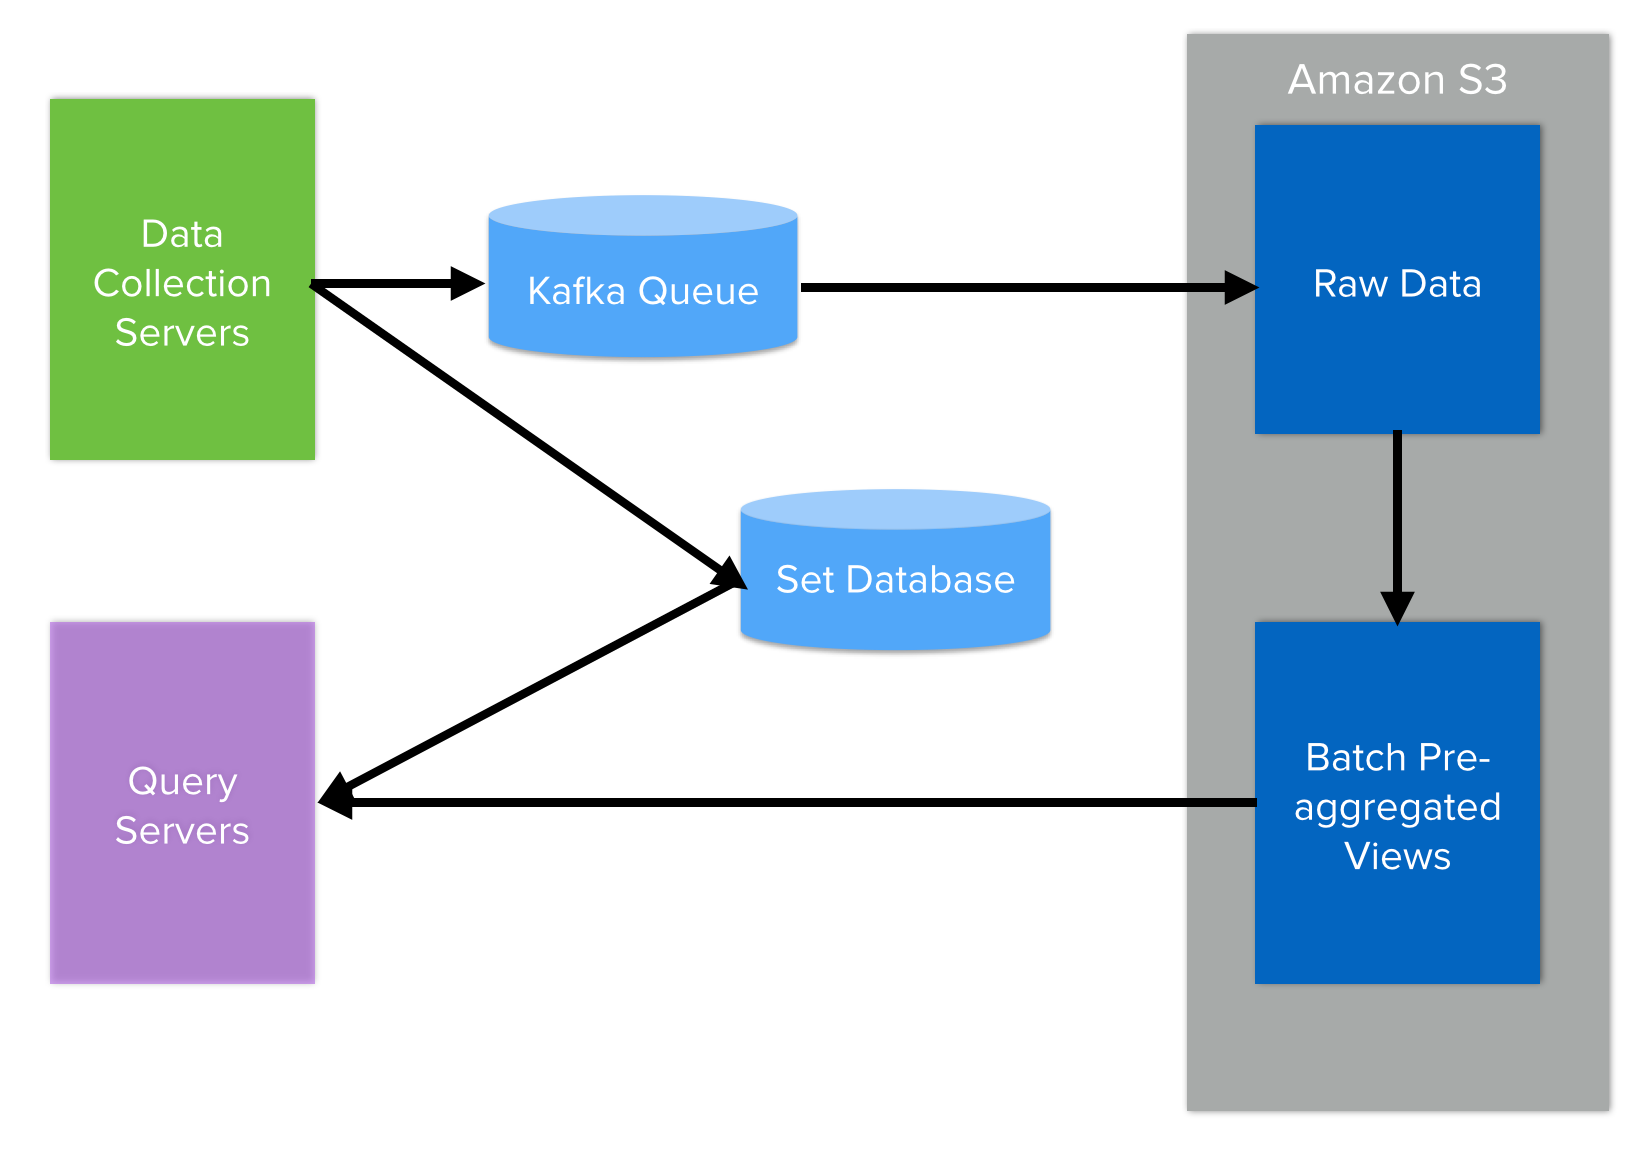
As event data is collected from mobile devices , it reaches the speed layer in roughly one minute. Views in the speed layer are optimized for both reads and writes because they’re used when loading graphs in addition to updating thousands of times per second as events come in. Updating a pre-aggregated set, e.g. active users, involves a membership check and potentially an insertion (depending on whether the user already exists in the set). Our first attempt to do this used , where each member of a set was a row in the database, but this didn’t scale well. Between the , the need for an index to perform the membership check, and queries scanning over millions of rows, aggregating sets in PostgreSQL ended up requiring far more disk seeks than we could afford. While a great general-purpose database, PostgreSQL was not the right solution for this problem, and we went back to the drawing board.
After extensive research into existing technologies’ abilities to address our use case, we found nothing that would perform at the level we needed; thus we built a high-performance database similar to that performs set operations in memory. Managing sets in memory is efficient for both reads and writes and easily supports the rate of updates that we need. As mentioned previously, the tradeoff is that holding pre-aggregated views in memory is expensive (10x the price of SSDs if you compare ), so the database logic is complex in its aggressive memory optimizations. This where we see the benefits of throwing away results from the speed layer after a day — the expensive, in-memory database holds only a limited set of data, and any errors in the incremental updates are corrected by the other layers. By confining the complexities of managing mutable state to the speed layer, we greatly reduce both the risk and cost of running our distributed system.
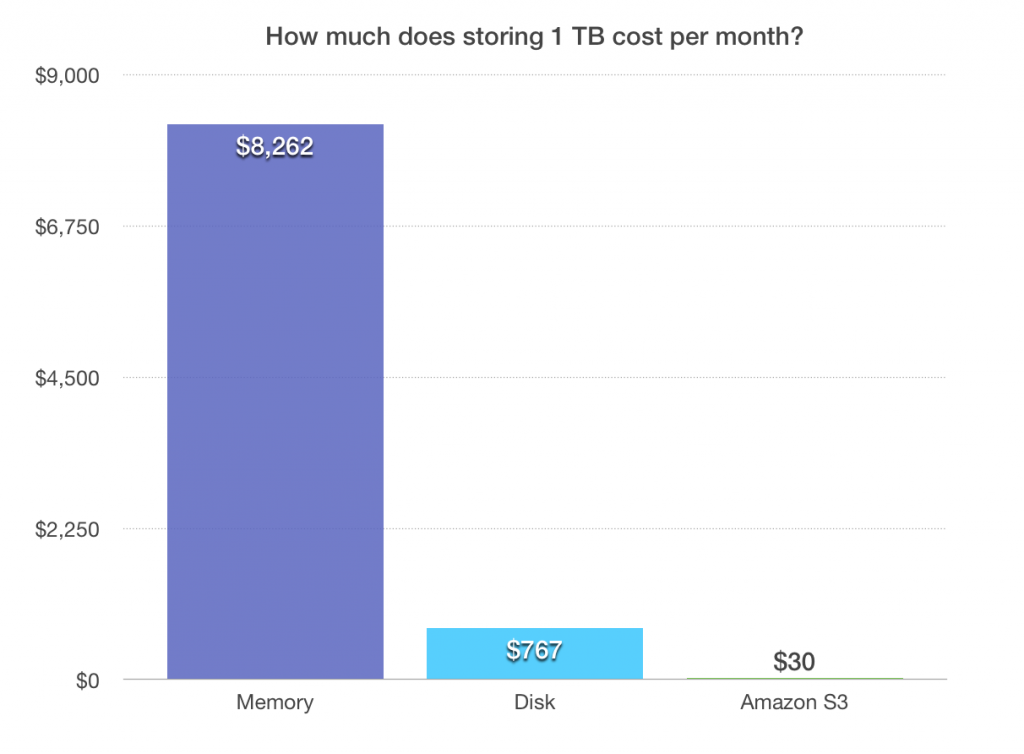
The batch layer is responsible for storing all raw data, and these days there is a natural choice for doing that: . The benefits of S3 are threefold: it’s easy to interface with, “infinitely” scalable, and cheap. In conjunction with the batch layer is the serving layer, which is responsible for the batch pre-aggregated views. Once per day, we run a job — effectively a MapReduce — that processes all of the raw data from the previous day and produces the views. These views are also stored in Amazon S3, so even though they take a considerable amount of storage, the costs are mitigated by the efficiency of S3: the (it’s slightly worse in practice since you pay for puts and gets as well). This design choice is based off an important fact about data in analytics: most of it is “cold,” in the sense that you rarely need to query it, so minimizing storage costs is the top concern. The structure of the serving layer has an additional benefit: the views are optimized for reads and not writes since we don’t do any real-time updates to the data. This means that, unlike the complex nature of the real-time set database, the views aggregated by the serving layer are simple and less error-prone, leading to improved long-term reliability of the system.
Monthly cost comparison of storing 1 TB of data in memory, on disk, or in Amazon S3. At Amplitude, we take advantage of S3’s efficiency to minimize storage costs in the serving layer of our architecture.
Finally, at query time, we bring together the real-time views from the set database and the batch views from S3 to compute the result. Because of their pre-aggregated nature, queries are lightning fast and allow for the type of interactive, exploratory analysis that drives real insights. Aside from supporting our pre-aggregation needs, the separation of layers inspired by lambda architecture has yielded many benefits ranging from lower costs to increased robustness to the ability to add new views. In our experience, it’s proven to be a powerful model for managing complexity in data processing systems.
Analytics for Everyone
Here at Amplitude, we think a lot about scaling analytics features in a cost-efficient way because we believe that budget should never be a reason to limit what you can do with your data. Moreover, sacrificing features for the sake of cost is never an option — our customers deserve state-of-the-art analytics that can provide them value far beyond what they’re paying for it. Pre-aggregation and lambda architecture are two of the many ideas that we’ve implemented to make Wave a reality, and we plan to share more in the future. By identifying exactly what needs to be done with event data and how frequently it needs to be updated, we’ve designed an architecture that dramatically reduces the costs associated with running an analytics platform. We’re excited to pay it forward to the community and encourage everyone to !
Comments
: Why didn’t you just use Redis?
: If you think about these problems upfront, they’re not too difficult to solve for a specific use case (partition data on disk, allow reads from disk on startup), but Redis has to be generic and so can’t leverage the optimizations we made.
: A minor point regarding the MemSQL cost issue. You can use the column storage of MemSQL to store some of the data and therefore reduce the cost associated with it.
: So yes, it’s a bit inaccurate to put MemSQL in that corner of the graph — the product itself has a spectrum of cost/performance.
: Very informative – ty. Is there a chance for a followup with some more details (ehm, repo, ehm) about the Set Database that Amplitude had set up? Benchmarks, sizings, design and that kind of stuff is always super… 🙂
: Thanks for the kind words! We definitely plan to share more details about our infrastructure, so look out for more in-depth blog posts in the future. Open-sourcing is a bit further out; since we’re still small and things are evolving so rapidly, it’s hard to find the time to polish projects to open-source quality. We definitely hope to get to the point where we can, though 🙂
: Thanks for listing costs as one of the driving requirements here — so often, large-scale architectural discussion omits this requirement, bizarrely!
: Very interesting article. Do you have any strategies to deal with large pre-aggregated sets (batch views) on the serving layer ? If there is 2 or more sets with large number of users , how do you perform the intersection ? Thank you
: Thanks for the comment! The sets we deal with, while large, are still manageable in memory (such that our in-memory set database works!). So we simply do a linear-time intersection using hash structures.
: Considering that you’re pre-aggregating data in memory for all possible combination of segments, I couldn’t really understand why you placed your analytics engine near column store data warehouses such as Redshift in x axis of first chart. You will have billions of sets in-memory and continuously aggregate the data at storage layer so I assume that the computational resources the analytic engine needs is now trivial so the cost shouldn’t be that cheap. (Especially near the columnar-storage engines.)