How Smartly Solved a Web Traffic Mystery
We sat down with Allison to hear how she solved the mystery (and saved her company thousands of dollars) with the help of analytics.
A couple months back, Allison Harper, who leads marketing at Smartly, noticed a strange spike in traffic that was showing up in her Amplitude dashboards, but not in Google Analytics.
We sat down with Allison to hear how she solved the mystery (and saved her company thousands of dollars) with the help of analytics, and to learn how she and the rest of the Smartly team leverage analytics in their day-to-day work.
First, let’s learn a little bit about Smartly and what you do there.
I lead marketing at Smartly, a new app that’s all about learning. We’re optimized to help anyone master business fundamentals fast. Smartly’s great for the startup founder, the small-business owner, the junior web developer hoping to move into a larger role – really anyone who wants to get to the next step in their career. We create all of our own content that covers everything from marketing to finance to strategy. And it’s all in 5-minute lessons so you can gain new skills quickly and whenever you have time.
As far as our origin story: A lot of us come from Rosetta Stone, another ed-tech product that’s based on Active Learning methodology. Smartly started in 2013 and we’ve been steadily growing our content and our team since then.
When did you first hear about Amplitude?
We first tried Amplitude a long time ago, actually. We use Segment.io for integrations and were browsing through various options in Segment. We came across Amplitude and experimented with it early on, not long after Amplitude launched. We used it and liked it, and then kind of forgot about it because we weren’t ready to do data tracking for Smartly quite yet. Then later, we started hearing news about Amplitude in startup circles and at that point in time turned the integration back on, logged into our account, and were surprised at some fantastic updates. We thought immediately: “Oh wow, it’s really easy and it’s really fast.”
How do you use Amplitude at Smartly?
We track all of our events on Amplitude and now use the platform daily for a number of things that are essential to our business: Are users experiencing any errors? How do changes to the website influence conversion rate? Which lessons are most valuable to learners?
So, from engineering to marketing to content, we’re all using Amplitude. We use it in tandem with our own internal system of tracking, with Google Analytics, and with the tracking abilities through our various paid media platforms so that we can compare data and get a robust, holistic picture of what’s going on.
Although we still find Google Analytics useful for tracking web traffic from different sources, Amplitude has several huge advantages. The interface makes it easy to understand the engagement levels of individual events that we’re tracking. It’s simple and intuitive to find answers in Amplitude: in some cases it takes 10 more clicks in Google Analytics to find the same thing. Funnels are also much more flexible and easier to use, which is important for looking at our conversion rates.
Have any stories about how Amplitude has helped Smartly?
There was one recent occurrence that made us really happy we chose to integrate Amplitude. We partnered with a vendor to get placement in an external email newsletter. We had projections about a certain amount of traffic and conversions that would result from the campaign. However, once we saw the traffic coming in, it only resulted in some major eyebrow raises.
The mysterious traffic spike.

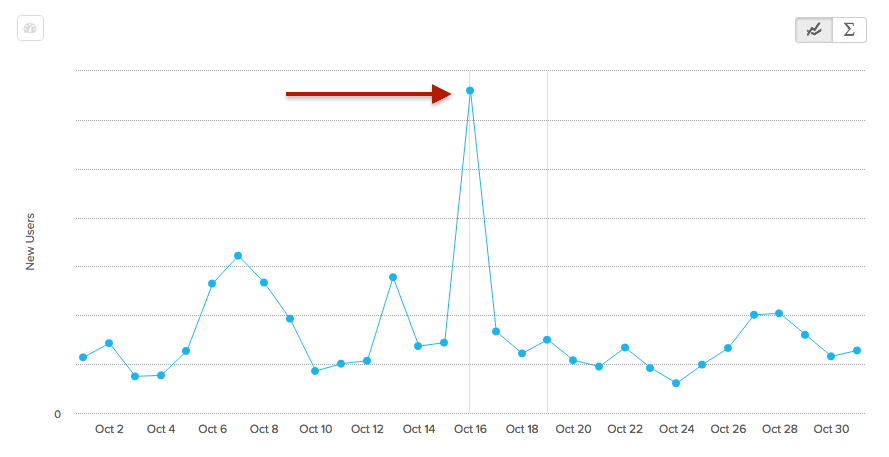
Amplitude tracked a large spike in traffic on a single day without any tapering off. While we were expecting a spike from the campaign, the shape of this one was unusual: we typically see some tapering off in email campaigns, but this spike dropped right back to zero.
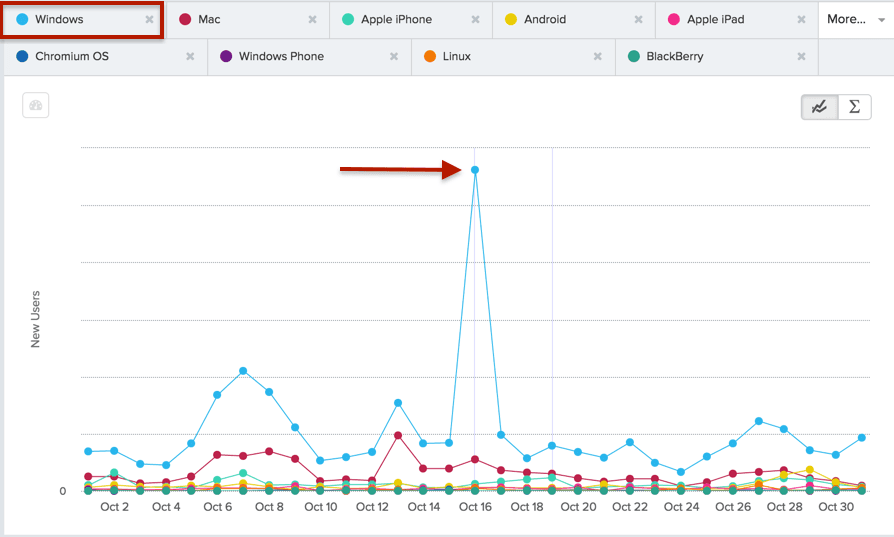
To investigate, we grouped those users by some different properties and saw that almost all of this traffic registered the same OS, browser, and device, which was pretty unusual.
The spike in web traffic grouped by device type. The unusual web traffic seemed to all be coming entirely from Windows desktop, unlike the mix of device types that Smartly typically sees.

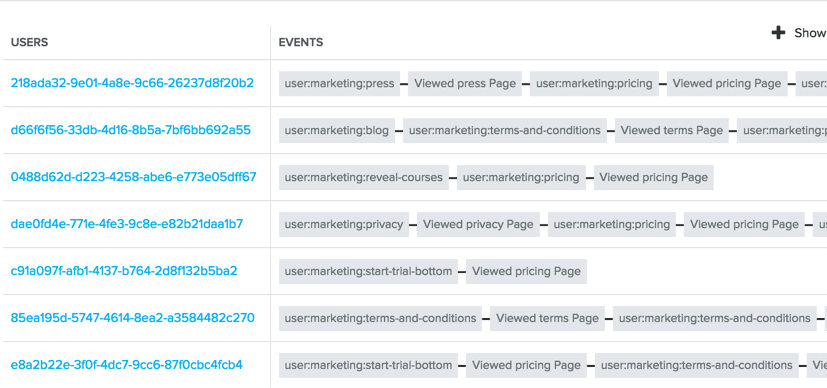
To dig even further, we used Amplitude’s Microscope feature to show streams and see what the users from that traffic source were actually doing on the site. We saw that users took very random paths through our website, with all sessions ending when they reached pages that had no links out (for example, the credit card form). Needless to say, we also didn’t see any conversions from that traffic.
By showing individual user streams using Amplitude’s Microscope feature, Smartly saw that the users who made up the traffic spike were taking random paths through the website, all ending on pages with no links out.

When we checked Google Analytics, which tracks using cookies, we saw that it didn’t register the traffic spike at all. This really pointed to the conclusion that this activity spike was some kind of automated traffic that wasn’t getting picked up by Google Analytics. In this case, Amplitude showed us a view that other platforms didn’t, which was really valuable. And, all of the information together (even the absence of data) helped us draw our conclusions.
After we did as much digging into the data as possible, we ended up sharing the information with the vendor and they refunded us for the campaign. As a startup, it’s important for us to carefully monitor and validate every dollar spent.
We found it amazing that we were so quickly and easily able to identify this issue through Amplitude: it would have taken much, much longer to get to the root of this unusual traffic spike without the group by and Microscope features, which allowed me to get the information I needed with just a few clicks.
This is just one example of how we’ve used Amplitude, but it really sums up the value we get from having an accessible, flexible analytics platform that allows anyone at Smartly to dig into the data and find answers.
**About Allison: **Allison Harper leads marketing at Smartly. Previously, she was a senior manager of sales & marketing at Rosetta Stone, the language learning company. She holds an A.B. in human evolutionary biology from Harvard University.

Alicia Shiu
Former Growth Product Manager, Amplitude
Alicia is a former Growth Product Manager at Amplitude, where she worked on projects and experiments spanning top of funnel, website optimization, and the new user experience. Prior to Amplitude, she worked on biomedical & neuroscience research (running very different experiments) at Stanford.
More from Alicia


