Standardizing Metrics for Product Analytics
Improve the quality of analysis in Amplitude with new ways to create, save and standardize metrics.
When performing analysis in Amplitude, it is common to center your work around events. After all, Amplitude helped pioneer the event-based model for analytics that has now become the industry standard. However, sometimes events alone don’t convey the full context you need to tell a story with data.
When I worked at Salesforce, I once had a new analyst tell me that leads had gone up 3% week over week. He was very excited about this finding and couldn’t wait to figure out what had caused the sudden increase. Unfortunately, his bubble soon burst when I showed him that traffic to the website had increased by 5% during the same period. So instead of us doing better, we were doing worse! Comparing events to other events or numbers in a metric formula is important to establishing context since numbers without context can be misleading.
In Amplitude, you have always been able to create metric formulas by defining formulas within event segmentation charts. For example, if you wanted to see the total number of lead forms completed divided by the number of unique visitors, you could create the formula shown below:
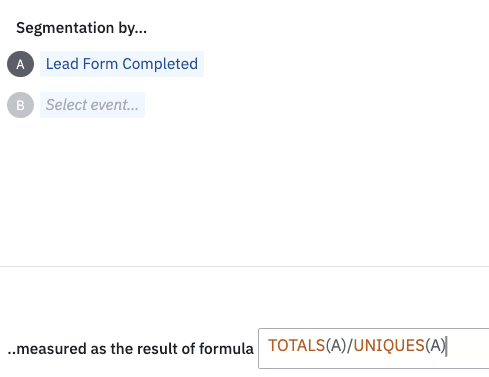
However, once you created this formula, it was only available in the current chart. If you wanted to use the same formula elsewhere, you would have to re-create it.
To make your life easier, Amplitude has now released a new Metric feature that allows you to build reusable formulas (called Metrics) throughout the Amplitude interface.
One way to create a Metric is to save a formula created in the event segmentation report. Once you have created a valid formula, you will see a “save” link that allows you to convert the formula into a reusable Metric:
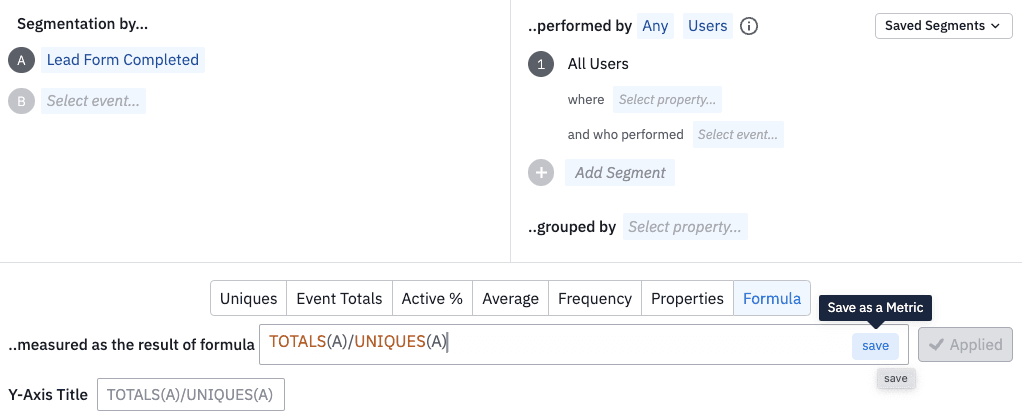
Clicking “save” will allow you to name the Metric and save it so it can be leveraged by anyone in the project:
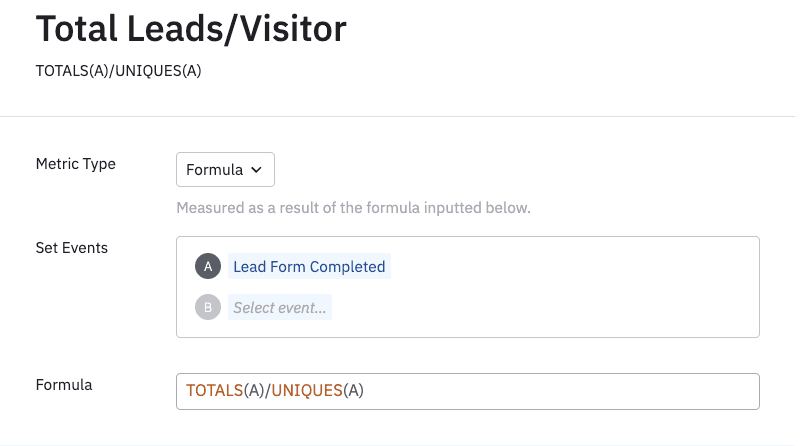
If you are a project manager or administrator of the Amplitude project, you can also “officiate” the metric to indicate that it is an official metric that internal leaders have vetted:

Once a new metric is built, it can be used in event segmentation and data tables. For example, if you build a new Data Table, you can choose the Metrics tab to view all available Metrics:
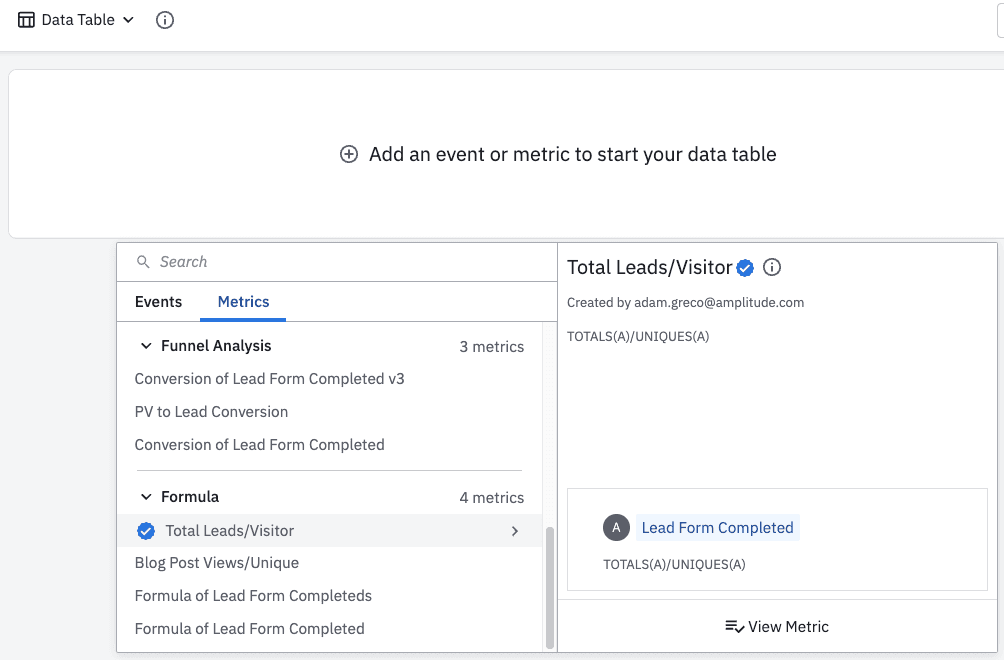
Amplitude also provides several “out-of-the-box” metrics for you:
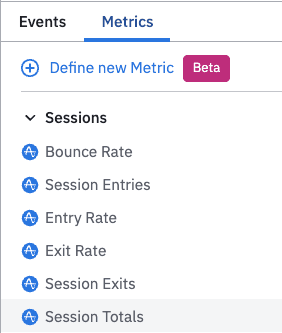
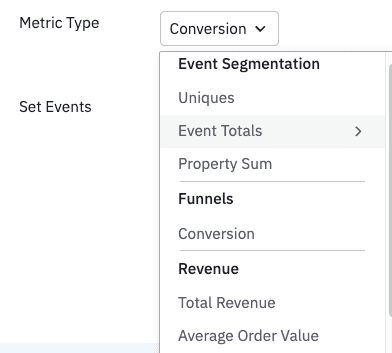
You can create many different types of Metrics. Metrics can be based on event totals, unique visitors, sums of properties, etc.:
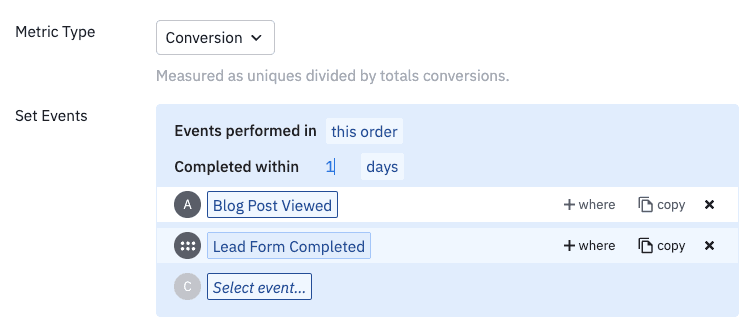
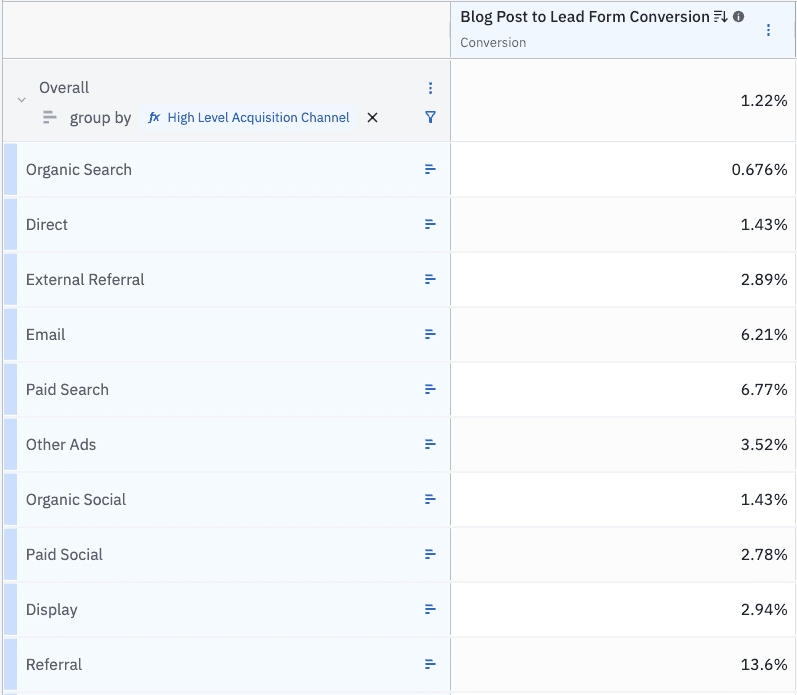
One of my favorite uses of Metrics is Conversion Funnel Metrics. Conversion Funnel Metrics allow you to define a mini-conversion funnel and then use the resulting conversion rate as metric. For example, if you wanted to see which marketing channel drove the most users to view a blog post and then complete a lead form within one day, you might build a Conversion Funnel Metric like this:
This metric can then be added to a report where it can be broken down as needed:
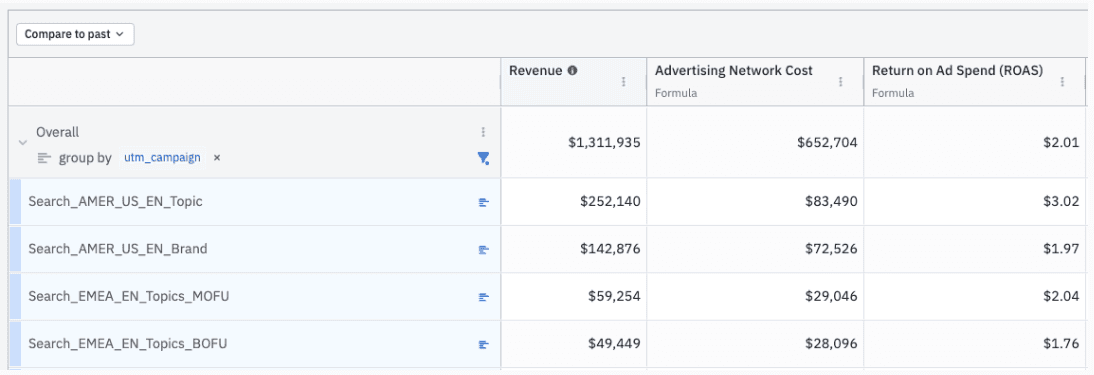
Metrics can be used in many different ways in Amplitude. Recently, Amplitude clients have begun taking advantage of our new marketing analytics features to use Metrics to compute Return on Ad Spend. This can be done by dividing the website/app revenue by the cost of advertising, which can be imported from ad-networks:
We are excited to see how you take advantage of Metrics in your Amplitude project! The new Metric feature is now available in open beta to all Amplitude customers on the Growth or Enterprise plan. You can see documentation on Metrics here. If you want to see Metrics in action, you can view the following demo video:

Adam Greco
Former Product Evangelist, Amplitude
Adam Greco is one of the leading voices in the digital analytics industry. Over the past 20 years, Adam has advised hundreds of organizations on analytics best practices and has authored over 300 blogs and one book related to analytics. Adam is a frequent speaker at analytics conferences and has served on the board of the Digital Analytics Association.
More from Adam

