7 Steps to Measuring the Success of a Feature
Brainstorm, prioritize, and measure which tests have the biggest impact on your core metrics.
Originally published on February 23, 2016
Browse by Category
- Step 1: Measure basic usage of the new feature
- Step 2: Dig deeper into event properties to look for patterns
- Step 3: Understand what users are doing right before using the feature
- Step 4: Build a behavioral cohort of people who used the feature to analyze how they compare to your overall user population
- Step 5: Analyze the impact of the new feature on retention
- Step 6: Measure the impact of the new feature on your key conversion funnels
- Step 7: Measure the impact of your new feature on engagement
- Next steps: Acting on what you’ve learned
- Remember: you don’t have causation yet
- Test, measure, repeat
Your latest update has hit the App Store — you’re excited for your users to try out your new feature that you’ve spent months working on. How do you measure the impact of your new feature? Are people using it? Is it improving your user experience and affecting your company’s bottom line?
To determine whether or not a feature is having the intended impact, you need to look at your user data…but where to start? We’ve put together a 7 step framework to help you analyze the impact of your new feature.
Let’s walk through an example of a music streaming app that lets your users explore and listen to music and create playlists. About a month ago, you released a new feature that lets your users share music within the app with their friends.
You’re hoping the sharing feature will increase overall engagement with your app, and that having this social component will encourage more users to stick around long-term.
Step 1: Measure basic usage of the new feature
First, you need to answer the most basic question: are people using the feature? There are a few key metrics you should look at to get a complete answer to that question:
- total number of times people are using the feature
- the number of unique users who are using the feature
- the percentage of your total active users who are using the feature
- the average number of times per day users are using the feature
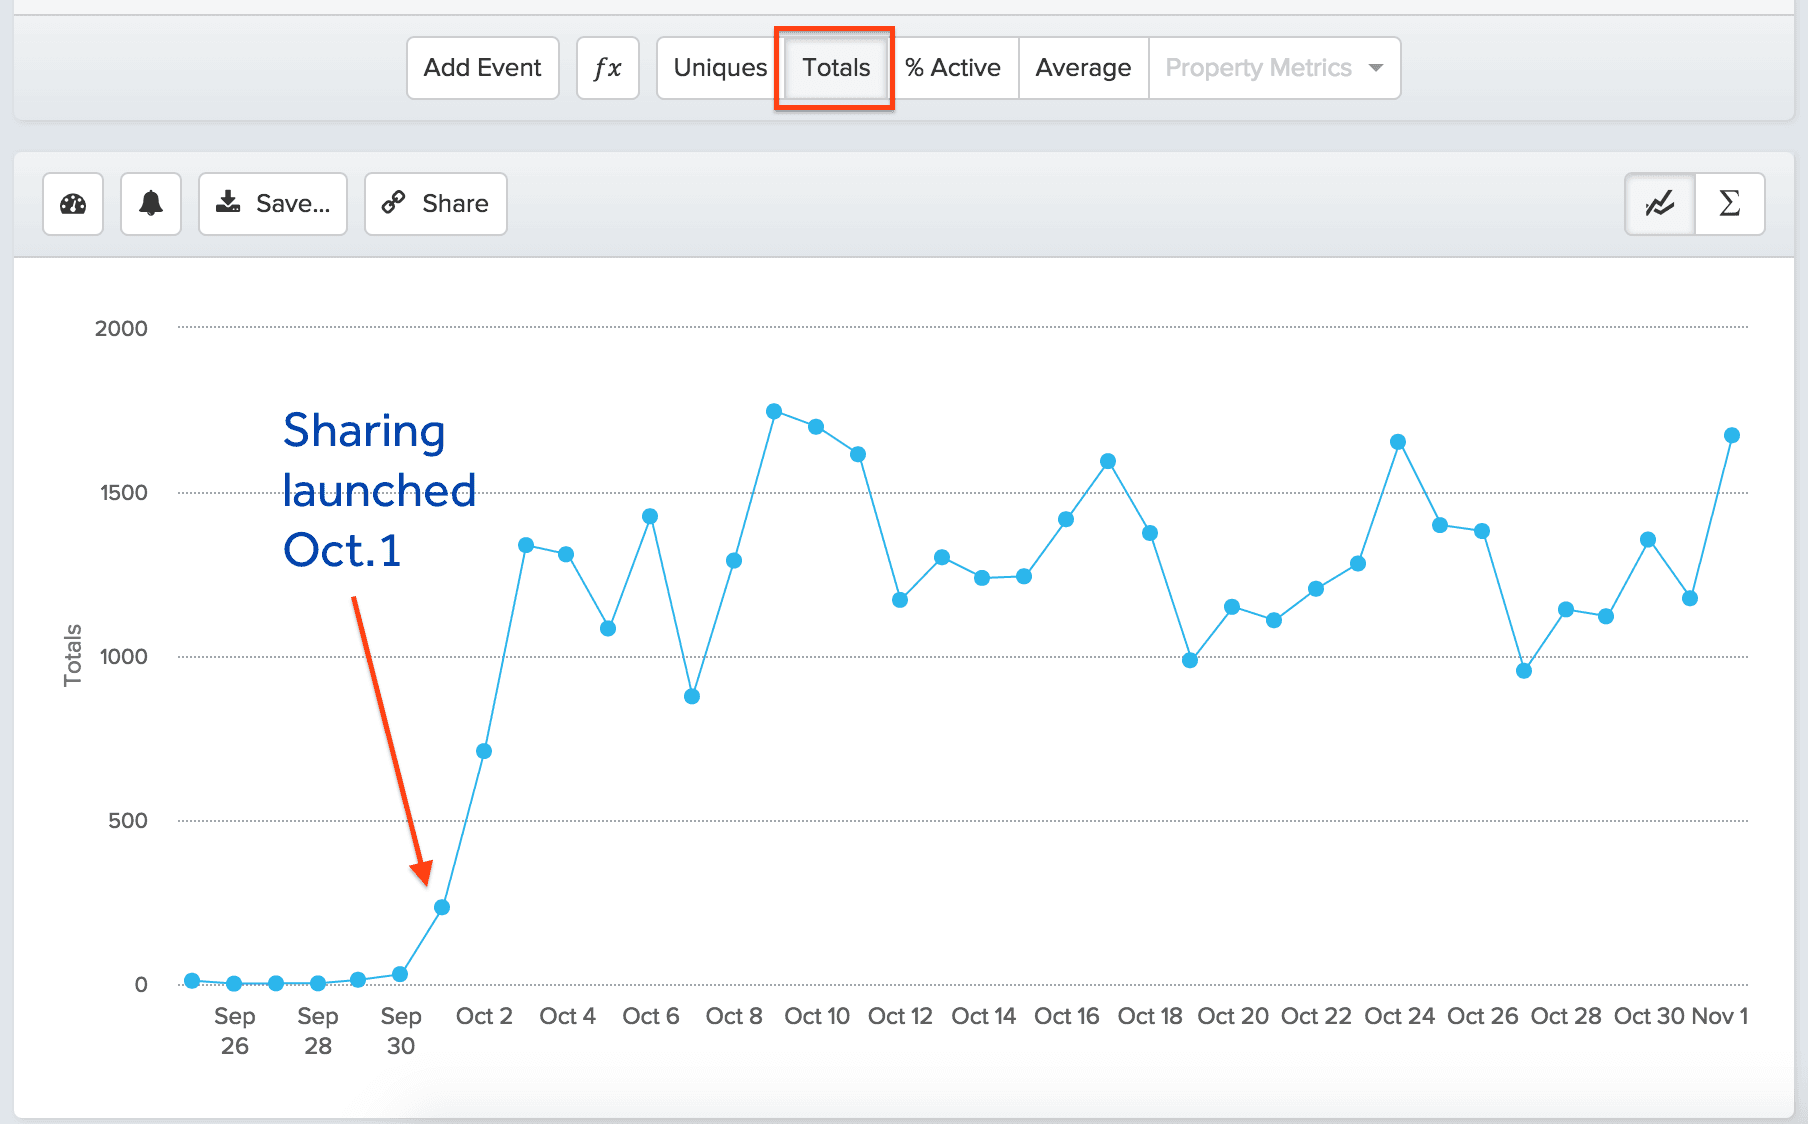
First, you can look at your analytics platform for the total counts of the event ShareMusic.
After your first week of launch, more people started using the new sharing feature, resulting in between 1000-1700 shares per day. But how many unique users are actually using the sharing feature? To figure that out, you look at the number of unique users doing the sharing event:
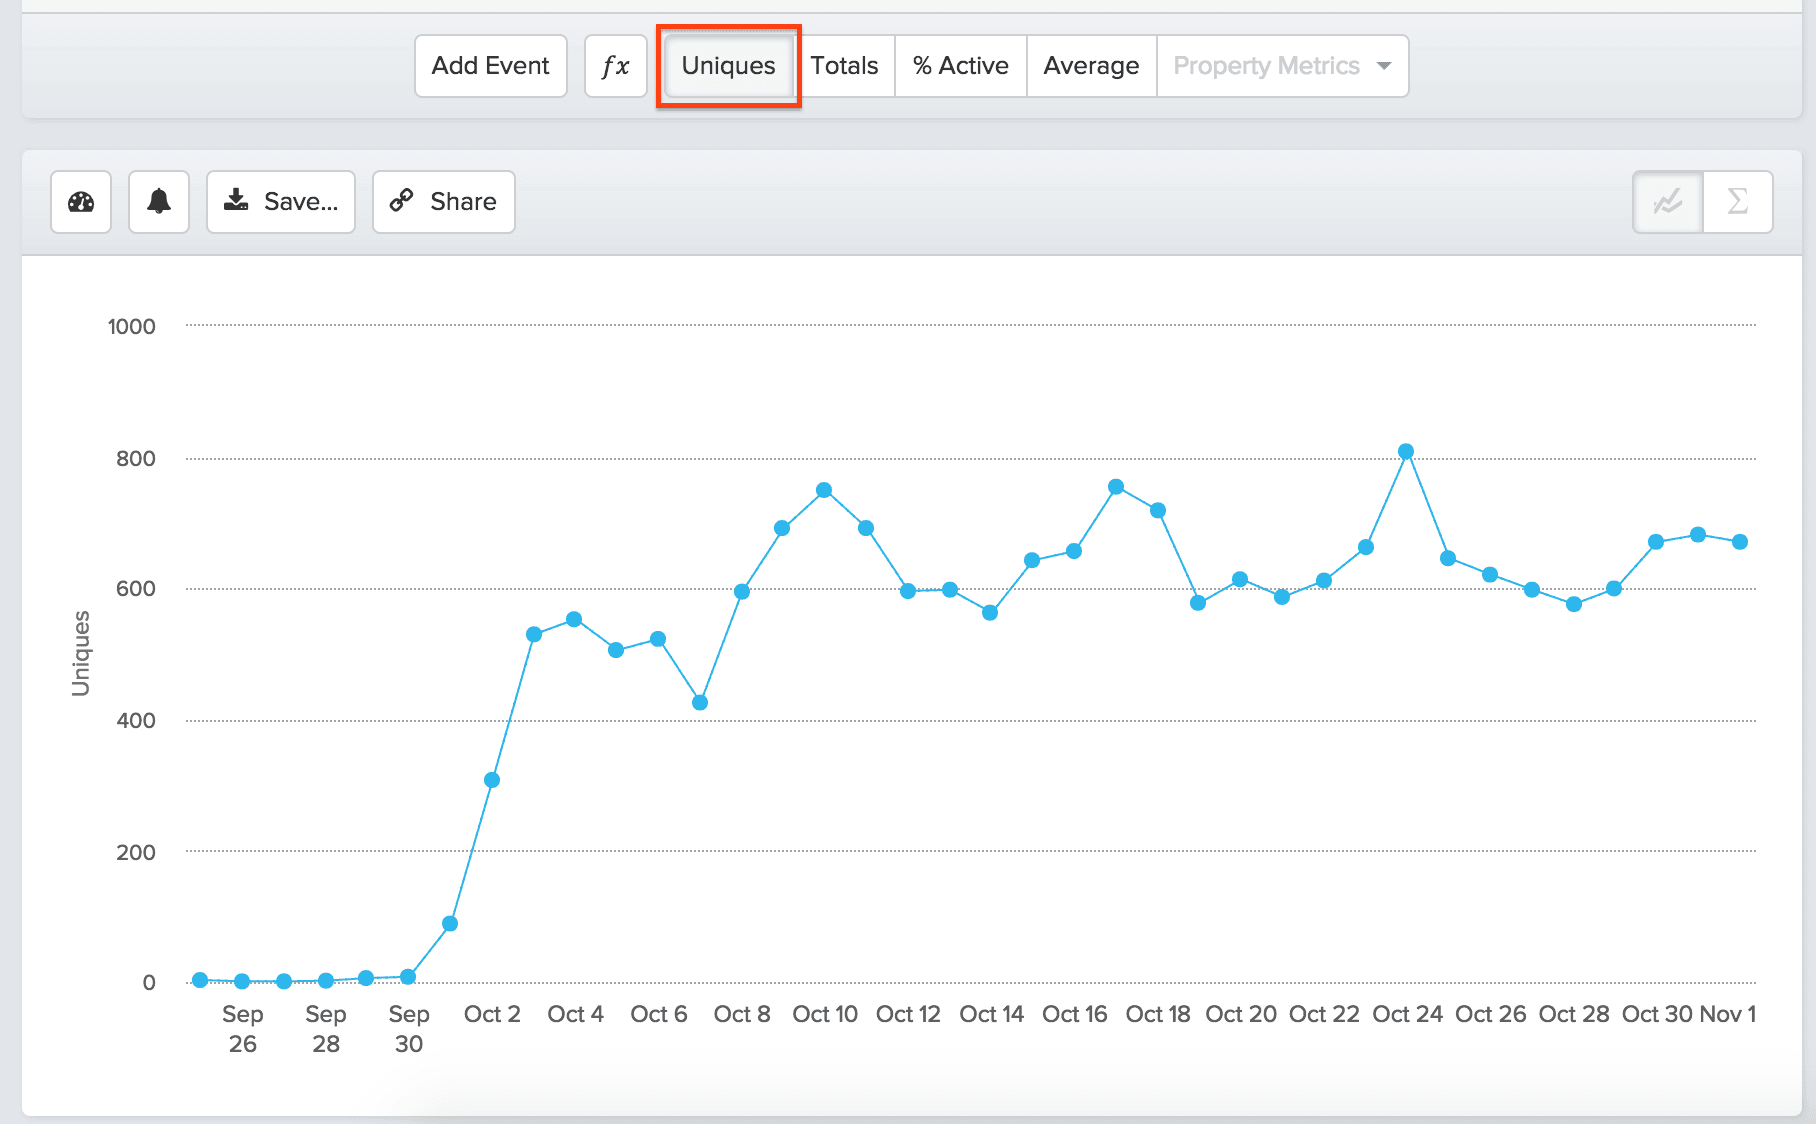
Now you know how many unique users per day are using the sharing feature — what percent of your total daily active users is that? This is really important to check so that you have a sense of how widely the sharing feature is being used.
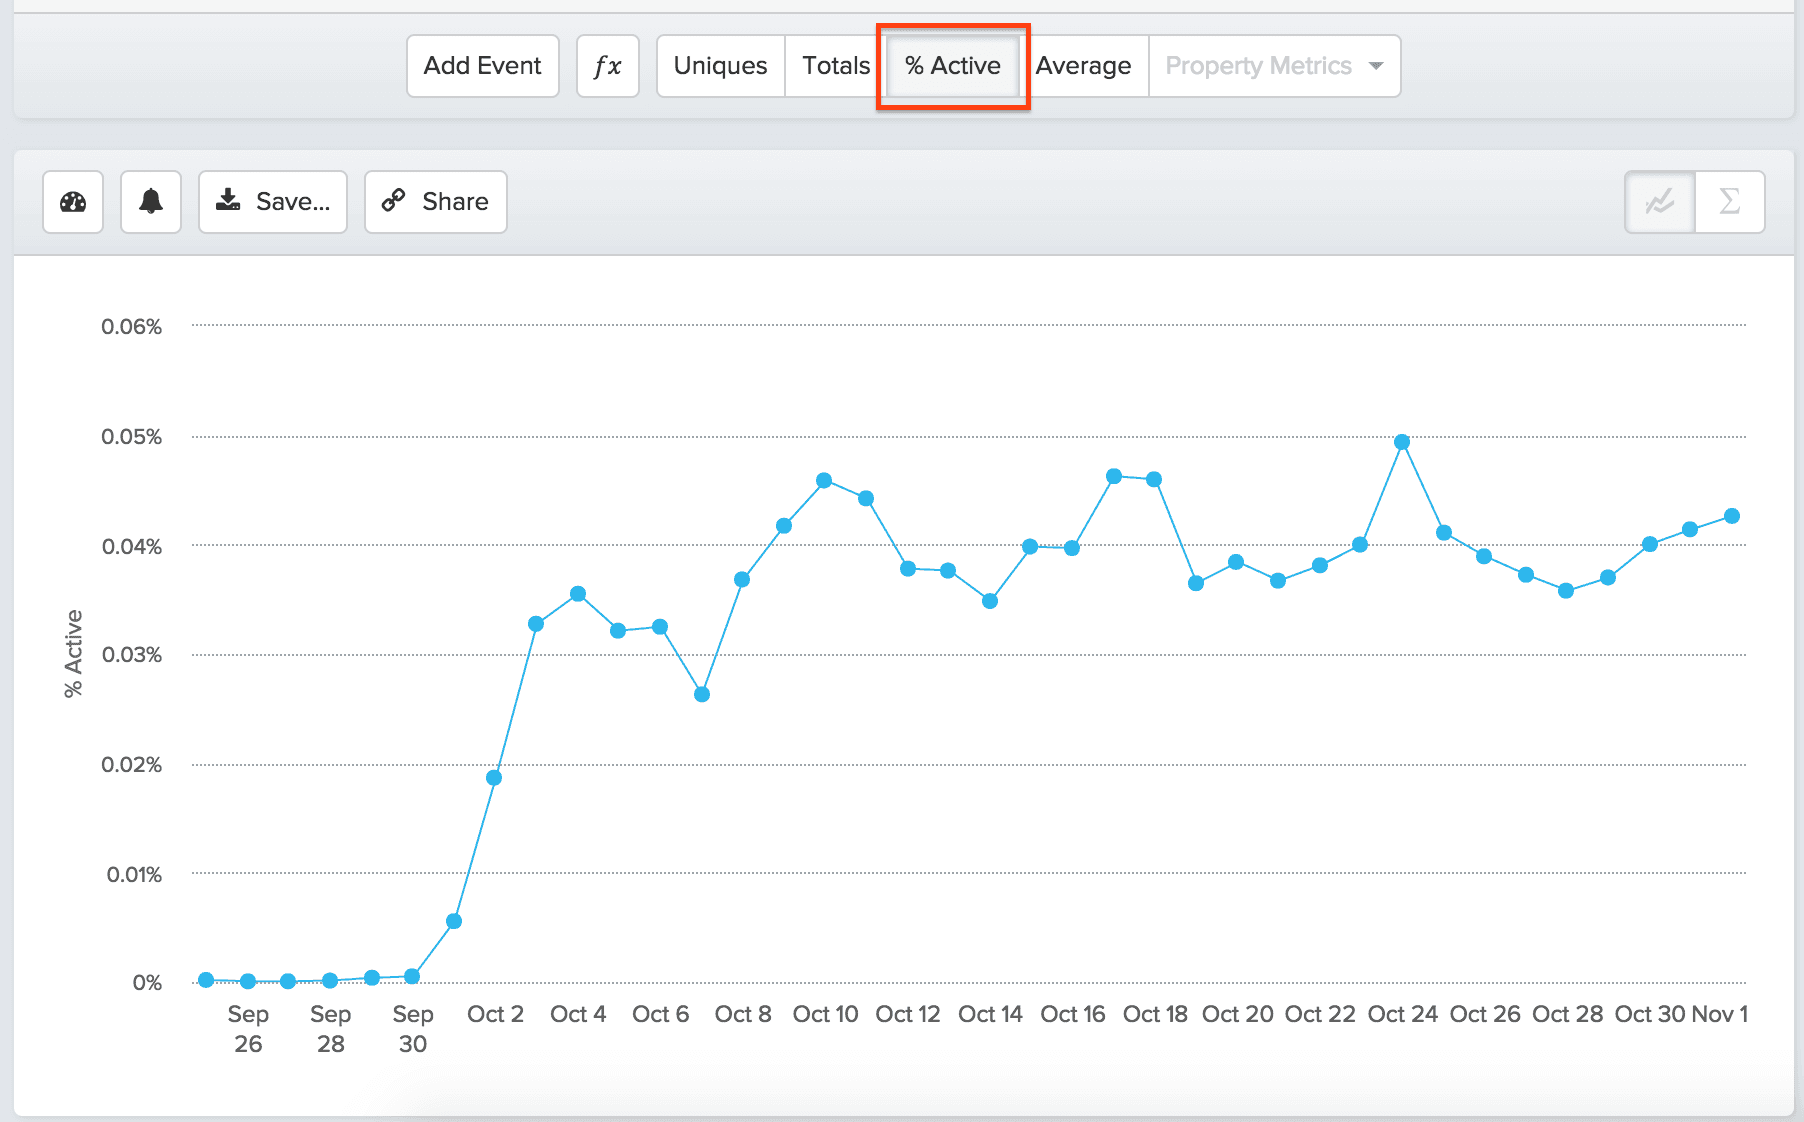
As you can see, only a small percentage, around 0.04% of your daily active users, are utilizing the new feature. It’s smaller than you were hoping, but you know you can learn a lot by digging deeper into these early users of the sharing feature. By learning how these early adopters are sharing music, you can figure out how to improve the sharing experience or expose it more effectively to gain wider usage.
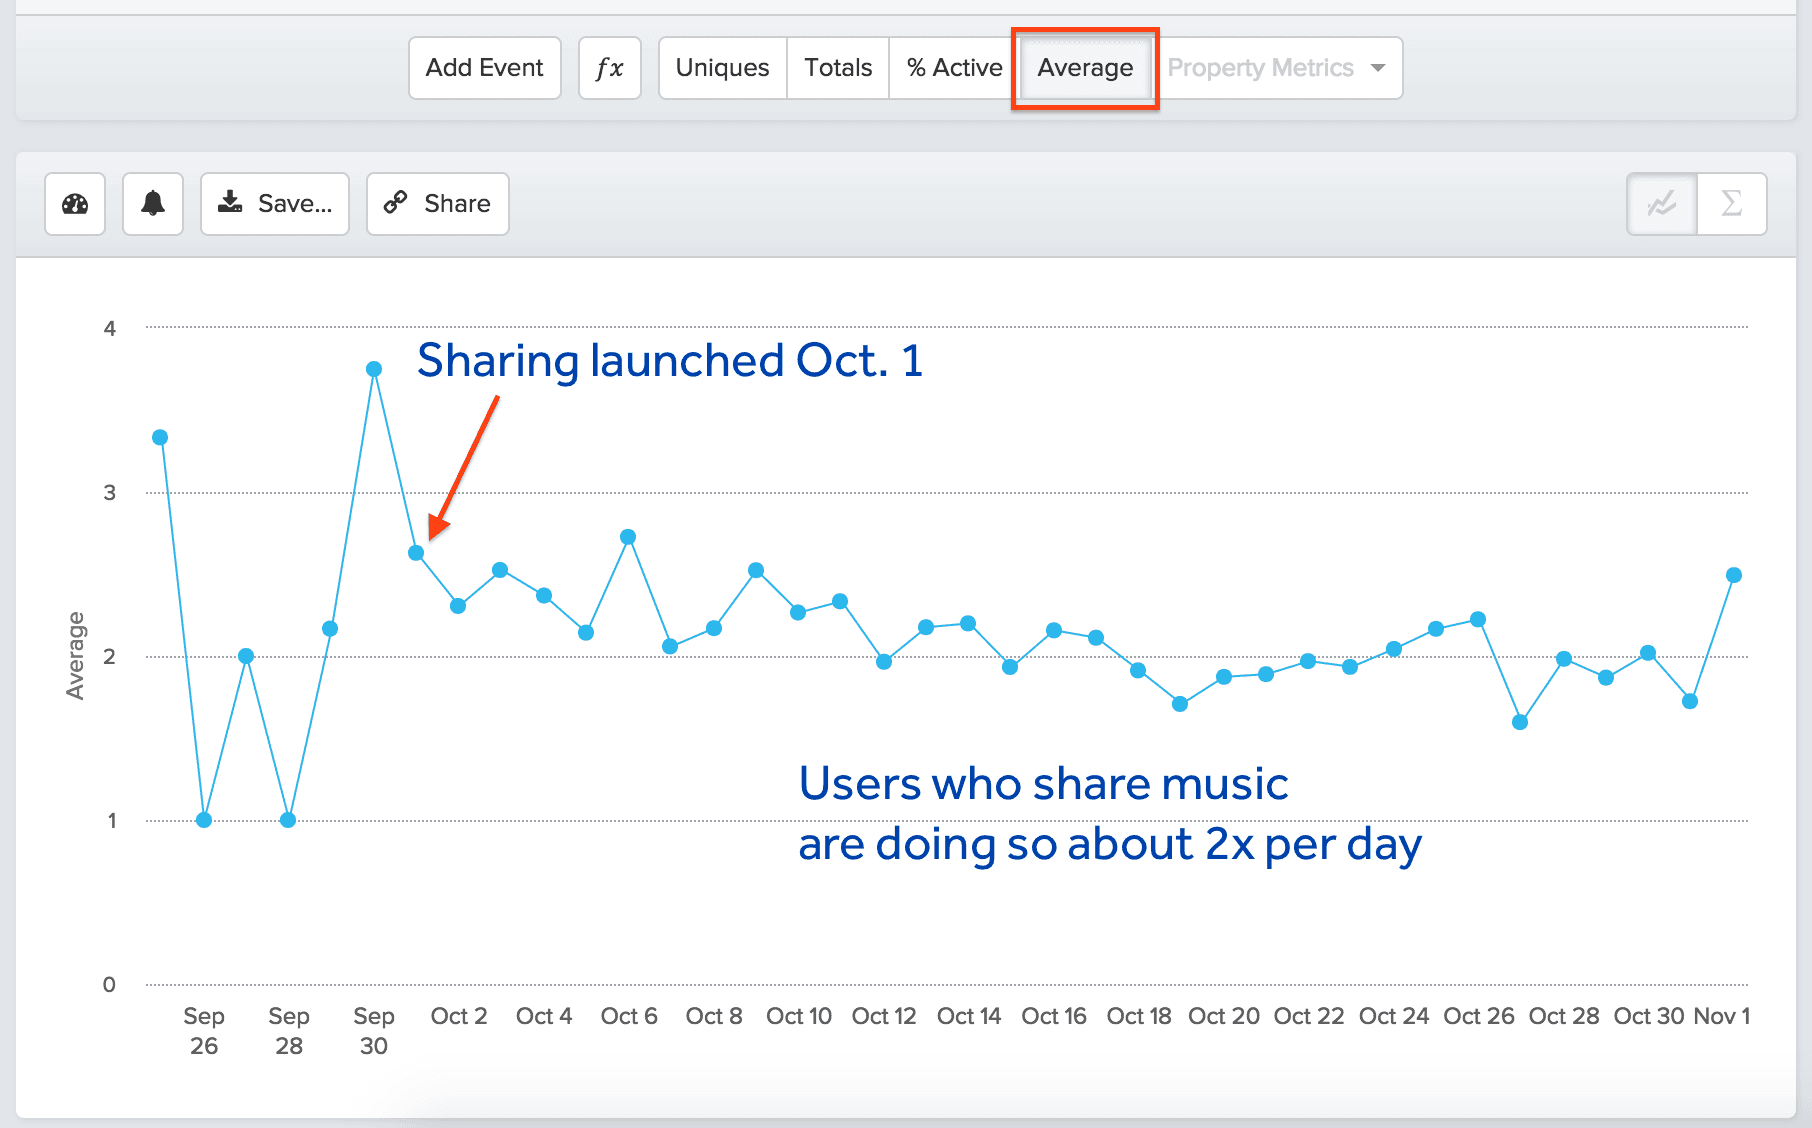
Let’s check the average times per day these users are sharing music:
Step 2: Dig deeper into event properties to look for patterns
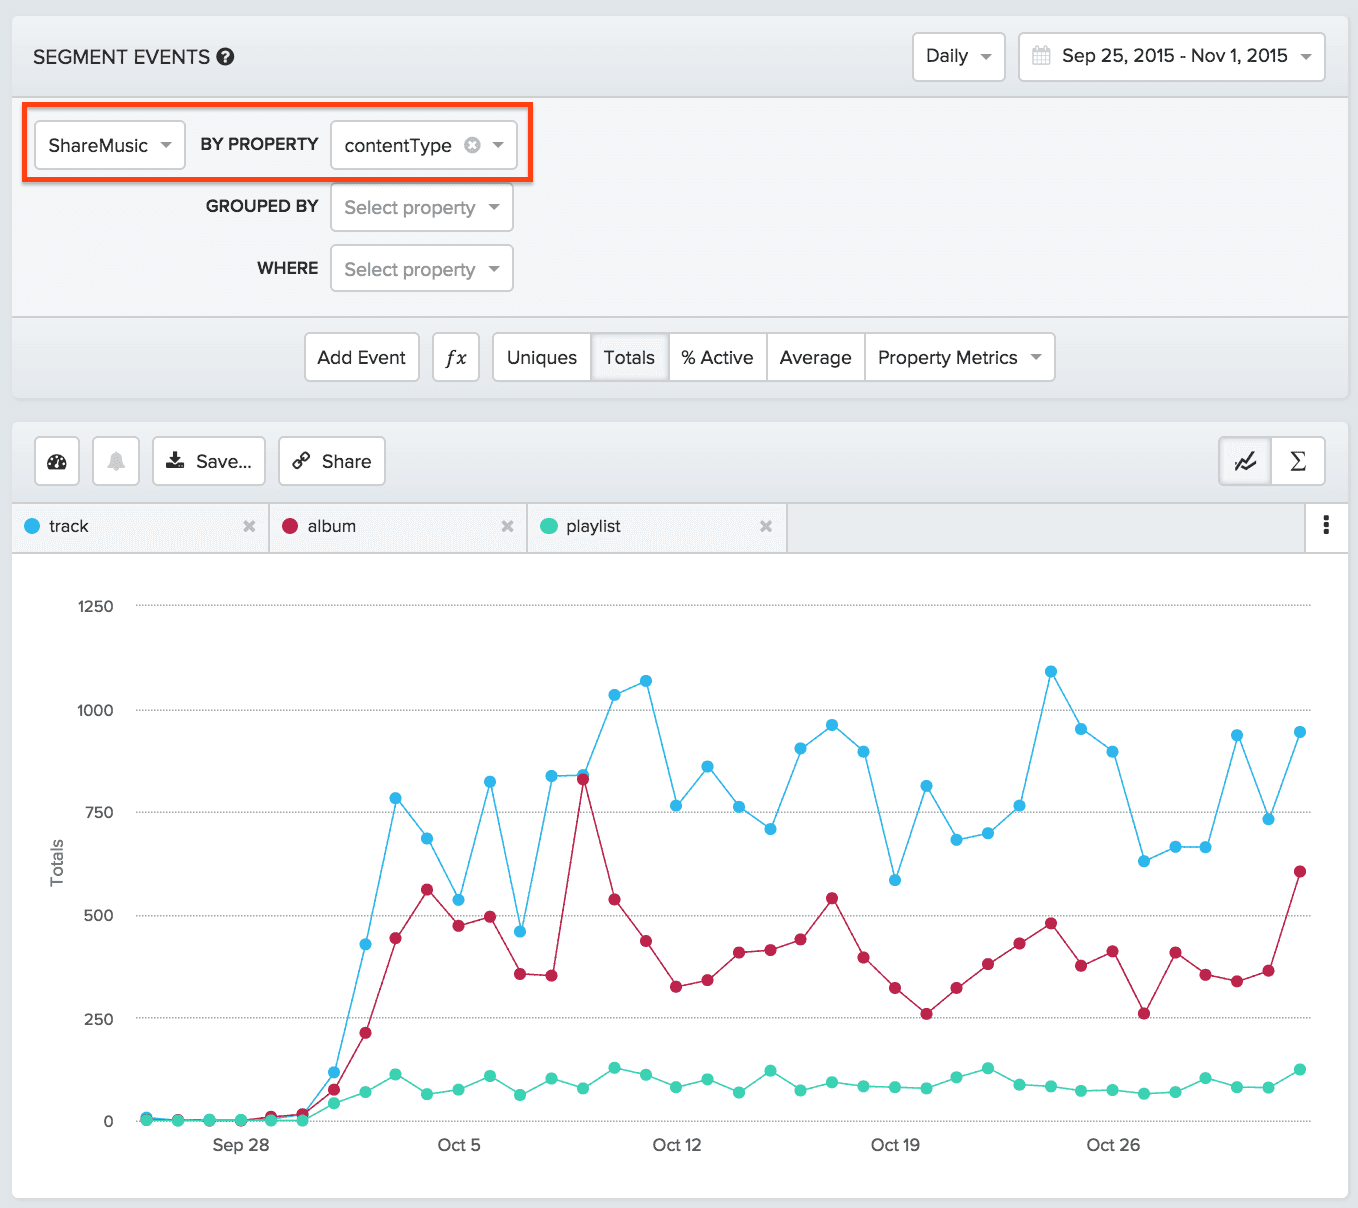
Now it’s time to learn more about how people are using the new sharing feature. In your app, people can share different types of content: either an individual track, a whole album, or a playlist. You’re interested in seeing what type of content your users are sharing.
To investigate, you split the ShareMusic event by content type:
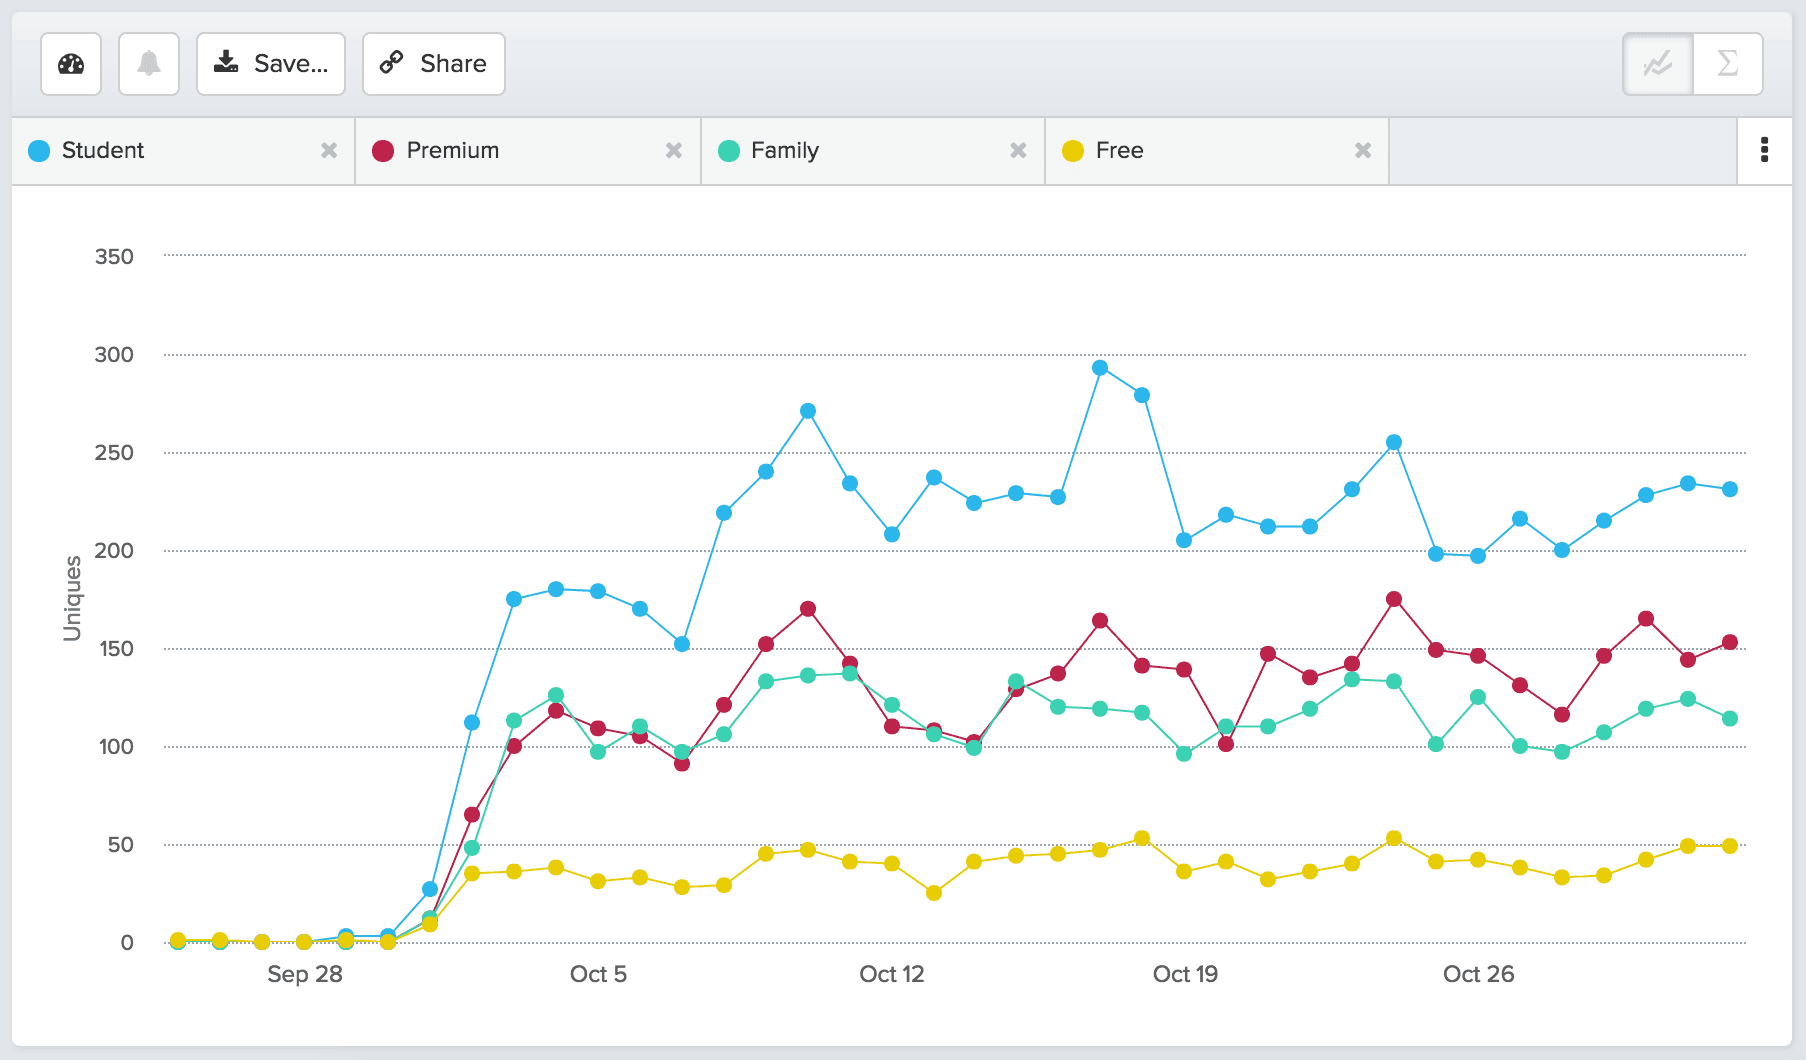
Turns out individual tracks are getting shared the most, followed by albums. Comparatively, not very many playlists are getting shared. Next, you’re interested in what types of users are sharing music. You have a few different subscription plans: Free, Premium, Student, and Family, so you segment the ShareMusic event by plan type:
Interestingly, you see that the largest segment of users sharing music are on the Student plan, which is your special plan for college students. In addition, not many Free users are sharing music at all.
Step 3: Understand what users are doing right before using the feature
It’s helpful to trace the paths that users take in your app before they share music. What are most users doing right before they share? This gives you an idea of the context in which they’re using your new feature. Some analytics platforms, including Amplitude, provide event flows that help you visualize users’ sequences of actions. Below, you can see the actions that users take leading up to ShareMusic:
About 40% of users who ShareMusic play a song and then share music, implying that they listen to a song they like, and immediately share that song with their friends. Also, 30% of users share music right after favoriting a song.
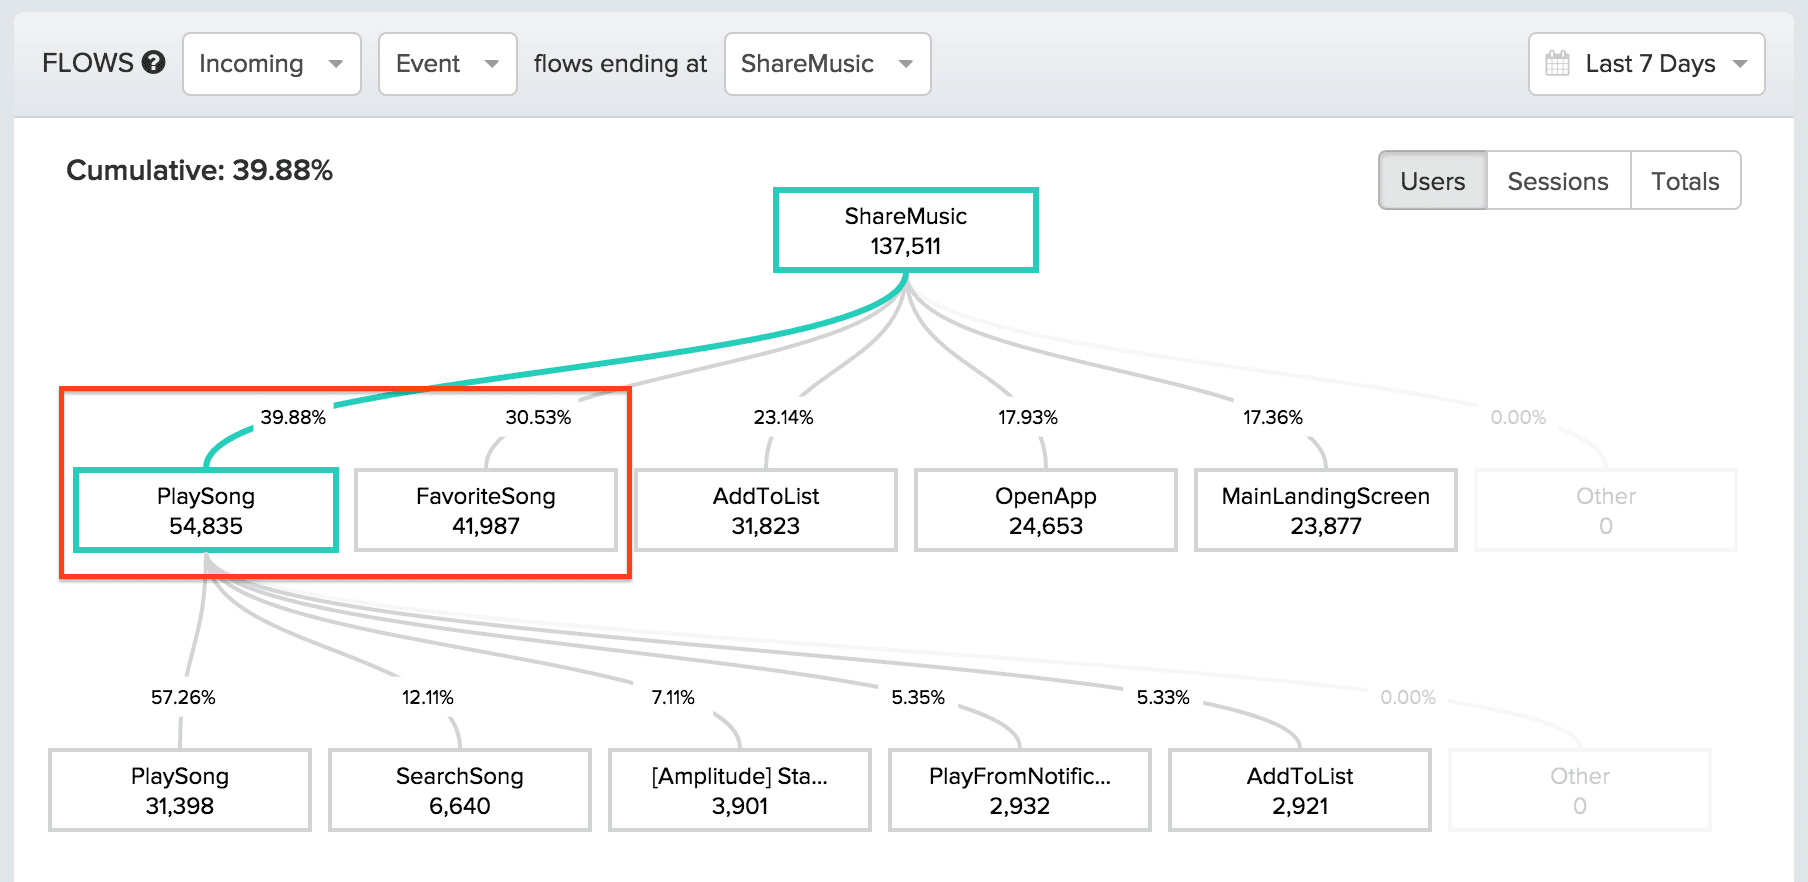
Apply what you’ve learned: So far, you haven’t done too much in your app to encourage people to share music, but this information gives you an idea. If someone is marking a song as a favorite, that’s probably a good time to prompt them share that song with their friends, since they clearly are finding value in that song. You can test whether adding a small in-app prompt right after someone favorites a song saying ‘Share this song with your friends!’ will increase the number of users who share, as well as total shares in your app.
Step 4: Build a behavioral cohort of people who used the feature to analyze how they compare to your overall user population
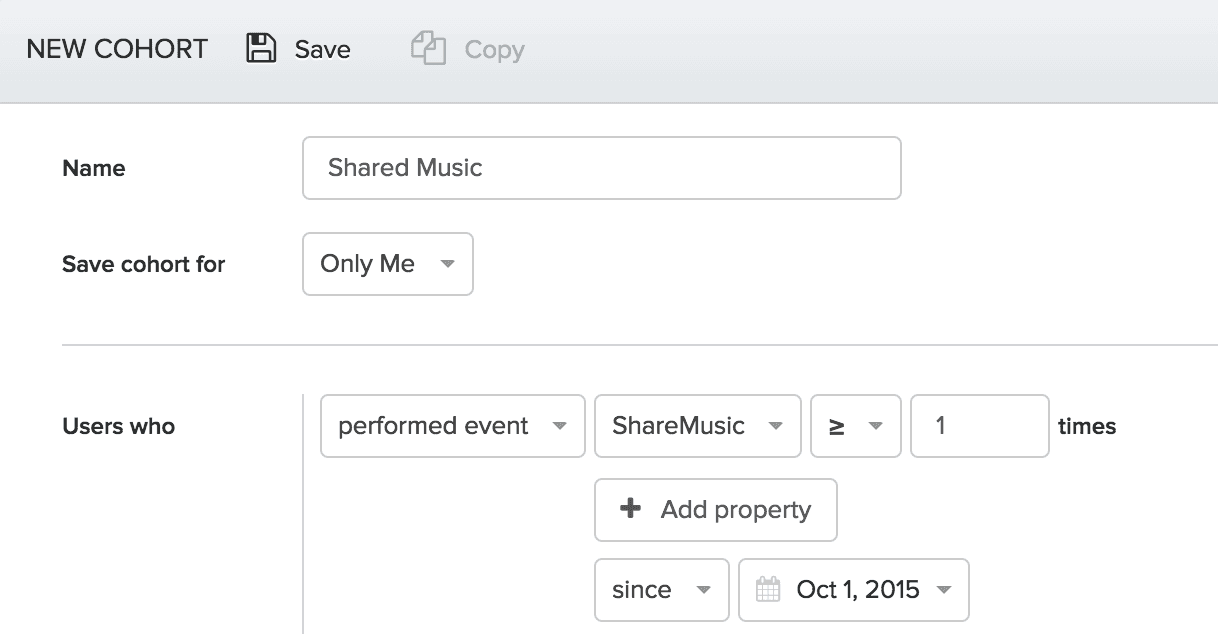
A behavioral cohort is a group of users that is defined based on actions they take in your product (you can read more here and here).
Here’s our cohort of users who have done ShareMusic:
We’ll use this cohort in Steps 5-7 to measure how how users who share music might differ for key metrics like conversion, retention, and engagement.
Step 5: Analyze the impact of the new feature on retention
User retention is critical to the success of any app. The more your app becomes an ingrained habit for your users, the more time you have to upsell them and monetize them.
To measure the impact of sharing on retention, you can compare the retention of the cohort of users who shared music vs. those who did not. One way to do this is to look specifically at new user retention: do new users who share music early in their experience (like their first day), retain better than new users who don’t share music?
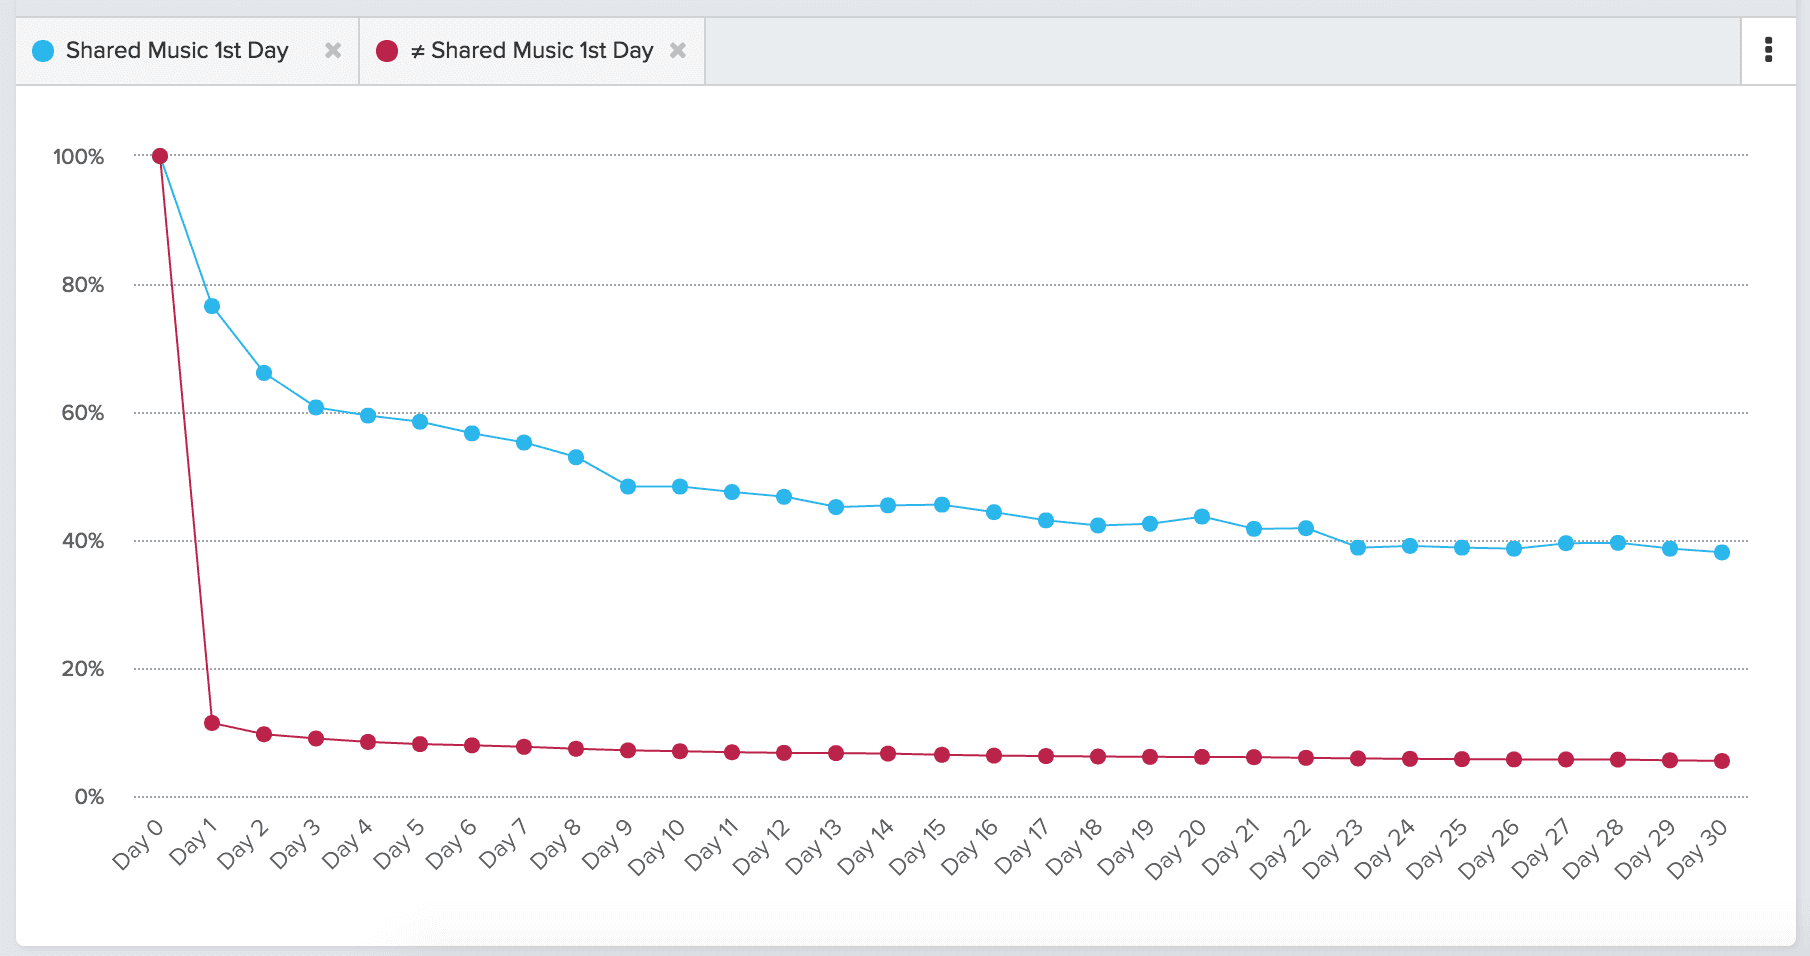
The retention curve above shows that new users who share music on their first day in the app have significantly higher retention by Day 30 than new users who don’t share music. About 40% of people who shared music returned to the app 30 days later, compared to only 5% of non-sharers.
Step 6: Measure the impact of the new feature on your key conversion funnels
It’s fantastic that sharing music correlates with higher retention; does sharing have a similar impact on your company’s revenue?
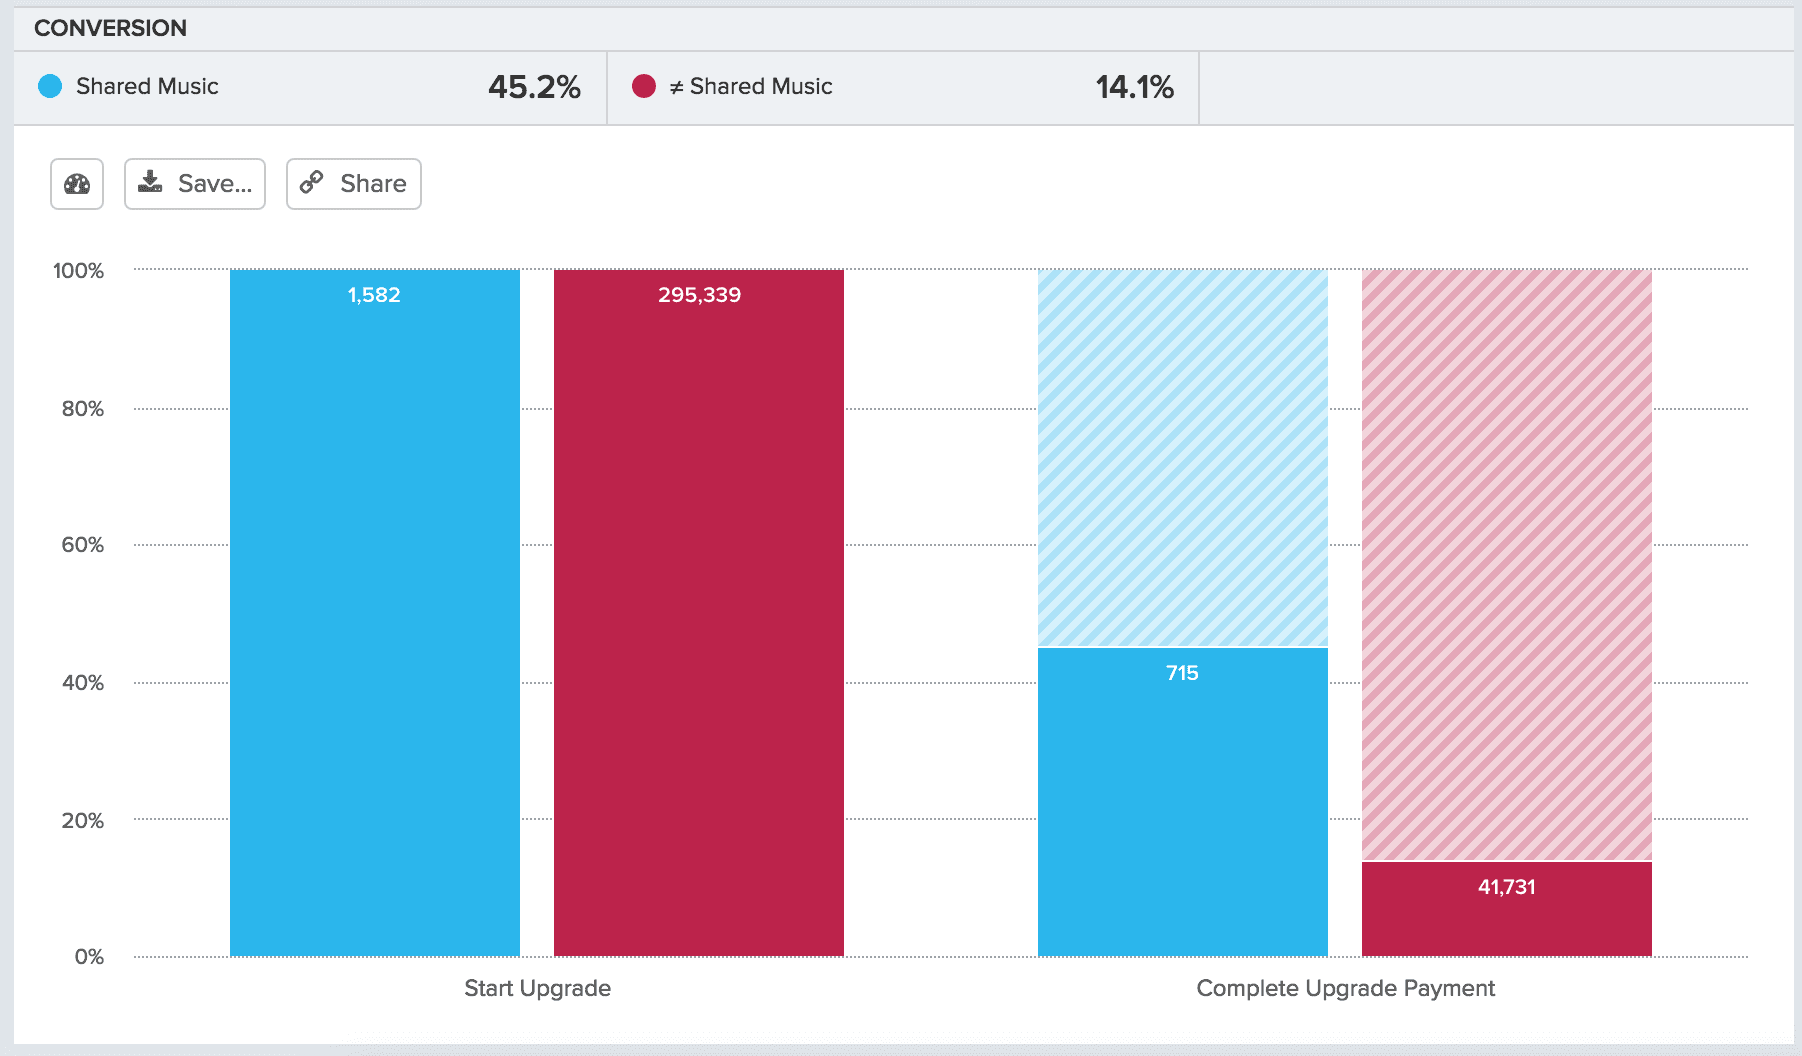
Your app makes money when users purchase a subscription. To measure the impact of sharing music on conversion to a paid subscription, you compare the upgrade funnel for users who share music vs. those who don’t share.
There’s actually a big difference in upgrade completion rate for users who share music: 45.2% conversion compared to 14.1%. This strongly indicates that something about sharing music is showing value to your users, making them more likely to upgrade to a paid subscription.
Step 7: Measure the impact of your new feature on engagement
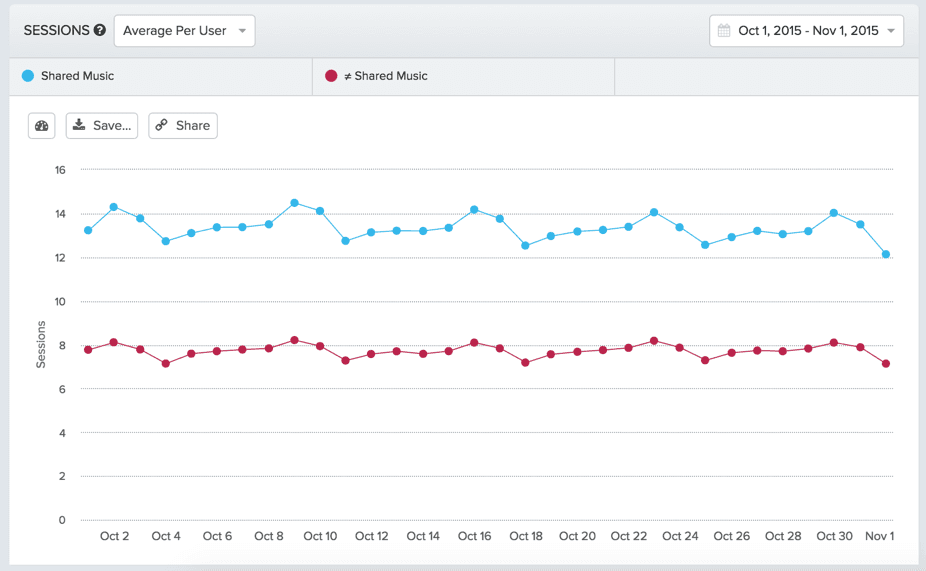
Now that you’ve seen the impact sharing has on conversion and retention, you’re curious whether users who share music are more engaged with your mobile app overall. One way to look at this is the number of sessions each user does per day.
This data seems to indicate that users who share music are more active than those who don’t share music, completing 13 sessions per day on average, compared to 8 sessions for non-sharers.
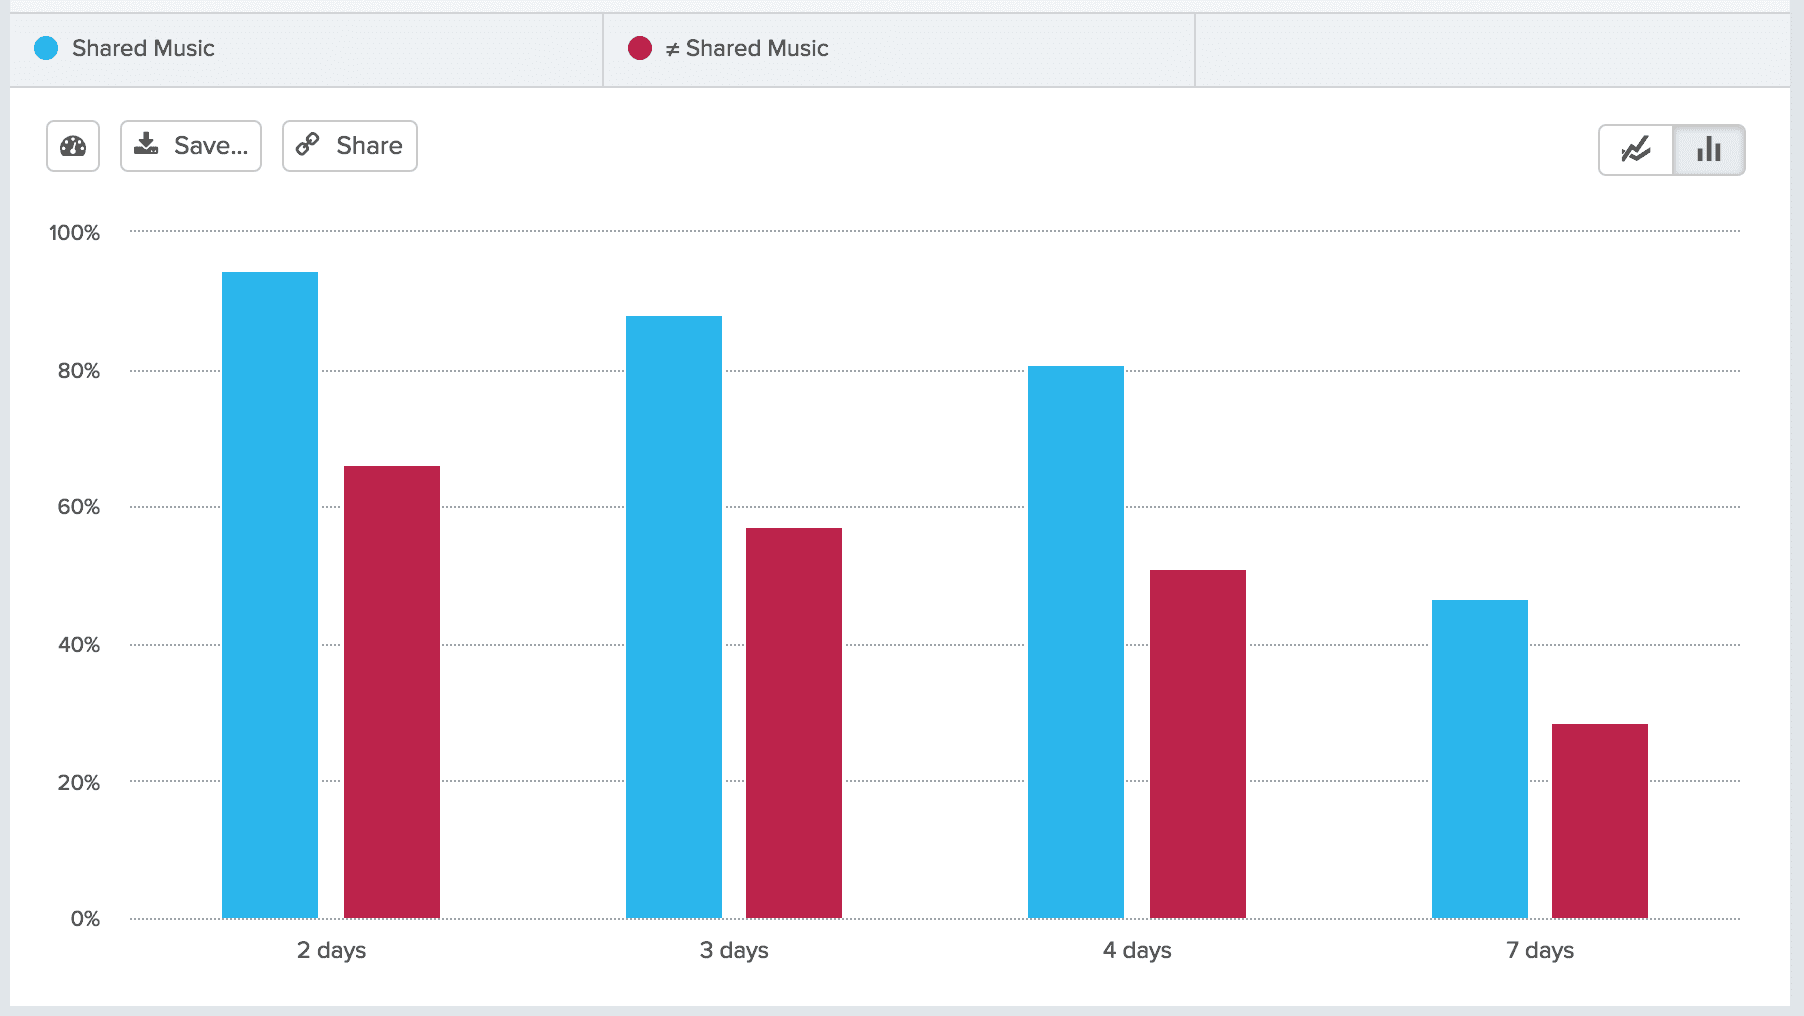
You can also look at the ‘stickiness’ of users who share. We define stickiness as the percentage of users who are active at least n days out of a week.
Users who share music use your app on more days per week. In fact, 45% of sharers use your app every day in a week, compared to 27% of non-sharers.
Next steps: Acting on what you’ve learned
Let’s sum up what you’ve learned so far:
- Only about 0.05% of your daily active users are currently sharing music
- Individual tracks are getting shared the most, more than albums and playlists
- Directly before sharing music, 40% of users who share play a song, while 30% favorite a song.
- Users who share music have significantly higher conversion rate to a paid plan.
- Users who share music have higher retention than those who do not share.
- Users who share music are more active on your app overall, with more sessions per day and higher stickiness.
Remember: you don’t have causation yet
Based on those insights, your new sharing feature seems to have a significant positive impact on all of your key metrics. Of course, we can’t derive direct causation from this data.
However, it’s possible that your power users, who already have much higher engagement and retention than the rest of your users, are also the early adopters of your sharing feature, in which case encouraging other users to share music may not be very impactful.
You should look at historical behavior of your ‘Shared Music’ cohort to see whether those users already had higher retention and conversion before you released the feature on October 1. In addition, you can test whether encouraging other users to share music has a positive effect on your metrics, which brings us to:
Test, measure, repeat
The next step is run experiments on the sharing feature. Will encouraging more users to share music increase your retention and conversion KPIs? You might decide to include an in-app prompt to share music right after a user favorites a song, like we suggested in Step 4. Maybe you’ll encourage all new users to share music during their onboarding flow.
The opportunities are endless, so it’s time to brainstorm, prioritize based on what you think will have the biggest impact, and measure which tests have the biggest impact on your core metrics.

Varun Sharma
Former Head of Strategic Customer Success, Amplitude
Varun Sharma is the former Head of Strategic Customer Success at Amplitude, where he is responsible for customer success and product operations for enterprise clients.
More from Varun


