New: Team Sharing and Custom Dashboards in Amplitude
These features allow you to better share and organize data with the appropriate members of your team.
We’re happy to announce that we recently release a couple of frequently-requested features: team sharing and custom dashboards. These features allow you to better share and organize data with the appropriate members of your team.
Team Sharing
Creating teams allows you to make groups like Engineering, Marketing, and Sales.
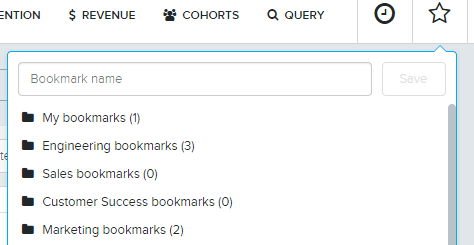
Once you create a team on your organization’s Settings page, you will see it appear in the Bookmarks and Custom Dashboards drop-downs. This allows you to save a report or graph into a particular team bookmarks folder or to add it to a team’s custom dashboard. Dashboards and bookmarks saved in a team folder can only be viewed by users in that team.

Different teams can have their own custom dashboards.
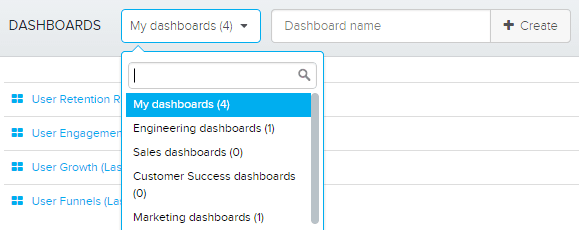
You can save bookmarks into specific team folders for team viewing, as well as save bookmarks into your own personal folder.
Custom Dashboards
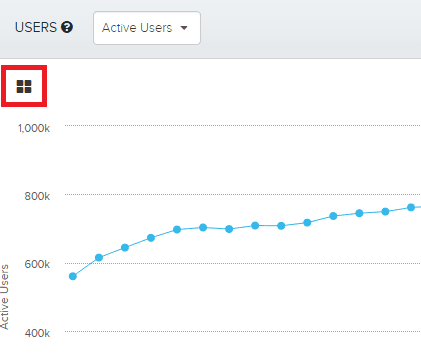
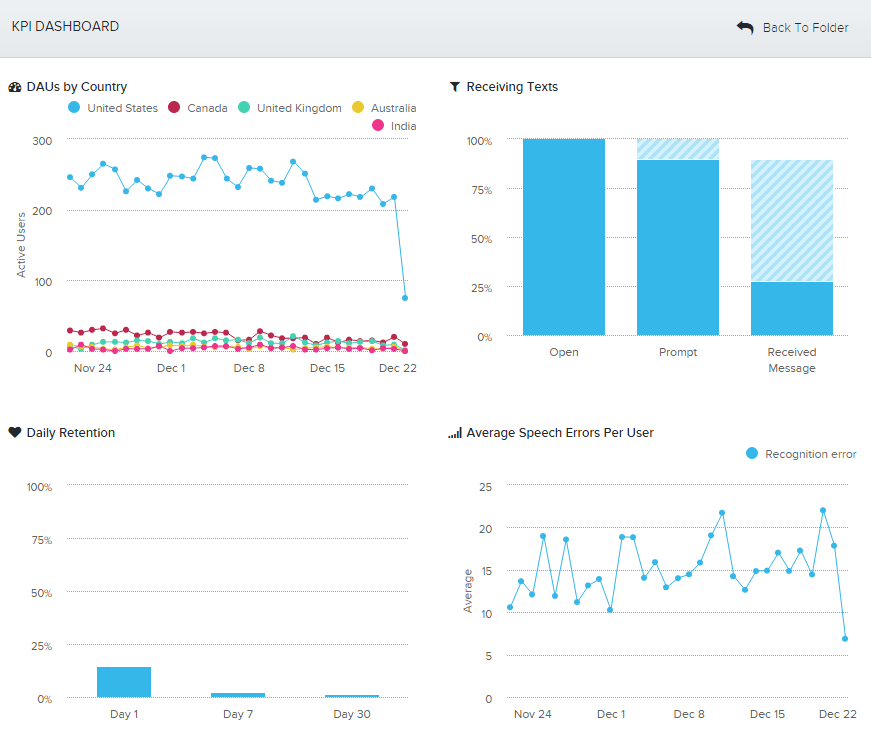
Our new dashboards feature lets you create custom dashboards containing graphs and metrics that you want to reference often. You can share these dashboards with other members on your team. To add a graph to a dashboard, just click on the dashboard icon in the top left corner of the graph.
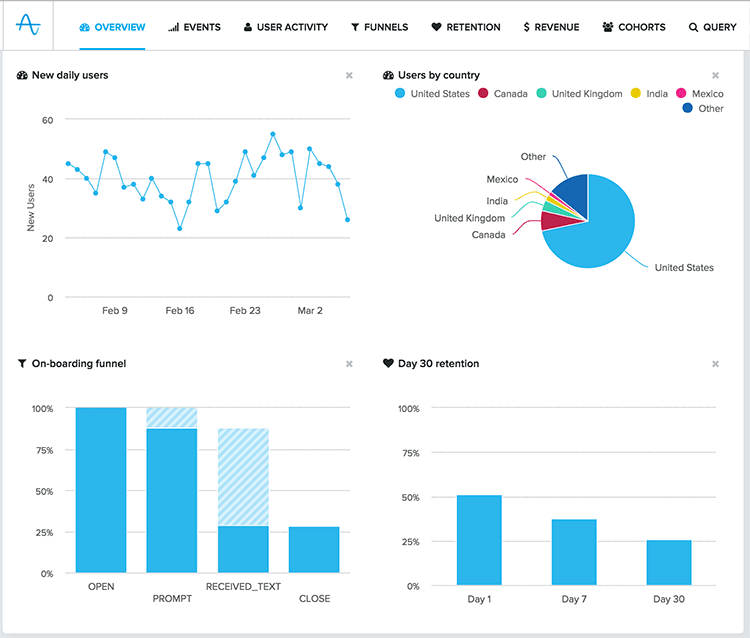
Your custom dashboards can be found in the ‘Overview’ tab of Amplitude.

There, you will see your own personal dashboards as well as dashboards for any team you’re a part of.
We hope these features help you organize and share your Amplitude data more efficiently and make relevant graphs more accessible to everyone on your team. As always, feedback is welcome!

Alan Ibrahim
Former Director of Customer Success, Amplitude
Alan is Amplitude's former Director of Customer Success, where he lead our North American Success team. As Amplitude's first employee, he built out our Customer Success function from scratch!
More from Alan
