The Product Outcomes Formula
How to build a healthy, empowered, cross-functional team with fewer silos, a bit more overlap, and agency at the core.

In this post I’d like to share a very simple model for thinking about “using data” and product outcomes. To be a successful product team, you must understand the following domains:
Product development involves wearing lots of hats (and this is a partial list). In smaller companies, you have people wearing many hats. In larger companies, you tend to see the hats distributed across more people and teams.
Let’s visualize these hats as a loop of sorts.
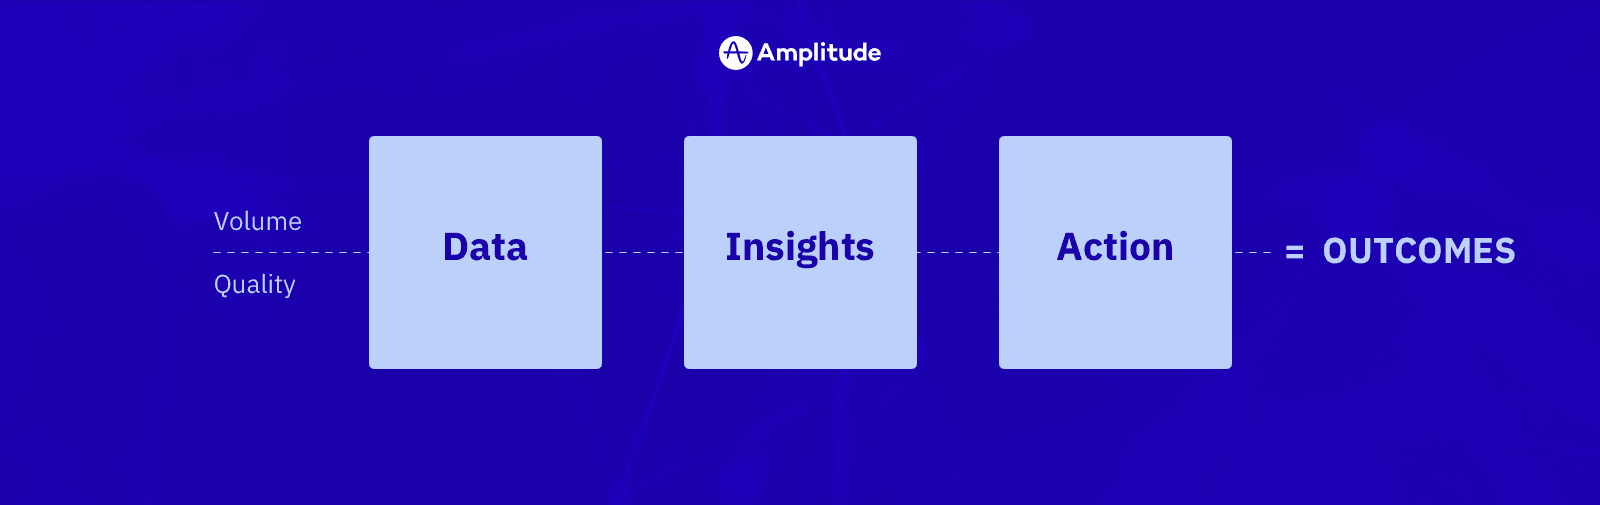
The customer/user throws off data. We have to collect that data and make it usable. Then come insights. Which inform our design and engineering efforts (collaborative produce development). We release experiments back “across the line” to customers. Smack dab in the middle we have product-led growth.
Let’s go a bit higher level.
We have the three pairs of levers, each with a quantity or rate component, and a quality component (six total):
- Quantity of data we collect, and our ability to make that data usable
- Rate of insights and the quality of those insights
- Rate of action and the quality of that action
There’s a symmetry here you almost certainly notice: volume and quality. Qualitative data fits nicely into this model as well (qualitative data literacy is a thing).
Why is this helpful? This simple model might help your team figure out your current impediment and a course of action.
- Data. No amount of data will help if your data is unusable. Some companies are swimming in data, but no one can make any sense of it, or use it. Conversely, you can have pristine data, but if there are gaps in what you collect, you’ll be unable to generate insights.
- Insights. No level of insights quality will help, if it takes forever to generate and share those insights. Neither will a firehose of low-quality insights.
- Action. High velocity is useless if your decisions — the quality of action — is lacking. And so is the perfect decision that never ships.
Where is your team currently struggling? Where are things going well? Don’t just consider quantitative data. Another useful activity…brainstorm with your team the things that improve all six levers. For example, high psychological safety positively impacts the quality of insights, rate of insights, quality of action, and rate of action.
PS. If a mathematician wants to convert this into an actual formula, please send it my way!
When I chat through this model with teams, what we often discover is as follows. Take a startup where most of these hats sit with one team. You’ll see something like this:
That works when the company is small. Data, insights, and action fall to a small group of people who wear lots of hats.
But what happens when you scale?
In big companies you often see very rigid boundaries between the parts:
The specialization may seem beneficial on the surface, but we start to see issues using our data, insights, action model. That specialized analytics team may have issues with “rate of insights” (quality is no problem, though). The feature factory is distanced from the impact of their work (quality of action). The data collection team has no customer domain awareness (data usability).
The happy balance is often something that looks like this:
Fewer silos. A bit more overlap. And a healthy, empowered, cross-functional team with agency at the core of the system.
Hope this simple model and the team overlays helps.

John Cutler
Former Product Evangelist, Amplitude
John Cutler is a former product evangelist and coach at Amplitude.
More from John


