

If you’re reading this, you’re probably familiar with , which involves setting up a pre-determined sequence of events and then tracking conversion rates at each step. Funnels are incredibly useful for identifying problem areas in your product and showing you where to investigate further.
Unfortunately, the funnel tools in most analytics platforms stop there: you can see that you have a problem (users are dropping out of your funnel before completing the desired last step), but that doesn’t help you figure out how to fix it. Why aren’t users converting? What differentiates users who complete the funnel and those who drop out after a couple steps? You can identify the issue, but you can’t dig deeper to find out why.
, which is why we’re addressing the shortcomings of standard funnel charts so that you can actually identify ways to improve your funnel conversion rates.
Keep reading to learn how to:
- identify key events and set up a funnel
- uncover actionable information from funnel results
- take action to improve your funnel conversion rates and drive growth
Step 1: How to Identify Funnel Events
Funnels track the flow of users along a critical path in your product. Each funnel step is a distinct action that a user can take on your platform along a flow that you want to analyze.
For example, if you were measuring an onboarding funnel, you may track the following events:

If you were an e-commerce platform and wanted to track a purchase funnel, you may track the following sequence of events:

These examples work great if you already know the paths users take, but it is impossible to know every possible navigation route within your platform. Users often don’t do exactly what we expect them to. What if you are missing important sequences of user behavior that fall outside of the pre-defined paths you’ve created?
One way to solve this problem is by manual analysis. If you have all of your events stored in a database, then you or someone on your team can use SQL to create a report that outlines the paths that users are taking through your product. For example, Mode has a and visualization for this use case. Unfortunately, this method requires having significant technical resources in place and is time-consuming — it could take several hours to set up and run. This would be okay for a one-off query, but if you want to run this over and over again for different events and see how flows change over time, it’s definitely less than ideal.
On the other hand, some analytics tools offer features that can show you user paths out of the box: Google Analytic’s and Flurry’s are two examples. Both of these provide default views of what users do when they enter your site or application, but don’t allow much flexibility for choosing different starting events. They also only show flows in the outgoing direction, meaning that you can see what people do after a certain event, but you can’t choose an event and see all of the actions that lead up to it.
We built our feature to help you discover user navigation routes without any extra work on your end. Flows show you the most common paths of events after a chosen start action, or before a chosen end action. The former is called an Outgoing Flow and the latter is called an Incoming Flow. You can also easily segment flows by different user properties like location, platform, app version, etc.
Let’s say you have a music streaming app with a social component. We’ll walk through an example of how to use advanced funnel analysis to discover new insights and drive your growth goals.
Let’s say that the action of adding friends is important for your music app — you’ve found that users who perform the event ‘AddFriend’ are likely to be highly retained (an insight that you can quickly find using the !). As a result, your team has decided to focus on getting users to add more friends.
The next step is to understand different paths users take to add friends so that you can encourage that behavior. In order to understand what actions users are doing immediately before they did ‘AddFriend’, we analyze the following incoming flow:
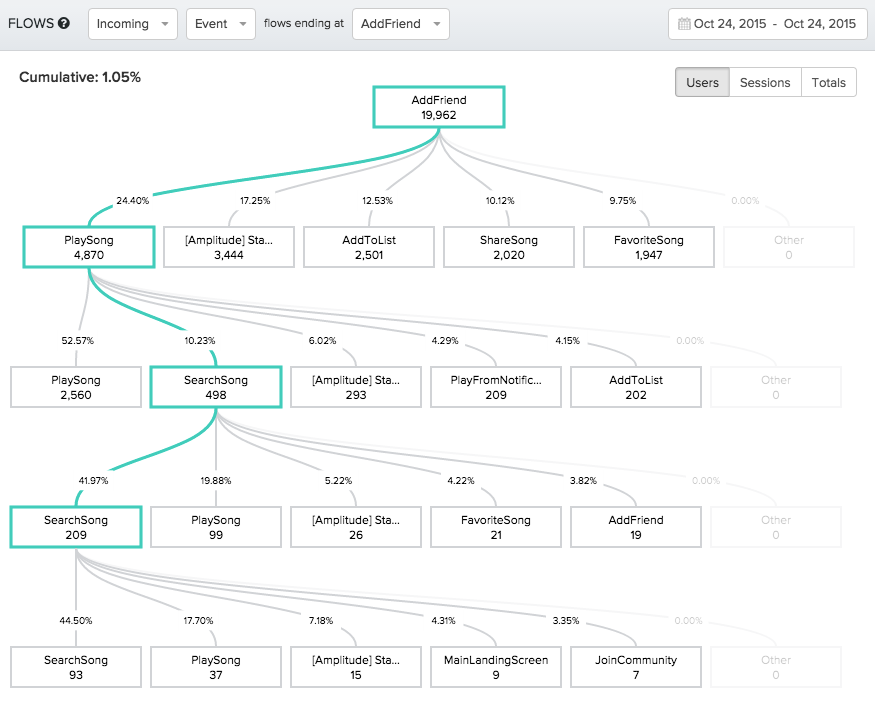
The graph shows us that ‘PlaySong’ is the most common event performed immediately before doing the event ‘AddFriend’: 24.4% of users who add a friend play a song right before. Let’s assume that the other events that precede ‘AddFriend’ (‘StartSession’, ’AddToList’, ‘ShareSong’) are not surprising except the last one: we did not expect ‘FavoriteSong’ to be one of the top 5 events immediately preceding ‘AddFriend’. We should investigate this further!
Next, we flip the analysis. What are some events users are doing immediately after they add a friend? To answer this question, we build an outgoing flow:
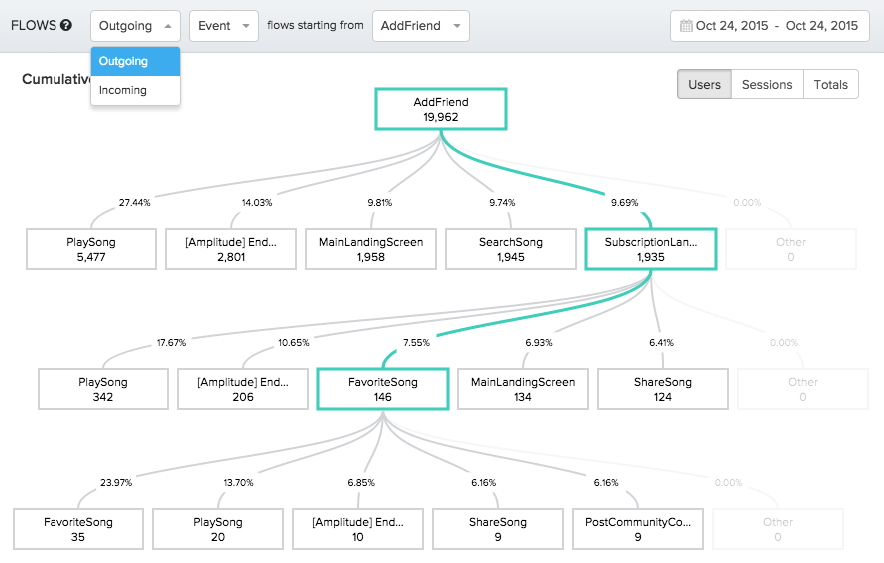
Surprisingly, almost 10% of users go back to the ‘SubscriptionLandingScreen’ event immediately after adding a new friend. We also see that ‘FavoriteSong’ is one of the top 3 events for users who go through ‘AddFriend’→ ‘SubscriptionLandingScreen’. Clearly, there is a fraction of users using our app contrary to the flow we expected.
It is intriguing that playing a song, favoriting a song, and adding a friend seem to be happening so close to each other, since they are parts of different overall user flows for our app. Remember, your team’s focus is finding ways to encourage users to add more friends. The results of these event flows raises an interesting question: can we get more users to add friends if we can get them to play or favorite more songs?
Now we know which events to analyze in our funnel.
Step 2: Set up your Funnel
While setting up the funnel, there are two important questions we need to ask ourselves.
Question 1: Loose Mode or Strict Mode?
Do we care about the sequence of events for our funnel, or just the fact that someone did all the events within a specified time frame? We think of funnels in two modes: Loose Mode and Strict Mode.
In Loose Mode, the user is still counted as converted even if they did not follow the exact sequence of events in the funnel (this only applies to same-day funnel events – for events on different days, the sequence still matters). We can set our conversion window of the funnel in Loose Mode to be anywhere from 1 day to 90 days.
In Strict Mode, users have to follow the exact sequence of events to be counted as converted. We can also go down to a funnel conversion window of 2 seconds in Strict Mode!
Amplitude gives you both of these options for computing funnels, which you can .
Question 2: What’s the conversion window for the funnel?
A funnel’s is the amount of time that is allowed for a user to complete the entire funnel to be counted as ‘converted’. To choose an appropriate conversion window, we need a good understanding of your product. Based on our knowledge of the app and the flow of events we want to analyze, we can select a conversion window for the funnel to be anywhere between 2 seconds to 90 days.
Let’s say we have been sending push notifications to certain users encouraging them to play songs. However, now that we know that a lot of people do ‘PlaySong’, ‘FavoriteSong’ and ‘AddFriend’ close to each other, we want to understand whether sending push notifications that encourage users to play songs makes those users more likely to also add more friends. If yes, then that would be a great insight and a validation that push notifications are having a complementary effect on other major KPIs in addition to more songs being played.
Building the Funnel
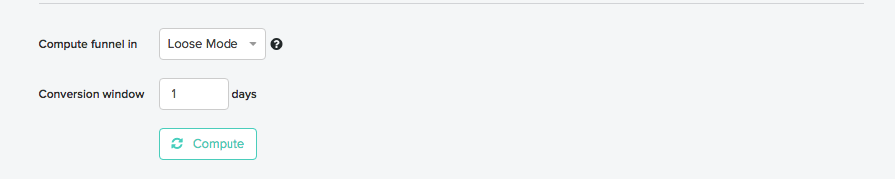
For our first funnel, we’ll compute it in Loose Mode. We are unsure if more people add friends or favorite songs first, and we want to capture both set of users to get a high level understanding of whether we have a cluster of users who do these 4 events together. In other words, for the first funnel, we just want to get a sense of whether this hypothesis is worth further looking into or not.
For our conversion window, we set it to 1 day because that is an appropriate amount of time to give someone to do the following four actions:

The funnel set up looks like:
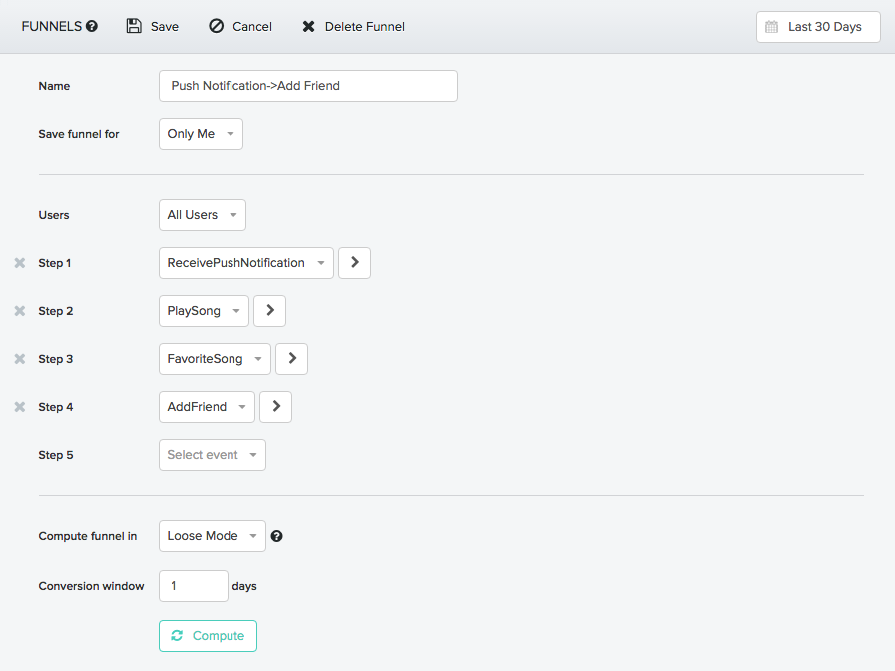
Here are the funnel results:
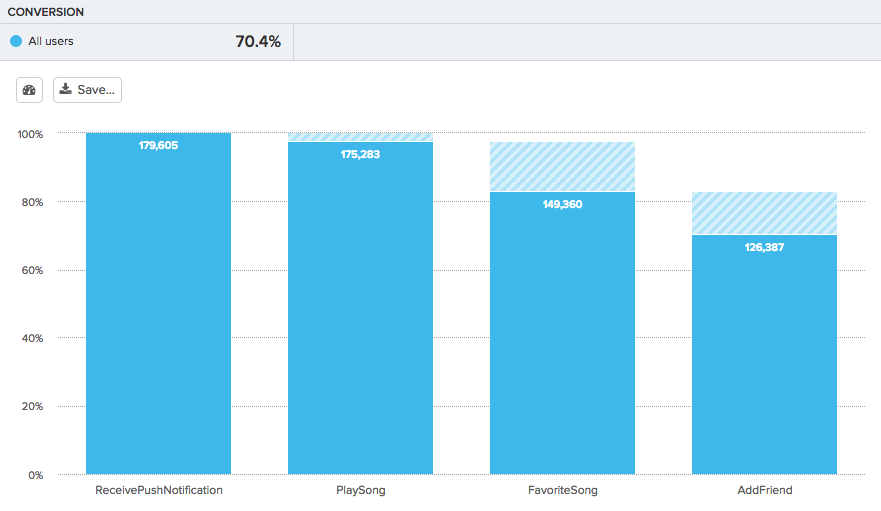
We see a 70.4% conversion rate for the funnel, ie. 70.4% of users who entered the funnel did all 4 actions within 1 day. At a high level, this seems like a strong conversion rate and interesting enough to further analyze, but it doesn’t tell us anything actionable on its own.
To get more clarity, we’d like to compare the funnel conversion rates for users who get a notification and then play a song vs. users who get a notification and don’t play a song. We can accomplish this comparison by creating a (group of users defined by specific behaviors). Our goal is to see whether users who play a song after receiving a push notification are more likely to add friends.
Previously, generating these behavioral cohorts would require raw data access and manual SQL queries, something that not every company or team has access to. This could take anywhere from hours to days, depending on your data warehouse configuration and volume of data (and when your data team can get to it). As we’ll show below, however, anyone can use Amplitude to create and analyze these cohorts in minutes, with just a few clicks.
First, we build a funnel with the following setup:

This funnel will show us users who received a push notification and then played a song within 5 minutes of receiving the push notification. Since we care about the order of events in this case, we will compute this funnel in Strict Mode.
Here are our funnel results:
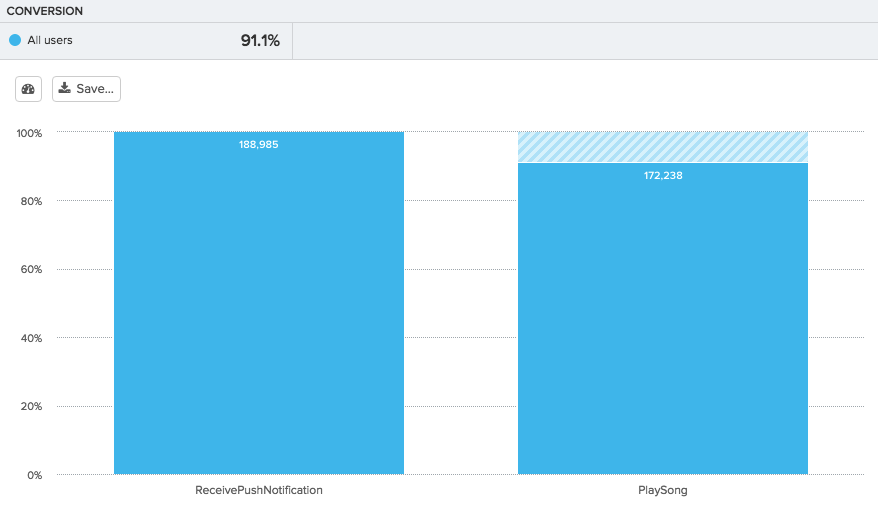
91.1% of users who receive a notification go on to play a song within 5 minutes — not bad.
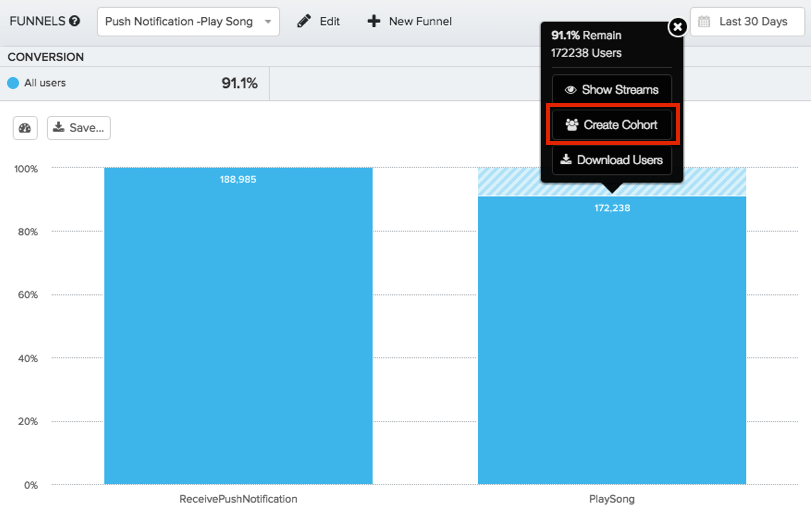
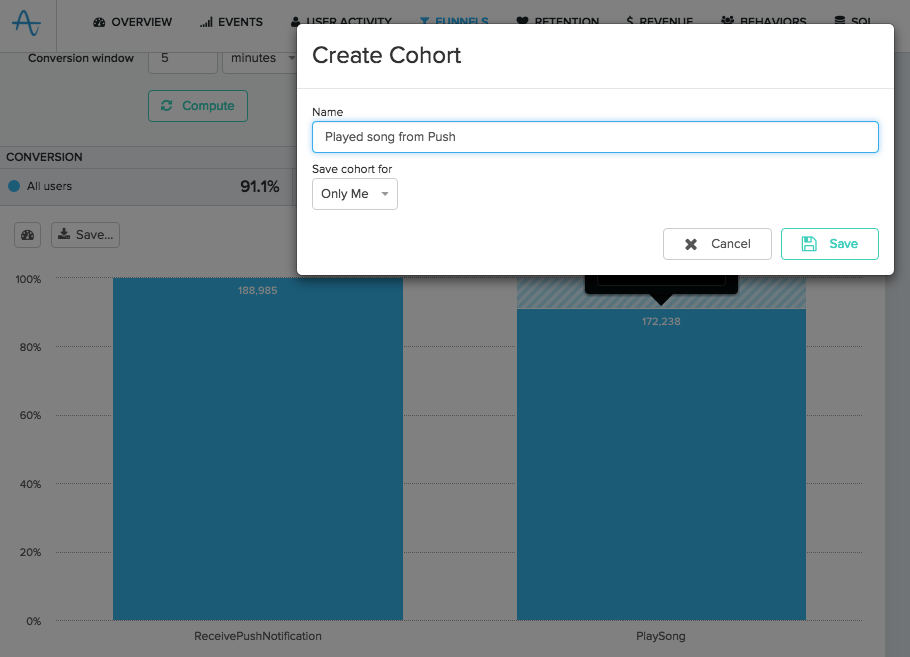
To create the two cohorts described previously (users who played a song after receiving a push notification, and users who did not play a song after receiving a push notification), we can use Amplitude’s feature. Microscope allows you to instantly create a custom cohort of users from any data point in Amplitude (you can see it in action ) — this gets rid of the need for SQL queries or complicated cohort definitions.
We use Microscope to create a cohort of users who converted from this funnel, and name the cohort “Played song from Push”.
Now, let’s revert back to our initial funnel and segment the funnel to compare the two different cohorts of users; those in the “Played song from Push” cohort (blue segment) and those not in the cohort (red segment).
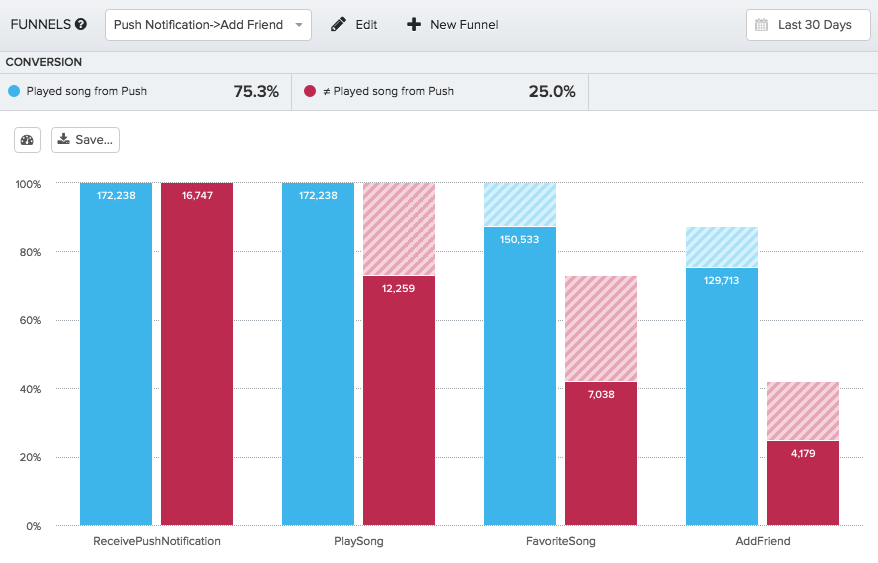
Voilà! The results are indeed very interesting.
75.3% of the users who played a song within 5 minutes of receiving a push notification also did both ‘FavoriteSong’ and ‘AddFriend’ within 1 day. This is 300% more than users who did not play a song after receiving a push notification.
In other words, a user is 3x more likely to do ‘AddFriend’ if the user receives a push notification and plays at least one song after receiving the notification.
Investigating Funnel Details
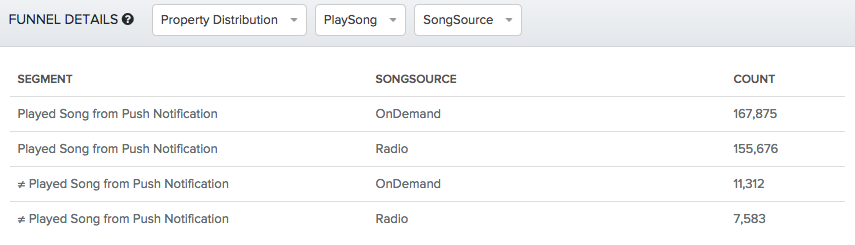
In Amplitude, you can see additional funnel details around event properties and conversion over time.
Let’s check to see if there are particular trends on conversion over time or critical insights in the property distribution of the ‘PlaySong’ event. Looking at the ‘SongSource’ property for ‘PlaySong’, it seems that the contribution of ‘OnDemand’ and ‘Radio’ is very similar across the two user cohorts, so nothing too interesting there.
We also see trends in conversion over time seem to stay consistent for both cohorts.
This chart compares the conversion over time of our 2 behavioral cohorts for the PushNotificaton -> AddFriend funnel.
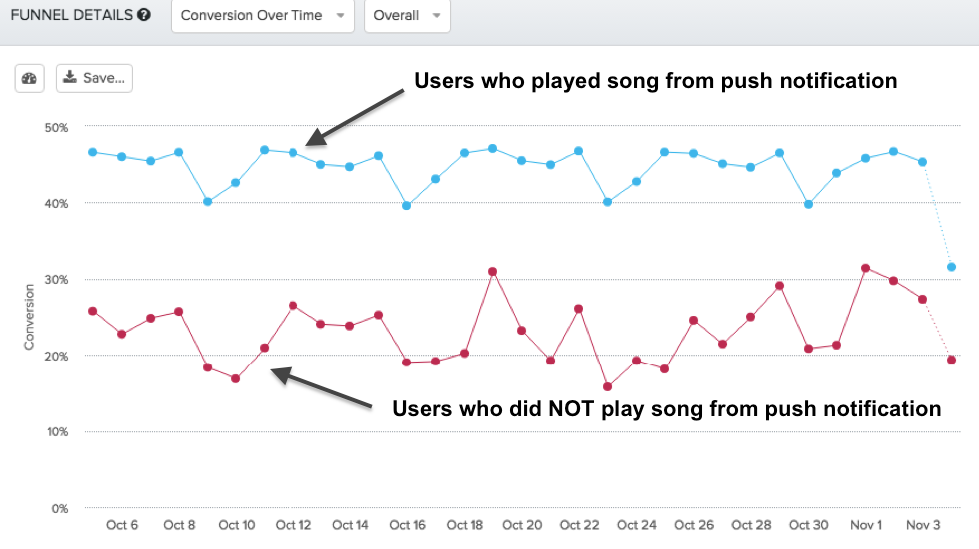
Overall, we know that that users who receive push notifications and play a song within 5 minutes are 3 times more likely to add friends, but there are no critical insights from Property Source distribution (for the type of song they play) or conversion over time.
Step 3: Act Upon the Funnel Insights
Our next goal is to create a retention loop where we can get more users to come back and do the desired action — add more friends — which is correlated with retention, our main KPI.
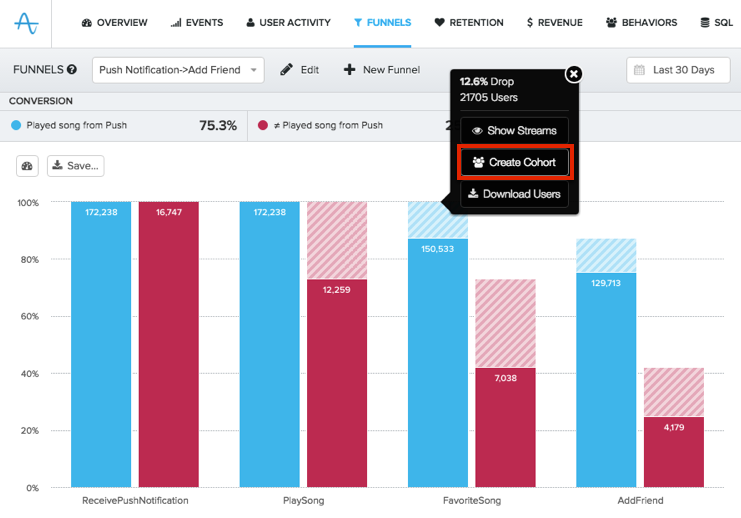
Let’s use the feature to make cohorts of users who dropped off from our funnel at critical points like ‘FavoriteSong’ and ‘AddFriend’. One thing we can try is sending push notifications or emails to those users to get them to take the corresponding actions.
You can use an in-house messaging platform or one of our mobile marketing partners like or to message these cohorts.
This image shows how you can use Microscope to create a custom cohort of users who dropped out of the funnel at the ‘FavoriteSong’ step. You can then send a targeted message to those users to encourage them to come back to the app and add a friend.
What We Learned
To summarize, we landed on a very critical insight to possibly boost our most important KPI by using the following framework:
- Explore to analyze patterns around how users reach the critical event (AddFriends) and what they do immediately before and after the critical event.
- Test your hypothesis by building funnels with the appropriate conversion mode and conversion window.
- Act upon the funnel results to encourage the right actions using cohorts.
We hope this article helps you understand how to get the most out of funnel analysis on Amplitude. Funnels can provide some incredible insights when you use them in conjunction with , , and the to get the maximum value.
Comments
: That is a brilliant feature guys. Keep up the good work!