Retention as Your Growth Engine Part 1: Understand New User Activation
A strong activation funnel is the foundation for high retention in your product. Learn how to measure and optimize new user activation in a few simple steps with Amplitude.
This is part one of a three-part series on Retention as Your Growth Engine. Part two covers how to drive engagement and stickiness, and part three covers how to re-engage dormant users.
If you want to build for retention, activation is one of the most important parts of your product funnel. The rest of your product might be incredible, but if you can’t get new users to experience value fast enough, you’ll struggle with your overall product retention. Increase activation rates, and you increase retention—ultimately fueling your product growth.
The ability to define and measure the stages of new user activation is key to creating an activation flow that works. Fortunately, analyzing new user activation is easy in Amplitude. This article will walk you through how to do it step by step.
Key takeaways
- A strong activation funnel is key to building retention in your product.
- To improve your activation flow, you need to measure and analyze the different stages—doing this in Amplitude is quick and easy.
- Define the stages of your activation funnel and track one event per stage.
- In Amplitude, you can view the conversion rate between different stages and the overall activation conversion rate, plus how long it takes users to pass between the different stages.
- Analyze drop-off paths to discover what’s causing people to churn during activation.
- Analyze the retention rates of different behavioral cohorts to see which actions during activation flows correlate with new user retention.
- Improve your activation flow based on your findings to reduce drop-offs.
Define your activation funnel
Before you can properly analyze your activation funnel, you have to define the different steps your users take during activation. Start by building a Funnel Analysis chart in Amplitude. For each step of the onboarding journey, track the event that best represents that step.
Let’s imagine I’m a product manager for AmpliTunes, an online music streaming service. I define the following activation funnel stages:
- A user signs up.
- A user searches for a song or video.
- A user plays a song or video.
- A user purchases a song or video.
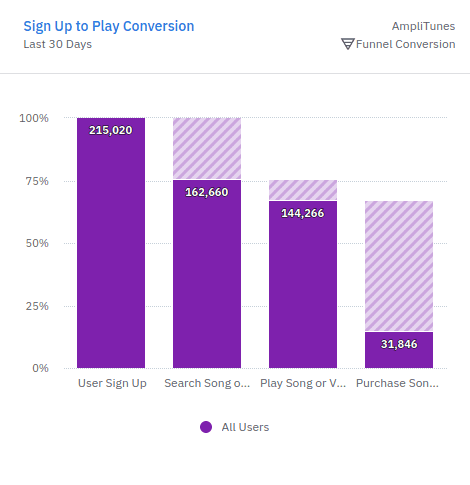
This example dataset shows that around 31k of the 200k users who signed up actually purchased a song or video.
By tracking these activation events in Amplitude, we can see how many users pass through each stage of our funnel: our conversion rate. If we hover over the different events, we can identify:
- The percentage of users who progressed from the previous step
- The conversion rate for the entire activation funnel—in this case, 14.8%
- The amount of time it takes users to complete the different steps
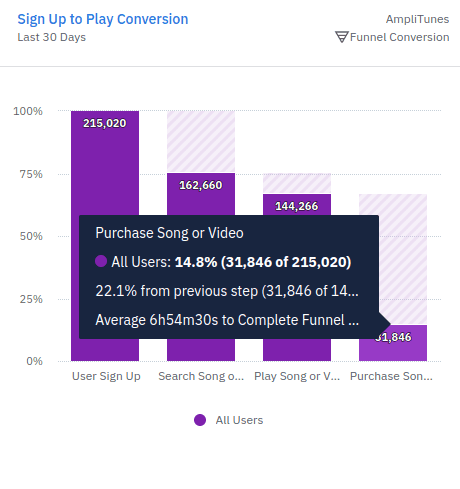
The call-out box shows 22.1% of users who played a song or video ended up purchasing a song or video.
Investigate what causes drop-off
We want to encourage more users to complete these steps. To do that, we need to investigate what’s causing them to drop off from the activation funnel and remove those friction points.
Toggle to “drop off paths” to see the pathways that lead users to drop off. Amplitude labels the pathways with the percentage of users that take them, so we can identify the most common drop-off paths. We want to prioritize rectifying the most common reasons for drop-off first.
In our AmpliTunes example, we can see a lot of users drop off when we prompt them to view multiple ads.
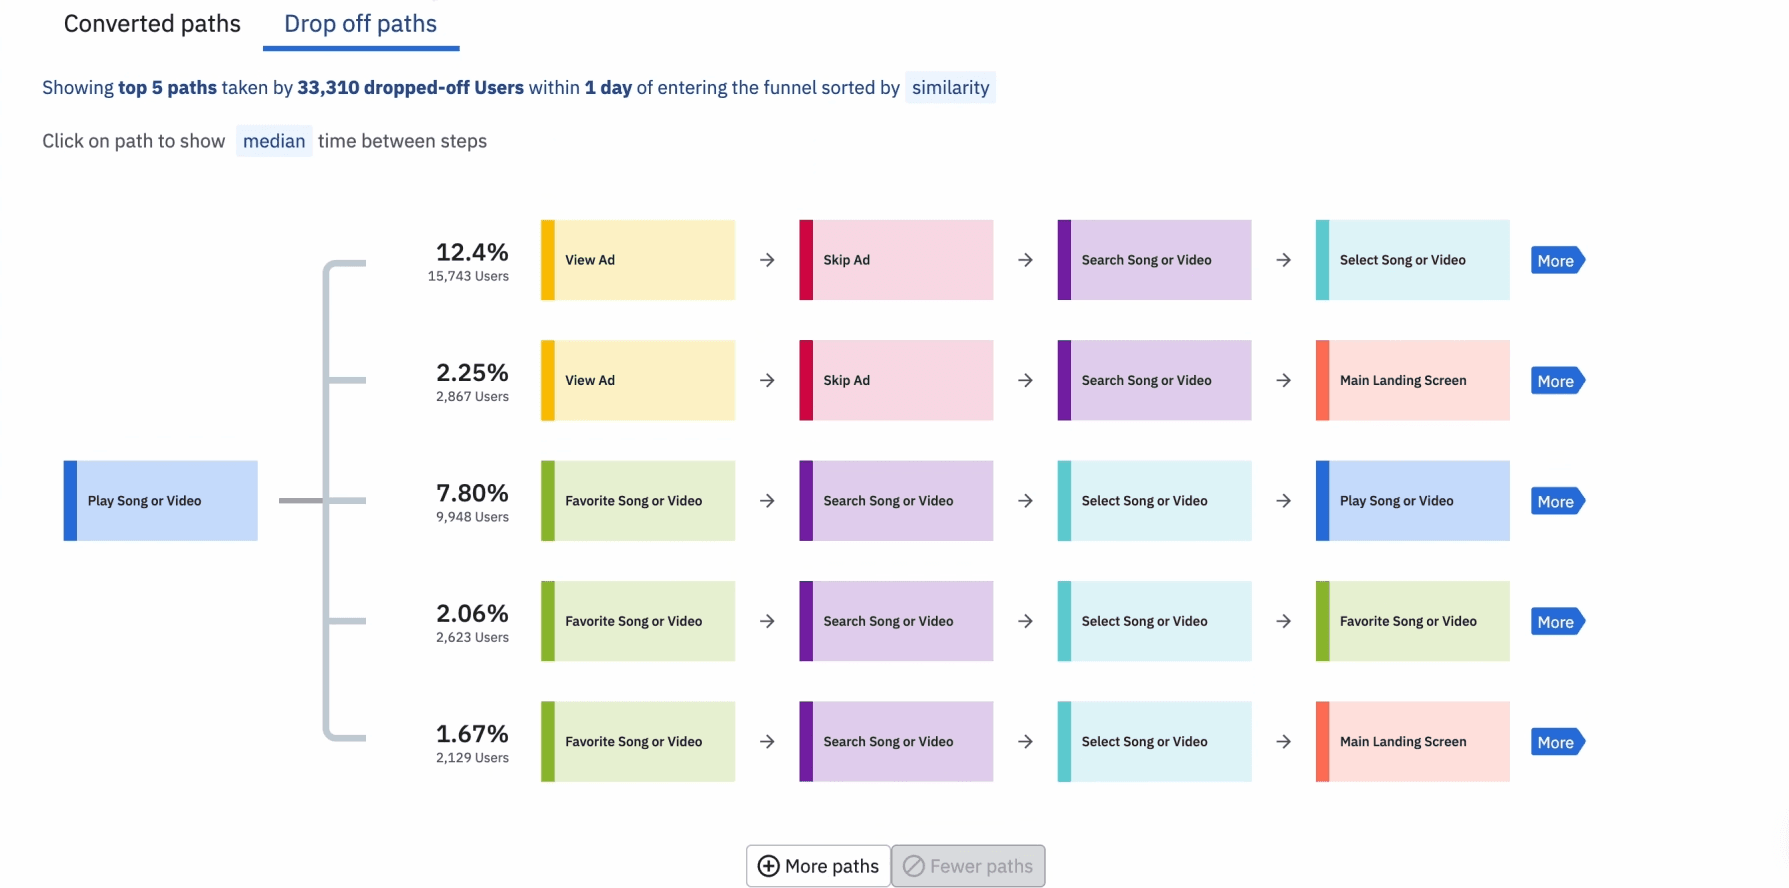
The drop-off paths show the different actions users complete before they leave the platform.
Another way to analyze drop-off is to check which actions correlate with drop-off by looking at conversion drivers. Amplitude gives each action a “correlation score,” so you can identify how strongly different user actions are linked with drop-off. If there’s a strong correlation, we know that action likely creates an experience that makes users want to leave our platform.
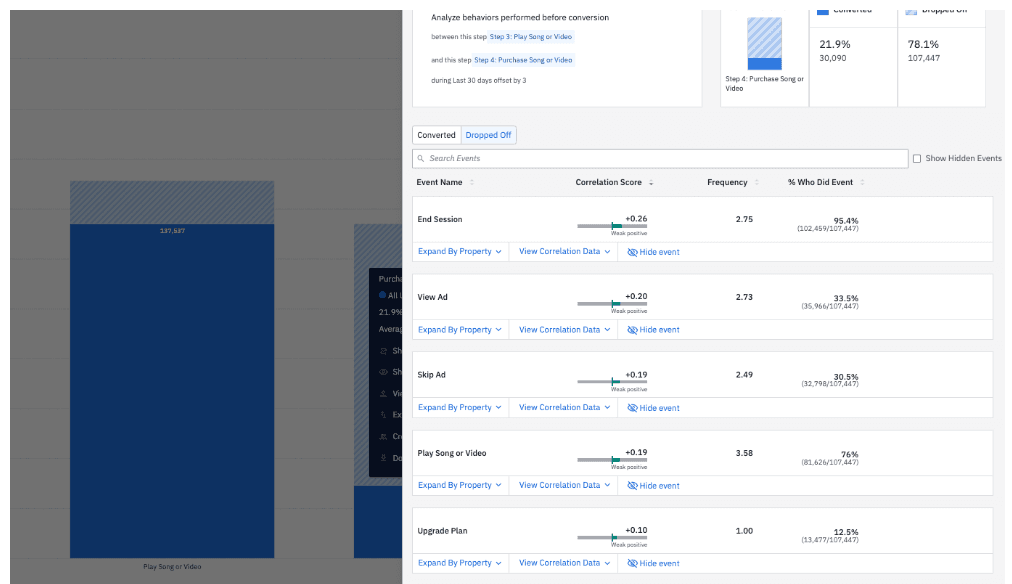
This view of the dashboard shows events like “View Ad” and “Play Song or Video,” with a correlation score for each one.
For AmpliTunes, looking at conversion drivers shows that users get stuck at the “View Ads” activation part of the onboarding flow. With this information, we can look at further optimizing this step in the activation journey.
Analyze new user retention
Once you know which behaviors correlate with new users returning and retaining, optimize your activation flow to encourage those actions.
First, create segments to group users by different behaviors. For instance, you might segment AmpliTunes users who shared a song or played a certain number of songs or videos.
Then, compare retention across segments. In the AmpliTunes example, that would look like comparing retention between users who shared at least one song or video and users who didn’t share anything.
Was retention higher for AmpliTunes users who shared at least one song or video compared to those who didn’t share anything? In this graph, the blue line represents users who did share a song, and the green represents users who didn’t.
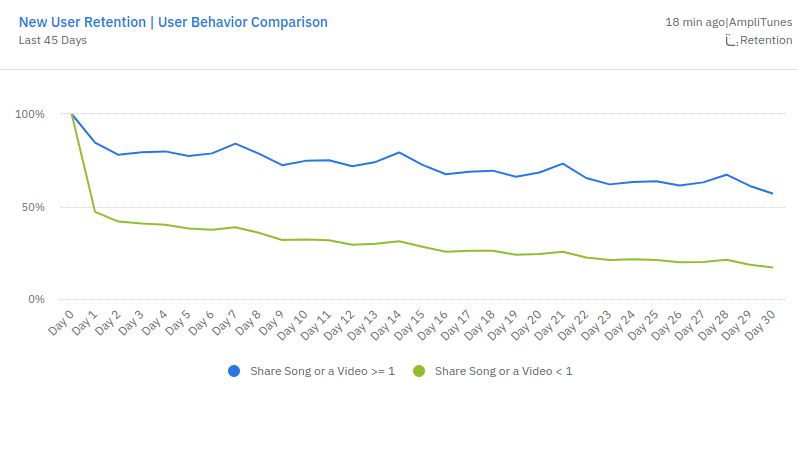
The graph shows that the retention rate for users who shared at least one song or video is consistently higher than for those who didn’t.
We can see that activation retention is higher among AmpliTunes users who share songs—which suggests that song/video could be a behavior that leads to higher retention. We can test this hypothesis by prompting users to share songs during activation and checking whether it impacts retention or not.
Act on your insights
Your analysis with Amplitude helps you to identify activation roadblocks that are causing users to drop off and opportunities for improvement. Implement those insights by adjusting your product to encourage retention.
For instance, in AmpliTunes, we learned that multiple ads cause drop-off, and song sharing likely promotes retention. After running tests to confirm our hypotheses, we can implement those findings to improve user activation. We might try reducing the number of ads we display in one go and prompting users to share songs.
Get onboarding inspiration from real-world examples
Let’s have a look at a couple of companies that have improved retention after analyzing their activation funnel.
Calm
The team at the meditation app Calm analyzed user behavior with Amplitude and discovered that retention was 3x higher among users who set a daily meditation reminder. So, they ran a test. They prompted users to set a meditation reminder during the onboarding flow.
Calm discovered that users who set up the reminder because of the prompt were more likely to stick with the app than those with no reminders. The team discovered during the test that 40% of users who saw the prompt set a reminder, so they decided to roll out the prompt across the whole app.
Boost retention across the entire product funnel
To boost retention across your entire product, you’ll also want to work to drive engagement and stickiness (part two) and re-engage dormant users (part three). Learn more in our Mastering Retention Playbook.

Bethany Mangan
Senior Solutions Engineer, Amplitude
Bethany Mangan is a senior solutions engineer helping corporate businesses bring power to their products. She has a background in economics and data science and is passionate about helping teams build a data-driven culture.
More from Bethany
