The Problem with Basic Website Analytics (& What You Should Really Measure)
Replace your dated website analytic targets with these actionable engagement-based goals.
Imagine this: You start your workday with a cup of coffee and by cracking open your laptop. You check a standard website analytics platform like Google Analytics and see that, yet again, your user traffic and engagement is stagnant. Users are visiting your site, but it’s apparent that new sign-ups for your product aren’t where they should be. Frustrated, you take stock of the work and long hours you’ve put into moving the needle: you have changed the copy on the home page numerous times, and optimized the page load speed—yet you still can’t seem to figure out why numbers aren’t trending up.
The (very likely) culprit? You’re not measuring the right things.
Too often, businesses focus on vanity metrics—think: traffic, clicks, and so on. These vanity, or session-based, metrics show just a snapshot of a moment—a click, a bounce, a number. Marketers should be able to discern useful insights around customer behavior when looking at website analytics.
To conduct this analysis, they’ll need to instead focus on leading indicators of growth, not lagging indicators. We’ll spend this time unpacking impactful engagement-based metrics.
The Shortcoming of Many Website Analytics Metrics
Most free (or nearly free) analytics tools used by marketers focus on engagement in broad strokes rather than at the individual customer level. Popular vanity metrics that are tracked in tools like Google Analytics include click-through rate, site traffic, bounce rate, and time spent on page.
[Learn more about the differences between Google Analytics and Amplitude.]
A good portion of the time, marketers turn to Google Analytics when they need insight into their user traffic. There, they find, what appear to be at first glance, invaluable markers of engagement: session-based metrics like click-through rate, traffic, time on page, and so on. These session-based metrics capture exactly that—a session. This is essentially a sliver of a moment, providing superficial and transactional detail on only that moment, but not the circumstances, metadata, or attribution details surrounding how that user was brought to (and left) that particular moment.
This is not to say vanity metrics don’t provide us with valuable information, but they’re generalized and somewhat unwieldy. They aren’t especially helpful if you’re trying to figure out what nuanced adjustments your product needs to make different user groups happy.
Why? Because your customers ultimately are more than the sum of a traffic total or click. They’re each motivated by unique factors and interact with your product in distinct ways as a result of these external influences.
Engagement-based, or behavior-based, metrics from product analytics are more actionable. Leading indicator metrics empower marketers to see how different users are interacting with their product and campaigns. Empowered with these granular insights, you can make precise improvements to your customer messaging based on different user needs.
6 Website Analytics Practices to Bolster Your Marketing
The success of your product and online engagement hinges not only on what user data you’re measuring towards internally, but also on how you’re tracking and presenting said data. These best practices break down how to meaningfully measure towards useful, engagement-based metrics—and how to share these insights with your team to drive positive results.
Monitor N-Day Retention
More often than not, you’re likely wondering how many users are checking out your app or site repeatedly, rather than at that moment. Unfortunately, looking at the number of total visitors gives you only a blanket sum of the visitors on a particular day or month. This information isn’t helpful if you want to know who keeps coming back after the first time.
A leading indicator to consider measuring is N-Day retention, which provides a more granular look at traffic as well as potential patterns of repeat visits. Whereas total visitors tells you how many people visited in a day, N-Day Retention tells you how many people visited one day after another.
Unlike total visitor counts, N-Day Retention enables you to easily identify trends where people fall off from a pre-designed workflow. From here, this information allows you to split your user experiences via A/B testing to figure out what influences, positive distractions, promotions, carousels, or offers causes people to return another day, and so on.
N-Day Retention is especially useful for refining individual activities or portions of your product. If you were to realize that users making it past day seven are all completing a certain activity, whereas those who drop before then aren’t, you need to figure out how to promote that specific activity in a better way towards the rest of your less engaged users.
You can measure N-Day Retention easily via Amplitude.
Track Activity by Cohorts
Your user personas consist of different behaviors, choices, and usage habits. To understand these differences, marketers often rely on demographic or geodata. But this information covers very binary attributes of your users —such as location, age, etc.— not how said users are engaging with your product.
Measuring user activity by cohort, or segmenting them by shared attributes and behaviors, is more informative and can drive a personalized marketing strategy much further than demographic data alone. Cohorts are typically smaller segments than demographics, with the criteria based on actual customer activity, shared attributes (such as initial_utm_referrer, utm_campaign, etc.) or shared inactivity within a specific timeframe.
For best results, we suggest splitting out your cohorts into two different groups: predictive and behavioral.
Predictive cohorts are created using Amplitude’s ability to leverage behavioral data. With a predictive cohort, you set an ideal goal, or outcome. From there, Amplitude will use your existing historical data to determine how likely a certain group is to reach that outcome you’ve set. Predictive cohorts are most useful when you are trying to track something that doesn’t have a typical funnel, has more than 100,000 users, or you want to drive a certain behavior. You can create predictive cohorts using Amplitude Recommend.
Behavioral cohorts allow you to segment users together based on certain features used within a certain period (or a lack thereof). When paired with retention analysis, you can see how those different actions influenced whether a selection of users retained or not. You’ll often find certain features have a pivotal role in driving engagement and retention. You can create behavioral cohort groups in any way you see fit—and it’s worth noting repeat purchases are an essential behavioral cohort to watch.
For example: Create a cohort of your repeat purchasers and reverse engineer the process, seeing what kinds of actions the members of that cohort have in common. Are those engaged with a certain feature your top repeat purchasers? Or is there a stronger correlation between time and repeat purchasing? By examining repeat purchase cohorts, you’re able to determine what it is that’s bringing these power users back and then use this information to inform and encourage that behavior from other users.
Mapping The Complete Customer Journey
A critical way to more accurately measure your users is to piece together the complete customer journey—you can accomplish this by utilizing identity resolution. For example, if someone’s using your app on their phone and then switches to the computer, you should be able to have a holistic and comprehensive view of that journey and every step in between.
Identity resolution gives you a complete look at someone’s journey with your product, rather than a snippet (like tracking their use only on the mobile app or site). This information allows you to make a more educated decision rather than an informed guess. If you’re already following N-Day Retention, creating various cohorts, and understanding drop-off rates, you’re well on your way to complete identity resolution. This practice of stitching together users’ behavior from one channel to another is an invaluable way of ensuring your customer journey is complete and seamless.
Leverage Conversion Drivers
Measuring conversion rate (solely) provides somewhat of an incomplete picture. You know whether a user converted or not, but this information doesn’t tell you what choices they made to reach that decision to convert, or what roadblocks they encountered that distracted them from reaching the conversion event.
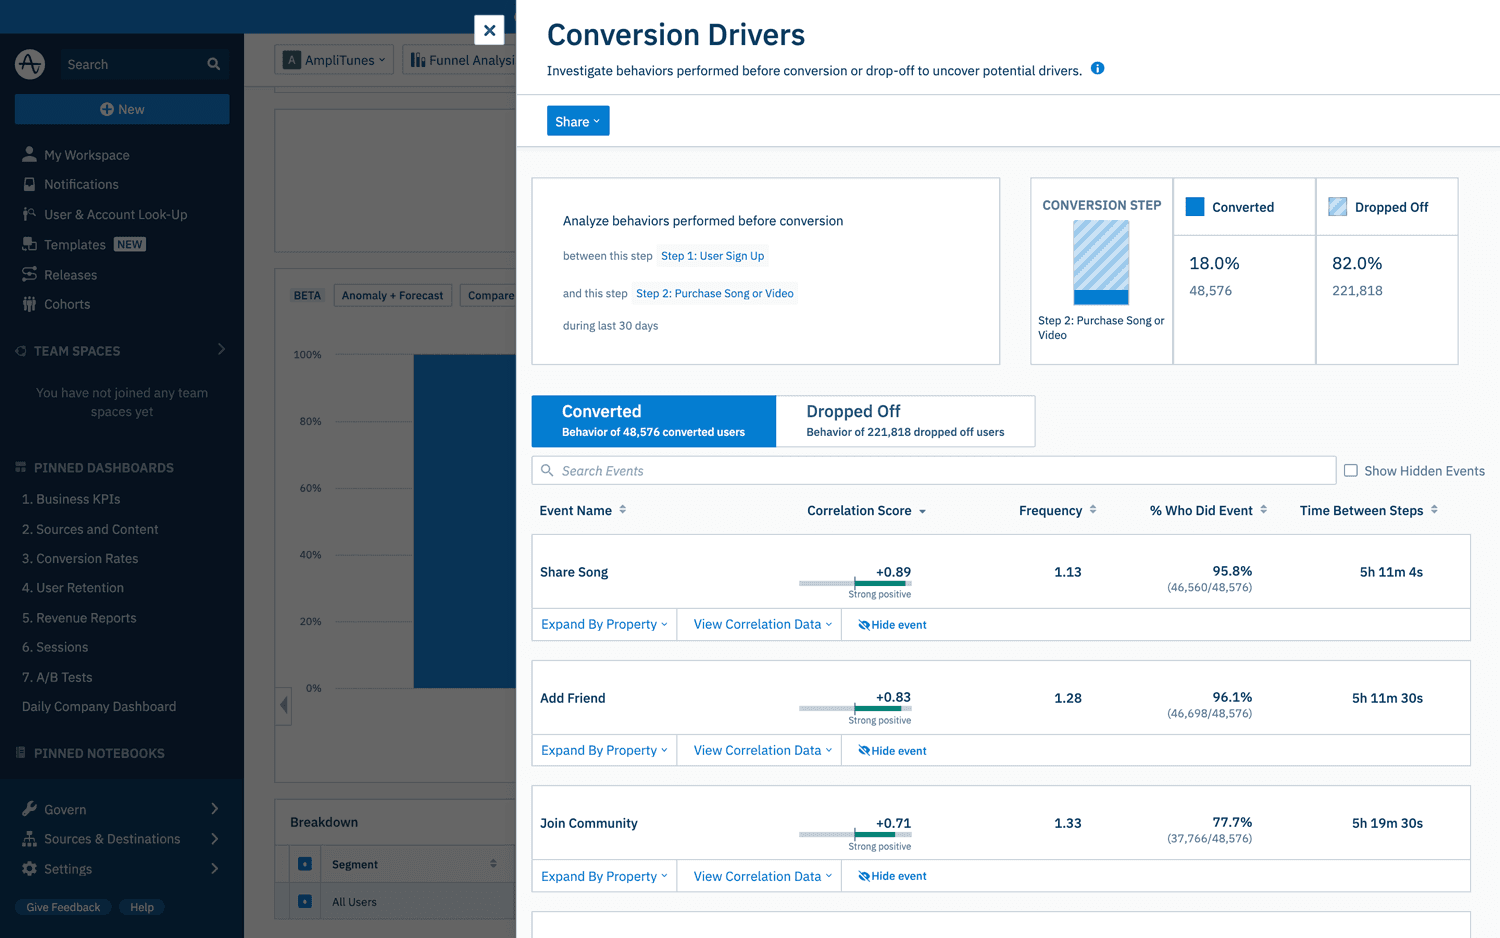
With Amplitude’s Conversion Drivers, you’ll unlock the ability to understand what users did to get to a conversion point—or what bottlenecks they hit along the way until they dropped off.
You can also adjust your Conversion Driver report to be as granular as you like while creating your own conversion funnel. Let’s assume that you’re wondering why some people use the share function and others don’t. You can measure all events correlated to sharing, liking, and commenting by adding them as steps within your conversion funnel. From there, you can filter by user properties to see what people who make it past a certain day tend to like, comment, and eventually share. You could conversely understand why those who stay but never engage with liking or commenting don’t share.

Conduct A/B Testing
You don’t refine an entire site or app at once—you make incremental steps by testing out different choices and iterate based on your user engagement (or lack thereof).
A/B testing is the practice of making small tweaks and seeing how audience samples respond. It’s an essential way to figure out what does and doesn’t work, regardless of what it is you’re trying to optimize.
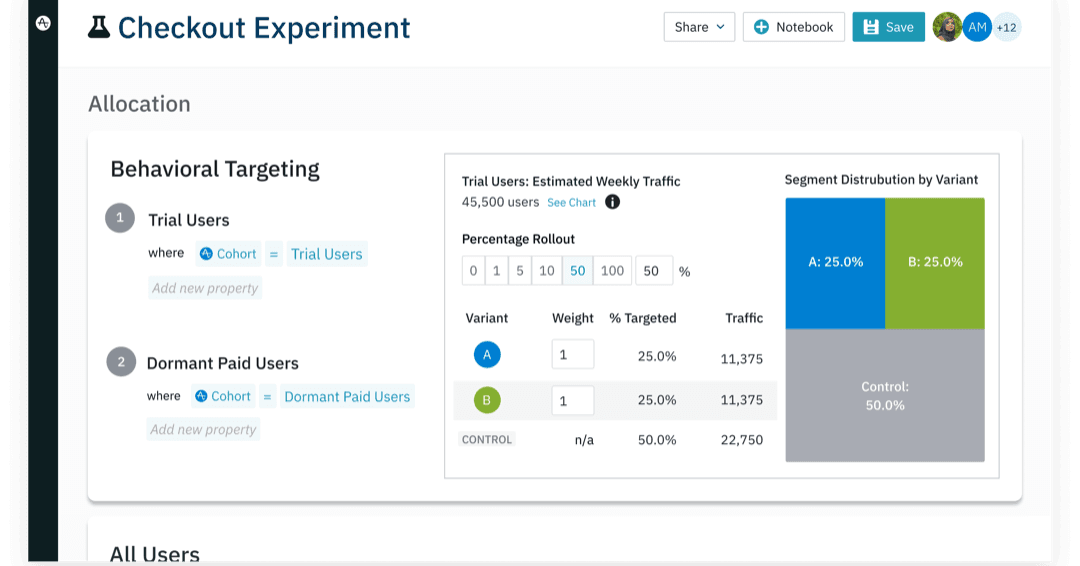
It’s best to start small, and by identifying an element you want to move the needle on. If you’re trying a new style of the “like” button, roll it out for a small portion of users and see how the response is. Then, rinse and repeat. If the response is positive in a test, roll out the change to a larger group of users, and tweak as you see fit. In Amplitude you can easily compare the performance of your split test results using our A/B Test Significance and Improvement view via our Funnel Analysis chart. You can also run larger A/B tests on the digital experience with Amplitude Experiment.

Design Your Teams’ Personalized Analytics Experience
No two growth marketers operate or approach their work the same way. Everyone has their own methods for sifting through data, researching, and reaching their own conclusions. So it only makes sense that you should personalize the analytics experience itself that said marketers use to inform their strategies.
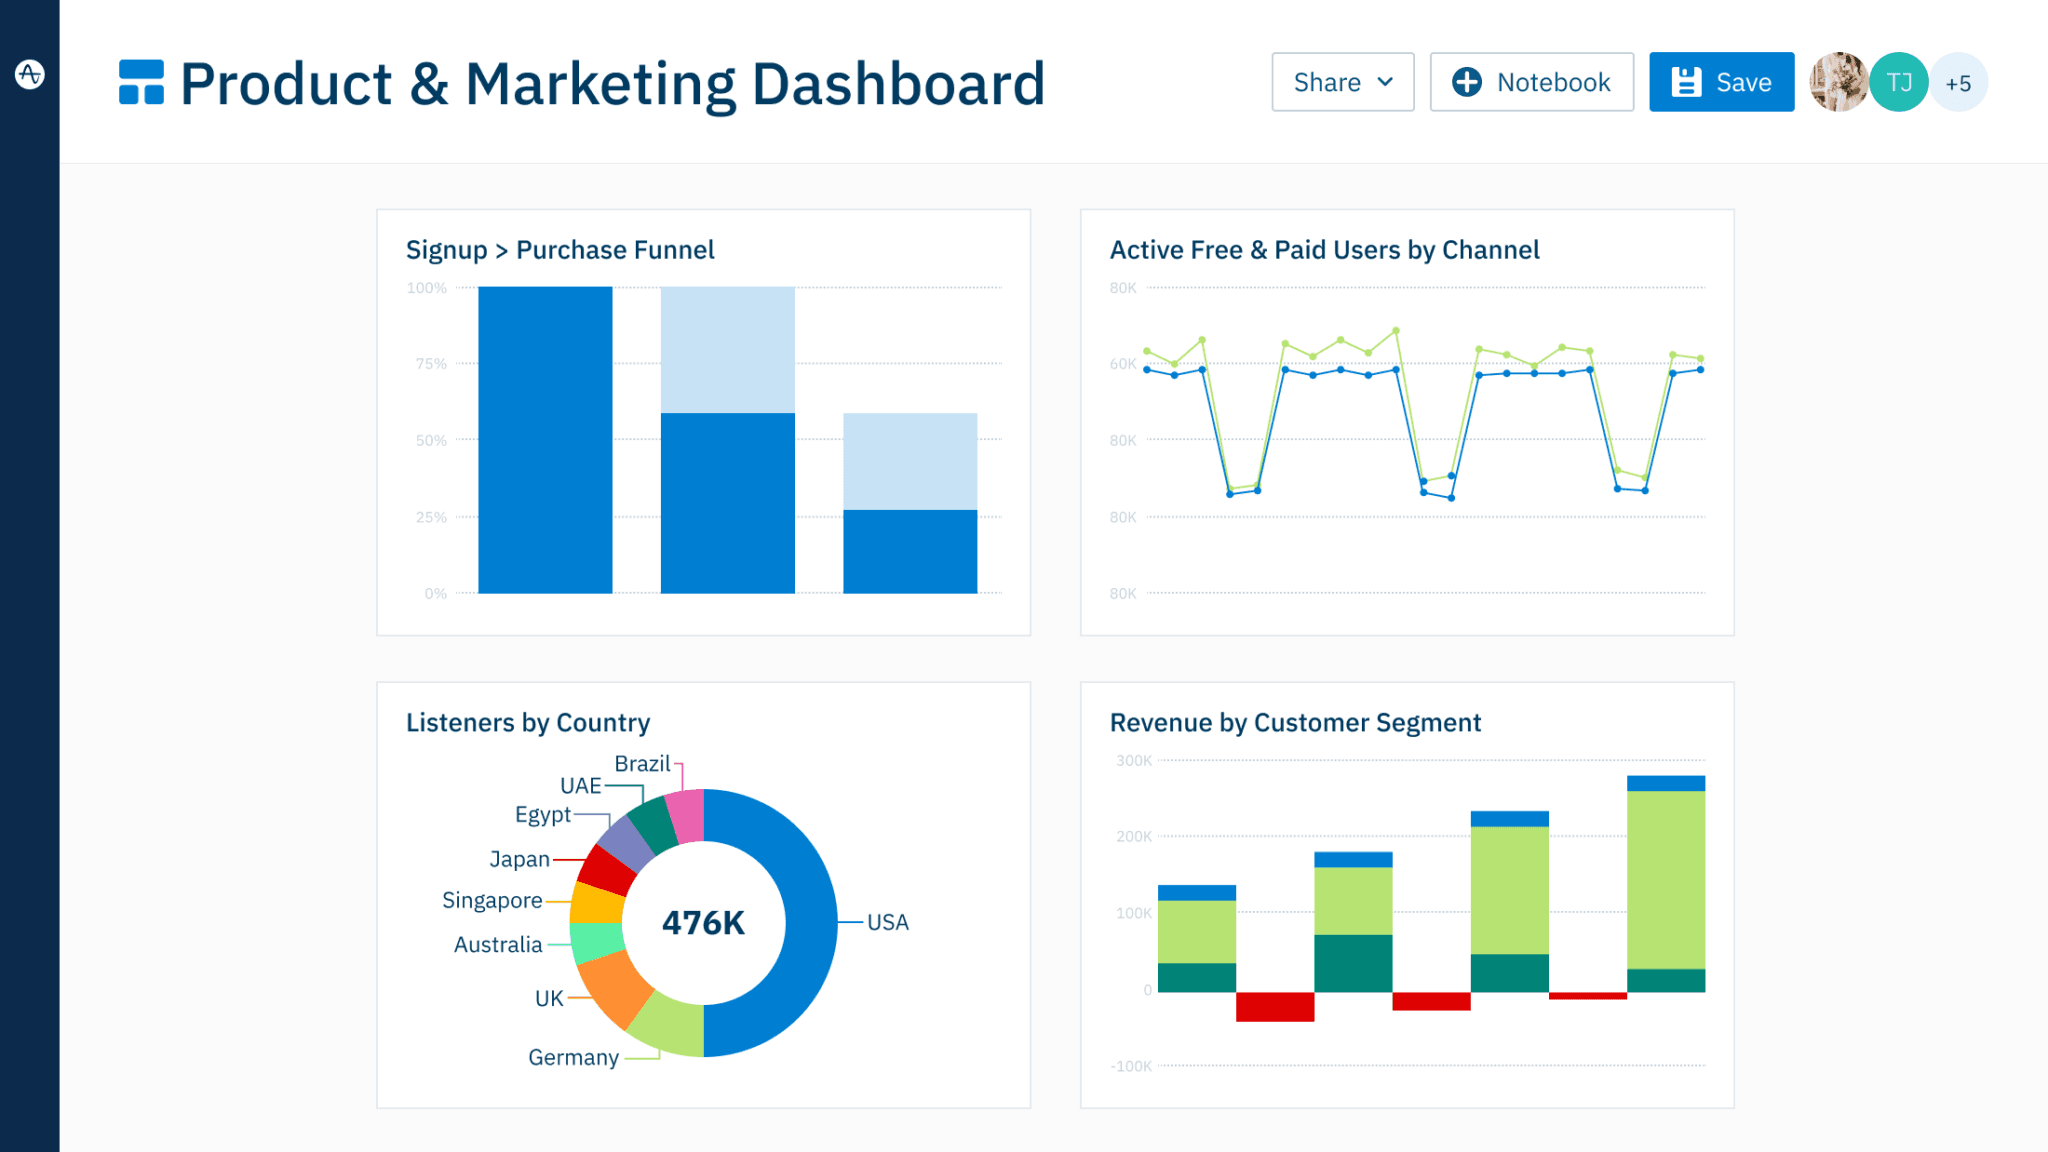
Amplitude’s Dashboards are customizable, letting each marketer measure, maintain, and adjust the indicators of performance that are most important to them. For example, if you want to focus on retention once users have completed the First Time User Experience workflow, you could create a FTUE Dashboard. If you want to understand user engagement with social features, you could create a Social Engagement Dashboard, where you can easily understand which and how many users comment on content. Meanwhile, you can share these dashboards out with the appropriate team members for visibility cross-team and cross-functionally.

Making Analytics Work For You
It’s incredibly easy to focus on session-based metrics and only those alone. Session-based metrics are popular, easy to acquire, and appear to have a lot of value. But engagement-based metrics ground that information in reality.
Convincing your team to convert from session to engagement-based metrics is no small task. But with the right solution, you can showcase the power of engagement-based metrics and streamline the process.
Amplitude allows you to create individual dashboards for your users, easily track retention types, create custom cohorts, and build a growth marketing culture around engagement-based metrics. See for yourself with Amplitude’s free plan, and start tracking engagement today.

Sam Edwards
Former Global Technology Partner Manager, Amplitude
Sam is a global technology partner manager at Amplitude and former solutions engineer and customer success manager. She specializes in helping businesses reach their revenue goals, scale for growth, and build the best product for their users.
More from Sam


