You Say You’re Data-Driven, We Call Bullshit
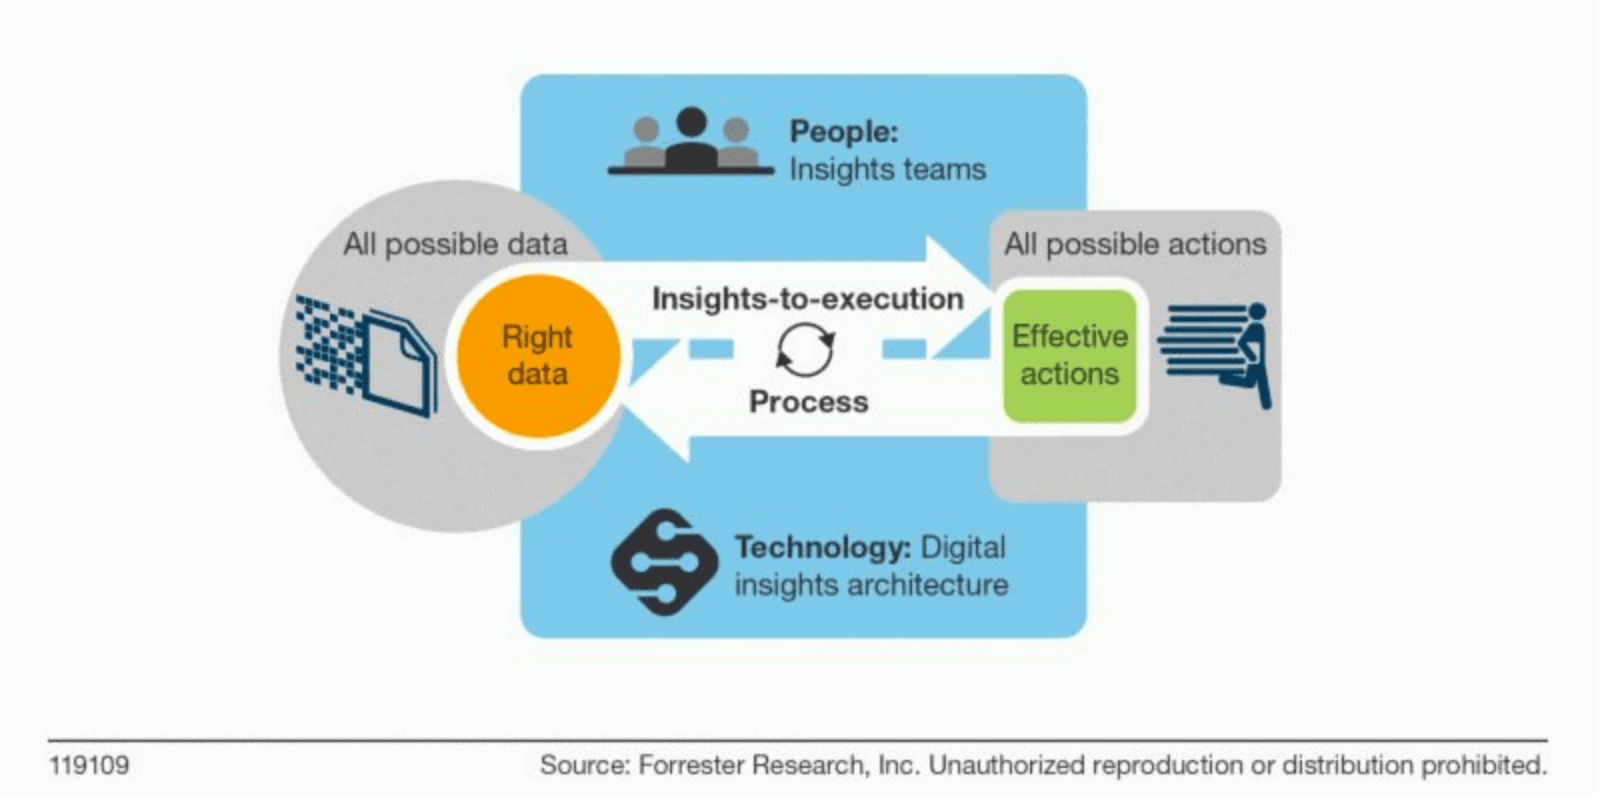
Being truly data-driven means uniting around one goal, and enabling everyone to access the data and derive actionable insights from it.
Word on the street is that data is important. And we know that you know it’s important–in fact, based on the State of Analytics 2016 report, 86% of industry professionals believe analytics is critical to their decision-making process.
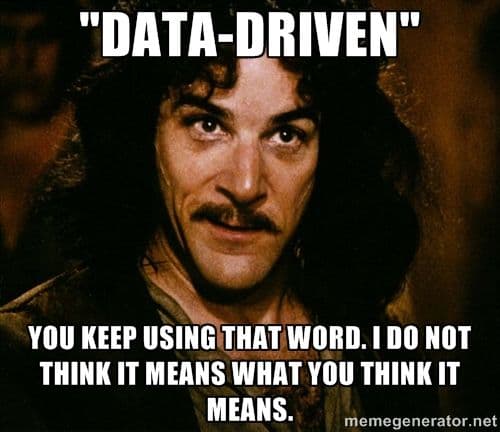
But setting a couple of KPIs and checking your DAUs is still a far cry away from being truly “data-driven.” So many people and companies now use that term to describe their processes, it’s pretty much become meaningless.
Inigo Montoya does not approve.

Few businesses actually understand what it means to have a fully integrated culture of data. If you can’t quickly and easily get actionable insights from your data, unite your company around that insight, and make product or business decisions from it, describing yourself as “data-driven” would be a blatant misuse of the word. As it happens, 74% of businesses say they want to be data-driven, but only 29% say they are good at connecting analytics to action.
To know if you are truly a data-driven company, you should answer yes to these three critical questions:

- Is everyone aligned around a single core metric?
- Can everyone access the data they need?
- Can everyone get insights from their data?
Key word here? Everyone. Not just the analysts and data scientists, not just growth marketers, not just the C-Level execs. Everyone.
Uniting your company around a single metric
Why is it so critical to align your whole company around a single metric? It sounds somewhat counterintuitive. You have all this user data flooding in–if data is so important, why not measure and analyze everything? Insights into what your users are doing and how they are behaving provide opportunities to improve your product at every turn. Doesn’t it make sense to maximize those opportunities as much as possible? But if you do this, you may find yourself battling your own “5% Problem,” just like Evernote.
Even unicorns aren’t safe. Illustration for WSJ by Chris Silas Neal.

As Evernote evolved, it acquired so many new features and products that eventually it became difficult to pinpoint what its core user experience actually was. Former CEO Phil Libin said, “What winds up happening at Evernote conferences is that people go and they say, ‘Oh, I love Evernote and I’ve been using it for years and now I realize I’ve only been using it for 5 percent of what it can do.’ And the problem is that it’s a different 5 percent for everyone.”
As you begin to analyze user data in more and more sophisticated ways–identifying which behaviors are correlated with long-term user retention, which paths through your product lead to conversion and which lead to churn, or which features are popular for one segment of users versus another, for example–you can find yourself being pulled in hundreds of different directions. If you start to build features or modify your UX in an attempt to retain every single type of user, your product might start to develop an identity crisis.
In Evernote’s case, as the company continued to push out new features and products, they lost sight of of their core user experience, so much so that it became difficult to explain to new users what, precisely, Evernote helps them accomplish.
Uniting your company around a single metric compels you to define your core user experience. It is the one key metric that measures the value you provide your users.
Discovering that one core metric requires a deep, holistic look at your analytics and asking yourself: “What is the ‘Aha! Moment’ that gets users to keep coming back to my product?” For Facebook, it was adding 7 friends in 10 days; for Slack, it was exchanging 2,000 messages; for Dropbox it was uploading 1 file to 1 Dropbox folder.
‘Magic metrics’ like these define the product’s core user experience serve as the foundation and reasoning behind each new feature built. When the whole company is aligned around a single metric, as the product matures, its new features strengthen and feed back into the core user experience, instead of deviating from it. [Tweet “Magic #metrics define the product’s core user experience”]
Data access for the whole company
How do you get every single person invested in their company’s core metric? First of all, every single team–from marketing to growth to product development–has to define team-specific goals that feed into the overall core metric. For that, every single person needs to have access to the data.
Even at so-called data-driven organizations, data can be siloed, or inaccessible to certain teams or departments within the same company. Management consultant and writer Patrick Lencioni in his book Silos, Politics and Turf Wars puts it perfectly: “Silos – and the turf wars they enable – devastate organizations. They waste resources, kill productivity, and jeopardize the achievement of goals.”
It’s impossible to come up with individual tactical goals that contribute to the overarching core metric if data is siloed and available only to the growth team or only to the data scientists; more often than not, team strategies will deviate from the company’s goal if they can’t answer simple data questions for themselves.
For example, if someone on the marketing team of a mobile gaming company wants to know the proportion of daily active users who are on iOS versus Android, they should be able to easily access a dashboard or query for this information. Making this data available only to data scientists blocks both teams. Marketing won’t be able to design their next campaign until they get their answers and data science is blocked by having to do this “grunt work” instead of tasks that require their actual expertise.
Data insights for the whole company
Giving everyone data access is only one side of the coin. To be truly data-driven,_ everyone in an organization should be able to derive meaningful, actionable insights from their data._ Everyone, in a sense, should be able to feel as powerful as a data analyst.
It’s not as crazy as it sounds. Chances are, data analysts and data scientists aren’t the only ones who are capable of asking smart questions of their data. In fact, it’s to a company’s advantage to have all of their employees exploring their data, making hypotheses, and thinking about relevant experiments.
Having the data at hand but requiring knowledge of SQL or statistical programming languages like R or Python to gain insights again blocks the people who can derive the most value from those insights from actually getting them. In a sense, data insights themselves are being siloed.
Take the same fictional mobile gaming company as above. Say you want to compare the retention rates of North American users who download your game and come back the very next day versus users who don’t. You hypothesize that, like Zynga, Day 1 retention is correlated with long-term user engagement. If that’s the case, you would propose an onboarding scheme or email flow to encourage users to come back the day after their initial download.
Testing a query like this using SQL and R would be incredibly complex and time-consuming. The person wondering this would be blocked by their lack of skill or knowledge of coding, while analysts would be constrained by the time it would take craft such a query.
This is where having the right analytics tool can make all the difference. A platform that provides a clean, simple user interface in lieu of writing code by hand greatly speeds up how long it takes to get answers to even the most complex of questions. Everyone in your company, from non-technical individuals to data scientists, can use such a platform to get the insights they seek with just a few clicks of a button. Then, most importantly, they can devise ways to act on those insights, whether that’s through new marketing or product strategies, or something else. That’s the true meaning of being “data-driven.”
Start cultivating a data-driven company today
Becoming a truly data-driven organization isn’t easy. You may have even been operating under the assumption that your company already is data-driven when it really isn’t! Being truly data-driven means uniting your company around one goal that defines your product’s core user experience, and then enabling everyone within the company to both access the data and derive actionable insights from it.
**So is your company data-driven? There are a few things you can do right now to check: **
- Articulate the company’s core metric.
- Audit employees to see if everyone has access to the data they need.
- Find out where the blockers and why those blockers exist.
- Research analytics tools that enable everyone in the organization to gain data insights.
With the framework presented in this article and the checklist above, you’ll be well on your way to making your business data-driven. We’ll be talking more about the importance of analytics and data-driven decision-making for your whole company in future articles, so be sure to stay tuned.

Aditya Vempaty
Former Head of Marketing, Amplitude
As the former head of marketing at Amplitude, he had the privilege of hiring and leading a fantastic team of marketers, designers, and content folks to build a marketing engine that resulted in increasing revenues by 400% in 15 months.
More from Aditya


