5 Customer Engagement Metrics for Product Teams to Drive Success
Learn about the five key customer engagement metrics your team should use in order to understand and meet users' expectations and preferences.
Imagine this scenario: You’ve poured your creativity and resources into a new SaaS product, convinced it’s a game-changer. However, after launching the product, the number of active users doesn’t align with your expectations. What’s the missing link?
Enter customer engagement metrics—your compass to understanding how much and how well people use and like your digital product, ultimately enhancing the overall customer experience.
Customer engagement metrics have the power to impact your bottom line directly. After all, your users are the ones who will dictate the success or failure of your product. You can drive more success by improving your product to meet their expectations and preferences.
Key takeaways
- Track customer engagement metrics to understand how loyal, satisfied, and invested customers are with your product.
- Track retention rate, churn rate, session duration, conversion rates, and Net Promoter Score (NPS).
- Use Amplitude to monitor and improve customer engagement.
Five customer engagement metrics to track
To assess user engagement effectively, track these five key metrics.
1. Retention rate
Your user retention rate shows how many of your users continue to use your product over a specific period.
Higher retention rates are essential for the long-term success of your product or business. Retained customers continue to generate revenue and can become advocates of your product, bringing in referrals and additional business. A higher retention rate also means you don’t rely solely on acquiring new customers to grow.
To calculate user retention rate, take the number of users at the end of that period and divide it by the number of users at the start. Then multiply it by 100.
- Retention Rate = (Users at the End of Period / Users at the Start of Period ) x 100
For example, if you start with 1,000 users and have 150 users at the end of the period, the calculation is:
- User Retention Rate = (150 / 1,000) x 100
- User Retention Rate = 15%
Across all industries, here are the average retention rates:
- One month: 14%
- Two months: 12%
- Three months: 11%
2. Churn rate
Your churn rate shows how many users stopped using your product within a specific period.
A lower churn rate signifies your product is relevant and provides value or entertainment to users. It shows your product aligns well with the needs and preferences of your target market and demonstrates that you’ve identified a strong product-market fit.
Churn rate is calculated by comparing the number of customers or users who stop using a product during a specific period to the total number of customers or users at the beginning.
- Churn Rate = (Customers Lost During the Period / Customers at the Start of the Period) x 100
For example, if you had 1,000 customers at the start of a month and 50 customers stopped using your product during that month, the churn rate would be calculated as follows:
- Churn Rate = (50 / 1,000) x 100
- Churn Rate = 5%
In this case, the churn rate is 5%, meaning that 5% of the customers you had at the beginning of the month stopped using your product.
The median churn rates for different industries, according to a survey from Recurly, are:
- Consumer goods & retail: 7.55%
- Education: 7.22%
- Business & professional services: 6.59%
- Digital media & entertainment: 6.42%
- Healthcare: 6.03%
- Software: 4.75%
3. Session duration
Your session duration measures the time a user actively engages with a product or service during a single visit or session.
Session duration is a fundamental measure of how engaged users are with your product. It helps gauge whether users find value and actively interact with your platform. Companies can use session duration data to prioritize content creation and feature development. Consider giving more attention to features that contribute to longer sessions and removing or refining the less engaging aspects.

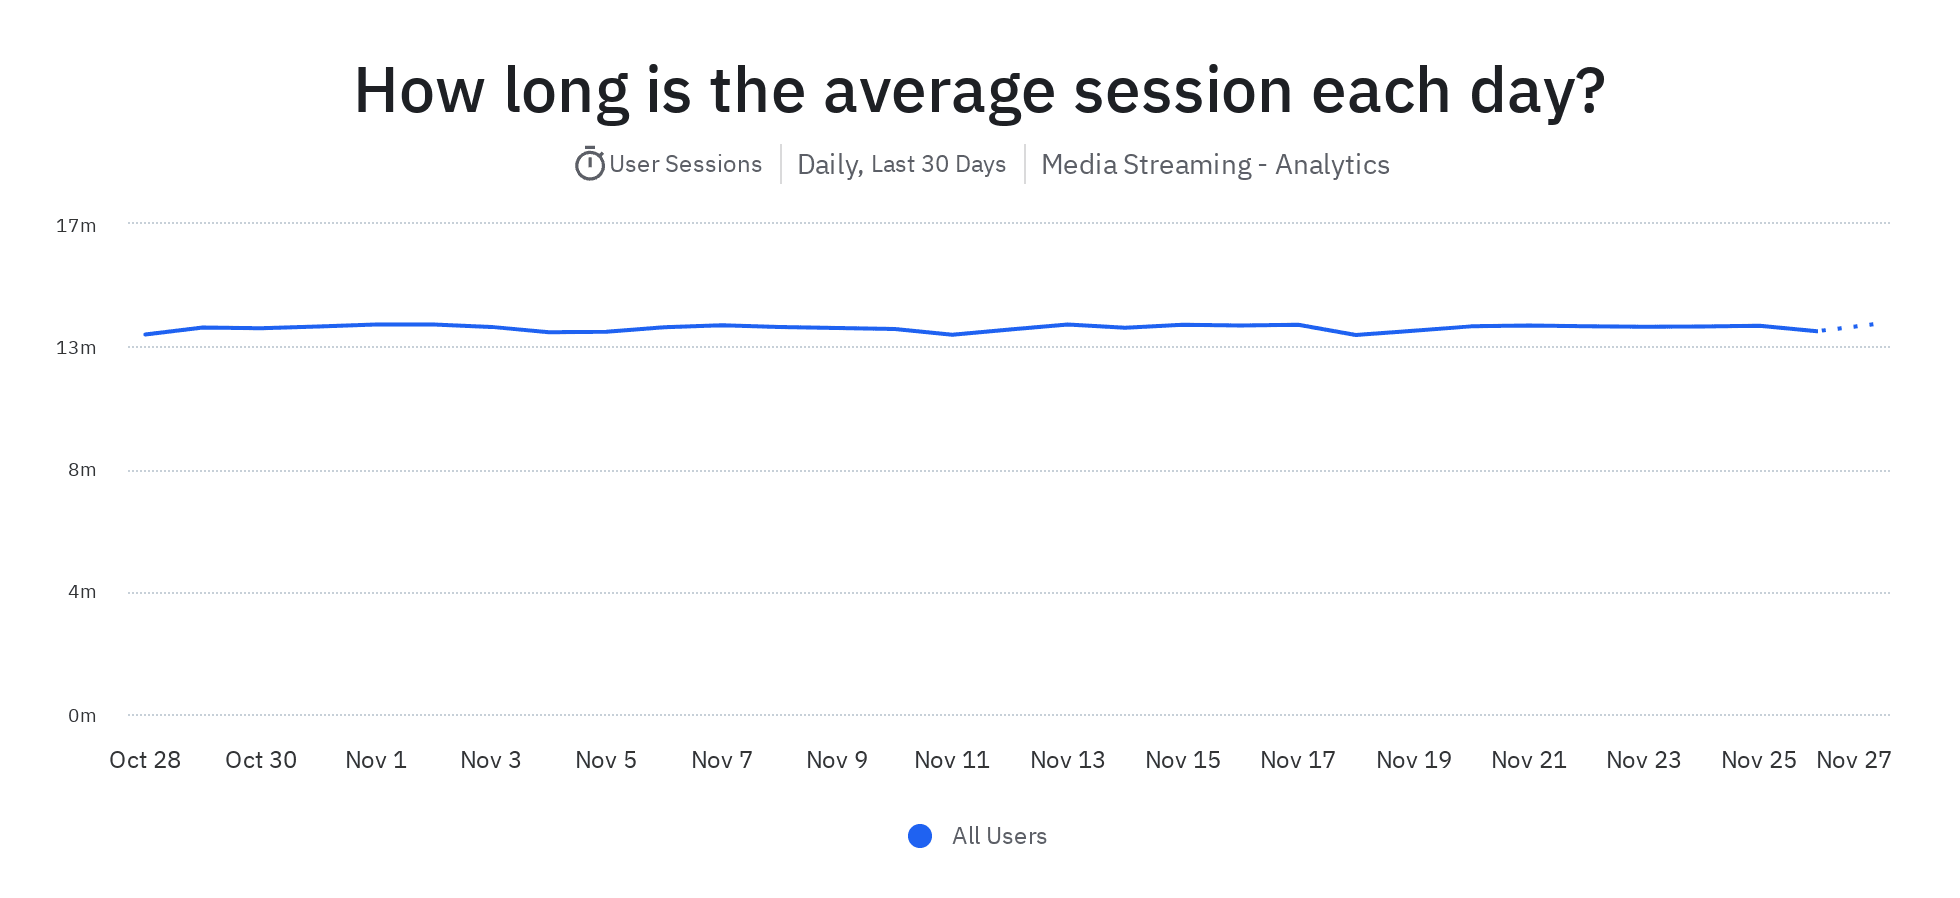
This image is from a demo of Amplitude, a data analytics platform. It shows the average session length over 30 days.
To calculate average session duration for all users or a group of segmented users, add all of the session durations from a specific period and divide that number by the total number of sessions in that period.
- Average Session Duration = (Total Time Spent / Total Number of Sessions)
For example, if you have data for three users with session durations of 2.1 minutes, 1 minute, and 1.4 minutes, the calculation would be:
- Total Number of Sessions = 3 users
- Total Time Spent = 2.1 minutes + 1 minute + 1.4 minutes = 4.5 minutes
- Average Session Duration = (4.5 minutes / 3 users) = 1.5 minutes
One report shows the median value for average session duration for B2B companies as 1.3 minutes. For B2C companies, it’s 1.5 minutes.
4. Conversion rate
Conversion rates show the percentage of people who take a specific action with your product. Tracking conversion rates is essential for understanding how well your digital product performs against business goals.

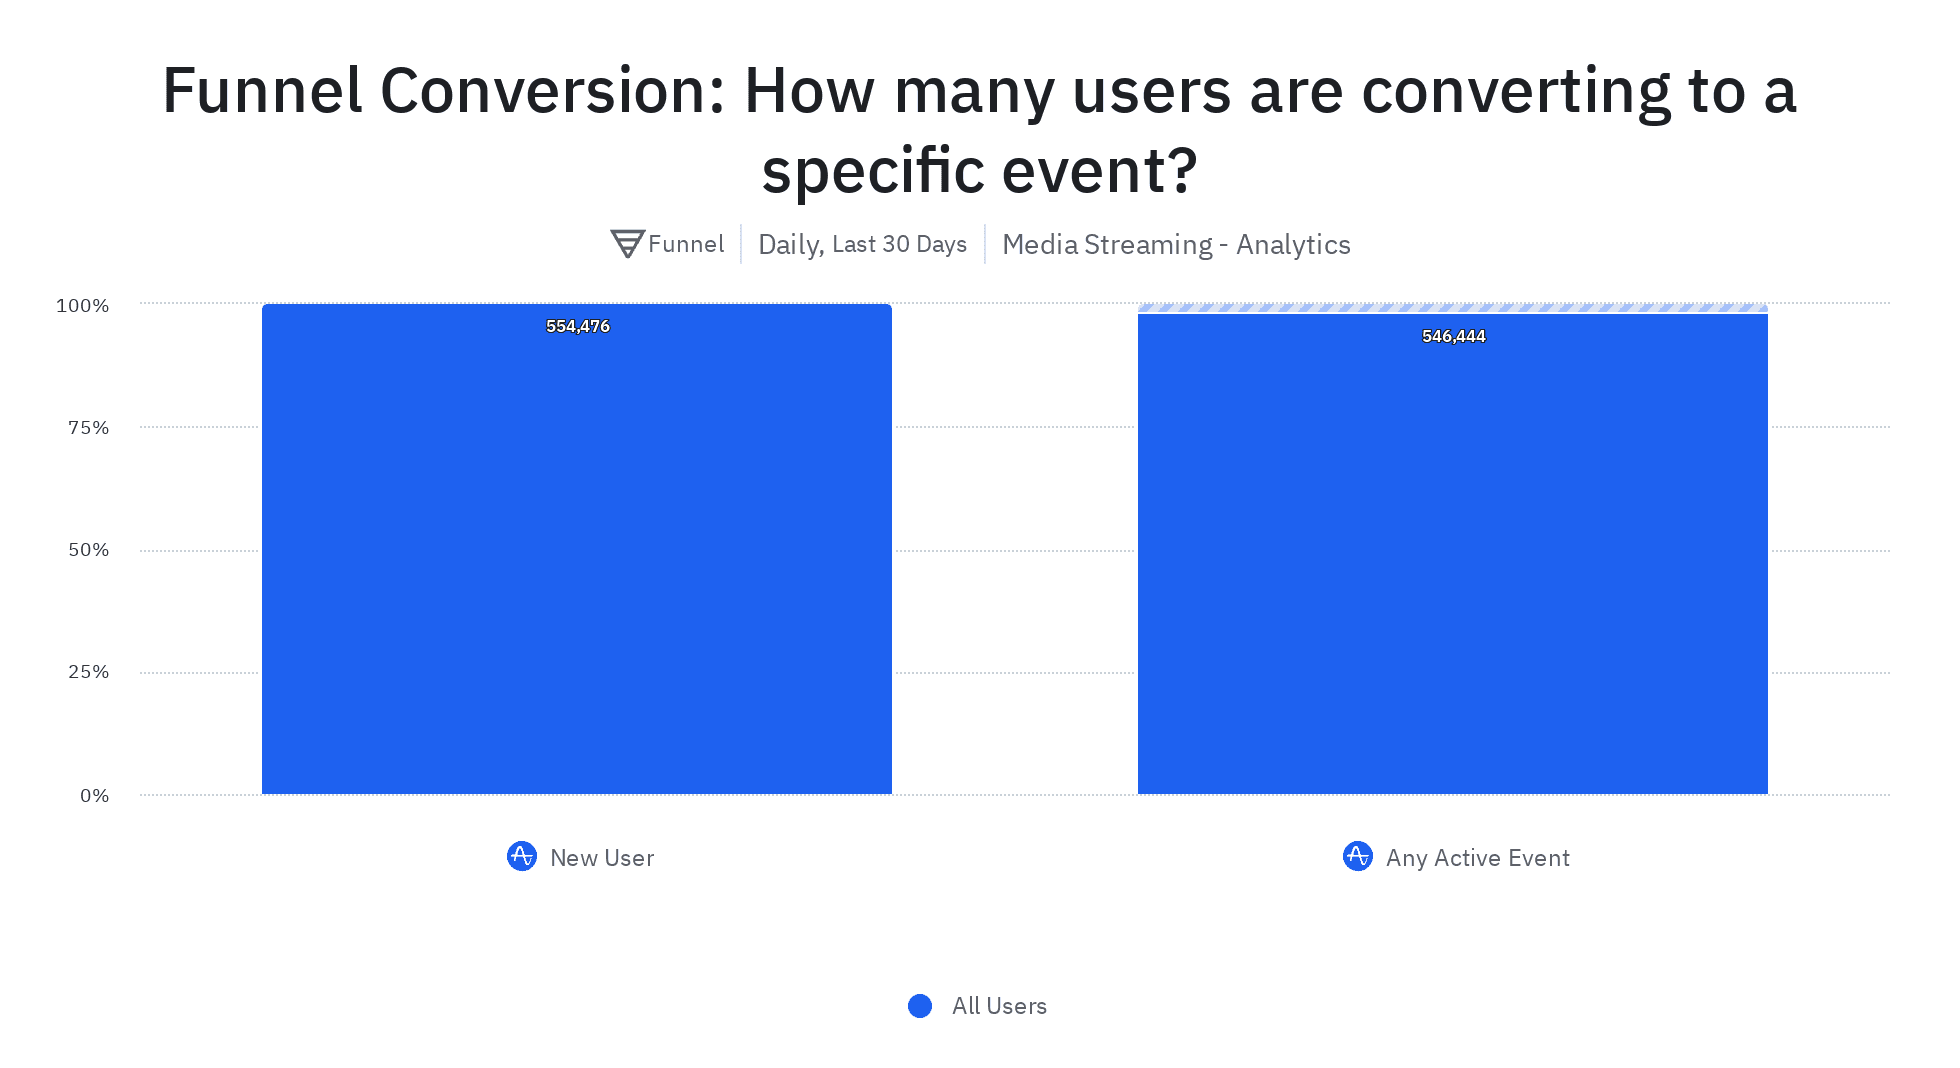
This image from the Amplitude demo shows how many users are converting on a specific event over 30 days.
Common types of conversion rates include:
- Click-through rate (CTR): This measures the number of users who click on a specific link or call to action (CTA) compared to the total number of users who saw the link.
- Sign-up or registration rate: This measures the number of users who complete a sign-up or registration process compared to the total number of users who visited a website or app.
- App download or installation rate: This measures the percentage of users who download and install a mobile app compared to the total number of users who viewed the app’s page in app stores.
To calculate conversion rates, take the number of people who took the action you wanted them to take and divide it by the number of total opportunities (e.g., impressions, interactions, visits, or engagements that users had with your product, website, or app).
- Conversion Rate = (Number of Conversions / Total Number of Opportunities) x 100
For example, suppose your ecommerce store is running an online advertising campaign on Google or social media and wants to calculate the click-through rate. During a specific period, your ad received 500 clicks, and the ad was shown 10,000 times (impressions). Here’s how you would calculate the CTR:
- CTR = (Number of Clicks / Number of Impressions) x 100
- CTR = (500 / 10,000) x 100
- CTR = (0.05) x 100
- CTR = 5%
Or, say you want to calculate the sign-up rate on your website for a particular month. In that month, 500 users created accounts on your website, and 10,000 visitors had the opportunity to sign up. The sign-up rate can be calculated as follows:
- Sign-Up Rate = (Number of Sign-Ups / Number of Visitors) x 100
- Sign-Up Rate = (500 / 10,000) x 100
- Sign-Up Rate = (0.05) x 100
- Sign-Up Rate = 5%
The average global conversion rate is 3.68%.
5. Net Promoter Score (NPS)
An NPS shows how loyal your customers are and how satisfied they are with your product and brand. It gives your product team insights into what’s working and what needs improvement, making it a valuable indicator of overall customer satisfaction and sentiment.
To calculate NPS, ask customers: “On a scale of 0 to 10, how likely are you to recommend our product to a friend or colleague?” You can send this via email or SMS or direct them to a landing page after purchasing or interacting with your product.
Based on their scores, customers are categorized into three groups:
- Promoters (Score 9-10): These are highly satisfied, loyal customers who will likely recommend your product.
- Passives (Score 7-8): These customers are satisfied but could be more enthusiastic. They are less likely to promote your product actively.
- Detractors (Score 0-6): These customers are dissatisfied or unhappy with your product and may even spread negative feedback.
To calculate your NPS, take the percentage of promoters and subtract the percentage of detractors.
Net Promoter Score = % of promoters – % of detractors
Your score will fall below the range of -100 (if every customer is a detractor) and +100 (if every customer is a promoter). If your NPS is above 0, it’s considered “good” because you have more promoters than detractors. Above average is any score over 50.
Use a data analytics platform to monitor and improve engagement
Your user engagement directly impacts revenue. The metrics above show that engaged customers are loyal, satisfied users and promoters of your product.
A data analytics platform like Amplitude helps you analyze customer data to improve user engagement and ultimately boost the success of your product. These platforms enable you to make the most of your content and tailor it to your audience, both critical components of a successful marketing strategy.
For example, with Amplitude, you can A/B test to compare two or more versions of content to see which one performs better. Amplitude enables you to create, distribute, and analyze your A/B content—the platform writes the code that initializes your tests and then captures the results for you so you can continuously improve your content.
To learn more about Amplitude’s platform, try a free demo today.

Pragnya Paramita
Former Group Product Marketing Manager, Amplitude
Pragnya is a former Group Product Marketing Manager at Amplitude. She led the go-to-market efforts for data management products. A graduate of Duke University's Fuqua School of Business, she is passionate about working at the intersection of business and technology and when time allows, cooking up a storm with cuisines from all over the world.
More from Pragnya


