No Need to Tell Us Twice: Dual Y-Axis Support Now GA
Compare metrics at different scales on the same chart to enhance your data storytelling.
This blog post was co-authored by Michelle Lee, group product manager at Amplitude.
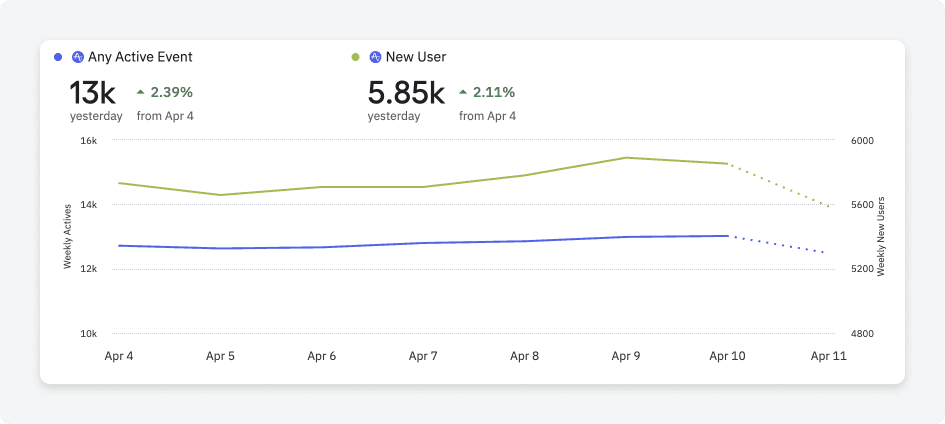
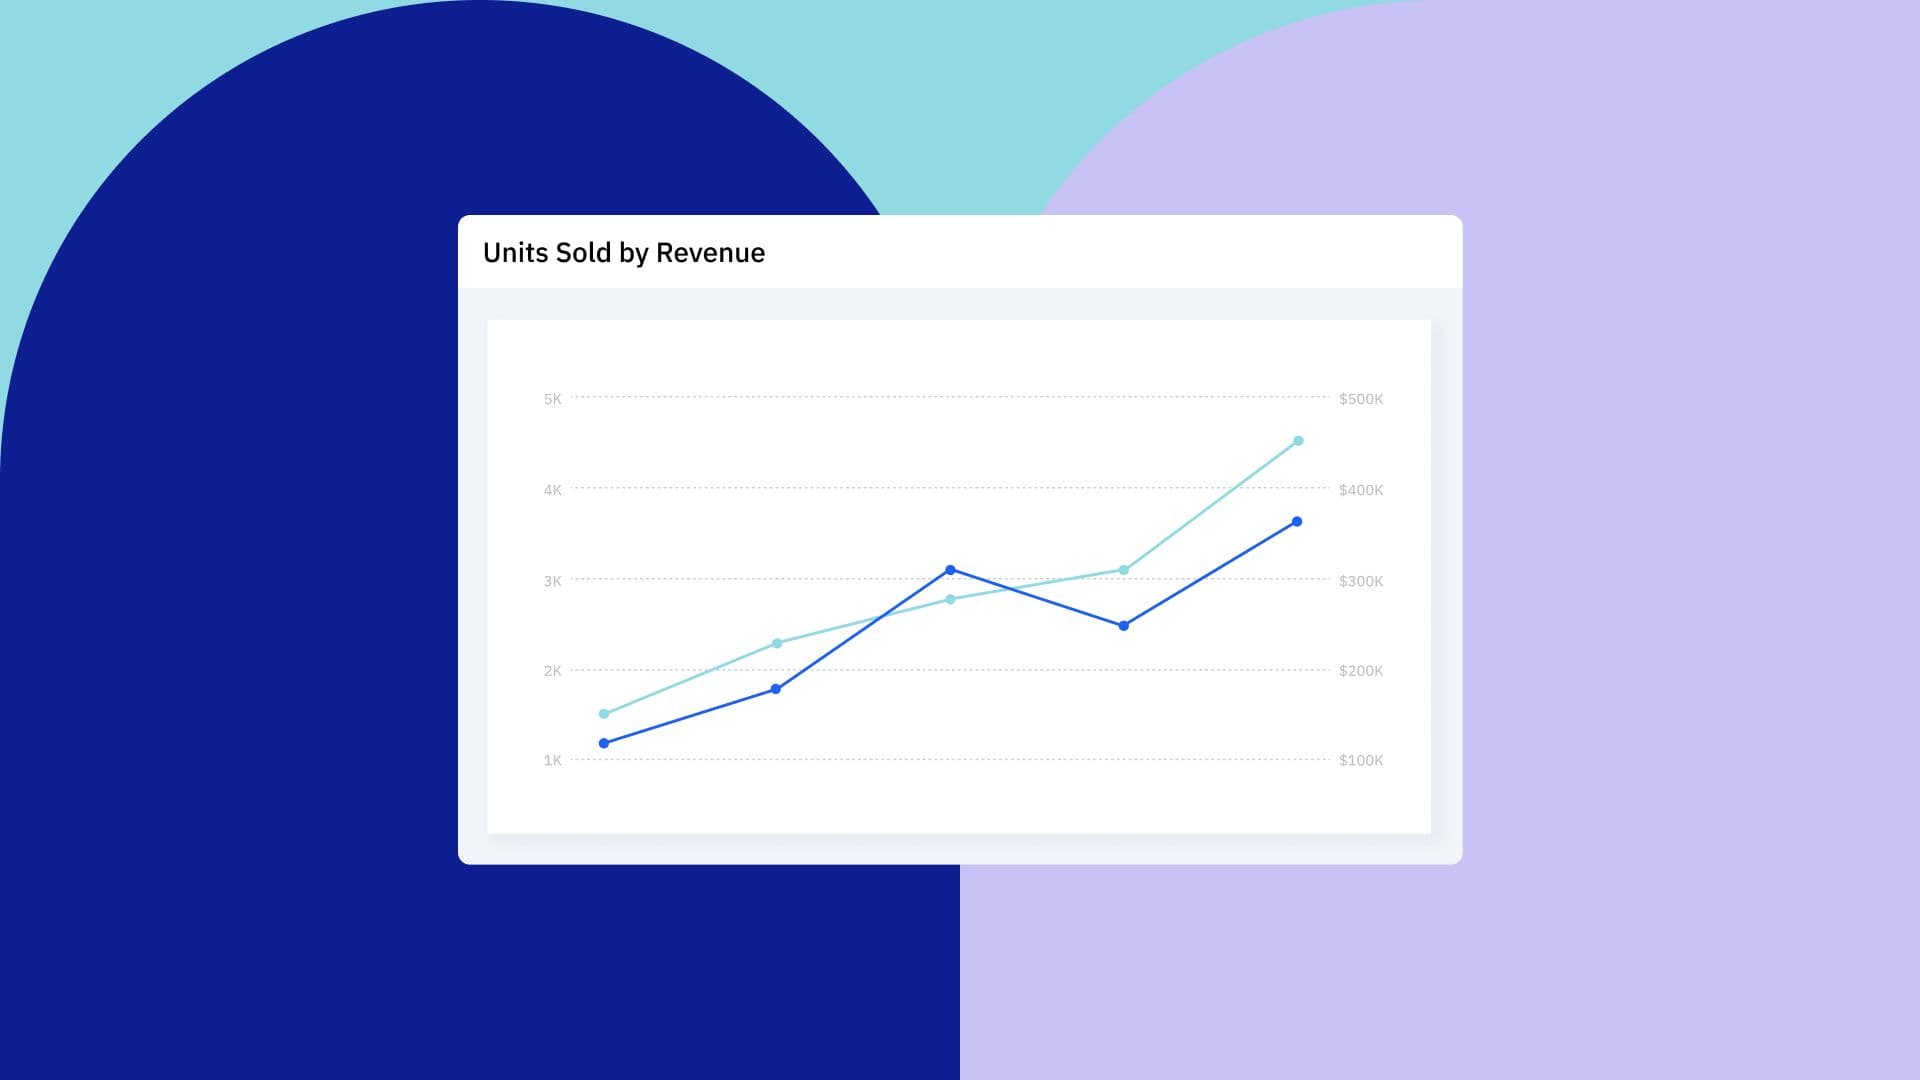
We are thrilled to announce a powerful new addition to Amplitude’s digital analytics platform: dual y-axis support for Segmentation charts!
Having a left and a right y-axis on a single chart has been one of our most common customer requests recently, and our implementation came directly from engaging with your feedback. You’re an integral part of our development team, and we’re super excited to launch this customer-loved feature to help you compare and analyze metrics at different scales.
Why would you need two y-axes?
Say you’re comparing two metrics from a recent campaign, like customer acquisition and conversion rates. You want to see if there’s a correlation between them, and the data is over the same timeframe, so it’d make sense to graph both on the same chart, right?
But your acquisition numbers are in the tens of thousands—and your conversion rates are in decimals. Graphing them on the same y-axis would make conversion rate barely a squiggle at the bottom of your chart. You wouldn’t just lose insights into your conversion data—you’d erase the impact of charting these metrics together.
We’ve had workarounds, like adding two Segmentation charts with two different y-axis scales to a single dashboard, but they’ve been cumbersome to set up, tricky to maintain, and haven’t matched your speed of insight. Two separate y-axes would be simpler and faster.
Doubling down on customer feedback
At Amplitude, product improvement starts and ends with customer feedback. Using tools like ProductBoard, we systematically gather, triage, and prioritize requests and insights directly from our user so we can include “customer love” features in our development roadmap along with our other strategic plans.
Dual y-axis support landed high up on the customer love list. Your feedback underscored the challenges you faced with comparing metrics, how manual workarounds didn’t really work, and how a more flexible visualization tool that could handle complex comparative analyses was critical for your analytical efficiency and success.
Thanks to your feedback, this wasn’t a complex comparison: dual y-axis support had a clear need and a clear demand. So we knew we had to prioritize this customer love feature.
What you can do with our new dual y-axis support
Segmentation charts now let you seamlessly compare high-volume and low-volume metrics in a single chart by adding a second y-axis. How it works:
- Easy axis access: Click on a chart’s default y-axis (on the left) to open a customization panel. Then click Add Right Y-Axis. Now you have two.
- Independent scaling: Each y-axis auto-populates its minimum and maximum values based on the type of event you’re graphing, not on each other.
- Clear customization: Change an axis’s title, scale, position, and even unit of measure to fine-tune the data story you’re trying to tell.

Correlating metrics at any scale makes it easier than ever to see and share the stories in your data. Track new user signups (typically higher-scale) alongside revenue per user (typically a lower scale) to find how acquisition strategies directly correlate with monetization. Or compare feature engagement (hopefully high) to retention rate (a percentage) to understand which user behaviors influence LTV.
By simplifying these comparative analyses, dual y-axis support gets you to data-driven decisions faster.
Two heads (and y-axes) are better than one
Our dual y-axis feature wouldn’t have been possible without your feedback, so thank you to all the customers and community members who gave us input on this (and so many other features too). Amplitude is committed to customer-driven innovation, and your feedback guides every improvement we make on our journey to build the best digital analytics platform.
Dual y-axis support is now available for all customers to use. Explore new correlations by adding another y-axis to your charts—and share the insights you find!
Interested in elevating your feedback? Join the Amplitude Community to connect with us directly—and with other analytics enthusiasts! You can even become a Customer Development Partner to get early access to our new features and help shape them with your input.

Ilankir Matungulu
Senior Product Manager, Amplitude
Ilankir is a senior product manager at Amplitude, focused on scaling the core analytics product to meet the performance and security needs of enterprise organizations. Prior to Amplitude, Ilankir was a senior software engineer turned project manager at Schneider Electric, where he built data applications used in power plants across North America, EMEA and Asia.
More from IlankirRecommended Reading

How Complex Uses AI Agents to Move at the Speed of Culture
Feb 17, 2026
4 min read

The Last Bottleneck
Feb 17, 2026
11 min read

How NTT DOCOMO Scales AI-Powered Customer Experiences
Feb 17, 2026
9 min read

How Mercado Libre Scales Decision Making with AI
Feb 17, 2026
8 min read

