Introducing Experiment Results—Just Bring Your A/B Data
Bring your product A/B testing data and leverage the power of a full experimentation platform

Today we’re excited to announce Experiment Results, a new way for companies to scale experimentation without changing underlying infrastructure.
Feature flags and delivery infrastructure are essential to how modern teams ship product, but when organizations use them for experimentation, analyzing the results and deciding what to do next becomes the bottleneck. Now with Experiment Results, product teams get self-serve, data-science-approved test analysis while keeping their underlying feature delivery infrastructure. Just send your A/B data to Amplitude and Experiment Results will analyze exposures, statistical significance, and metric lifts. Product teams can run more experiments faster, innovate faster, and ultimately make better product decisions faster.
Scaling data-driven experimentation
When you think of innovation at scale, companies like Netflix, Uber, Spotify, and Amazon come to mind. These product teams didn’t get there by accident. They’ve built some of the largest and most sophisticated product experimentation platforms, with the sole purpose of rapidly making data-driven decisions about their products. They’ve taken the guesswork out of whether a new feature or product change will work by running thousands of experiments.
To these elite product teams, innovation happens through rapid experimentation. And they make it possible with highly funded product, engineering, and data science teams who are equipped with boundless resources to perfect their system and process. The rest of us don’t have unlimited resources for data science headcount and custom-built infrastructure.
Luckily, data-driven experimentation at scale is now possible for any product team. And its compounding impact will define your user experience. Take SoFi, for example. As Assaf Ronen, CPO, said, “We had a big debate internally whether we reward people with dollars, or with reward points and I was absolutely sure that dollars is the way to reward people. But then we started experimenting and analyzing the data. And what we’ve learned is that our members want reward points… As soon as we had the data we made that decision.”
While you’ve worked hard to build your own feature delivery and experimentation platforms as well, you’ve told us that scaling the analysis is difficult. The number of experiments product teams can run is limited by the rate that your data science team can analyze the data—an often manual and complex process. Enter Experiment Results.
Make better product decisions faster with Experiment Results
Our release of Experiment Results removes the lengthy manual process of experiment analysis, providing self-service tools for product teams to analyze experiments themselves. Now product teams can continue iterating faster than ever before on things like improving checkout flows, trial signups, regional personalizations, onboarding processes, subscription offerings, and so much more. It enables teams to quickly learn what works, and what doesn’t, all through the power of faster experimentation.
And, Experiment Results gives you the complete flexibility and freedom to use our feature flags or bring your own. As long as your teams can bring that rich A/B data into Amplitude, you can start analyzing experiments immediately.
Everyone wins when the product experimentation becomes self-service:
- Engineers move forward running their next experiments rather than instrumenting and porting data
- Product managers have self-service tools to analyze their own experiments faster rather than submitting requests and waiting on data scientists to run reports.
- Data scientists are free from the routine manual analysis of experimentation data, allowing them to work on even more impactful projects for the business.
A Fortune 500 file-sharing company came to us with a sophisticated experimentation platform already in place. However, their process for analyzing the data is manual and lengthy, and significantly limits the number of experiments they’re able to run each month. They’ve adopted Experiment Results as a tool that allows their product teams to automatically analyze their own experiments, freeing up the data science team from manual and routine statistical significance calculations and analysis. Experiments that used to take them six weeks to analyze have been reduced down to just over a single week.
Empowering teams to make better product decisions faster
Goal setting made easy
Incredible experimentation starts with setting goals and metrics. Now you can use all of the rich behavioral data, Metrics, and events already in Amplitude to pick the right metric to impact. It’s the benefit of having experimentation delivered from the #1 product analytics solution and the Amplitude Behavioral Graph.
True experimentation planning and hypothesis creation, all in one spot.
Analyze with a built-in stats engine
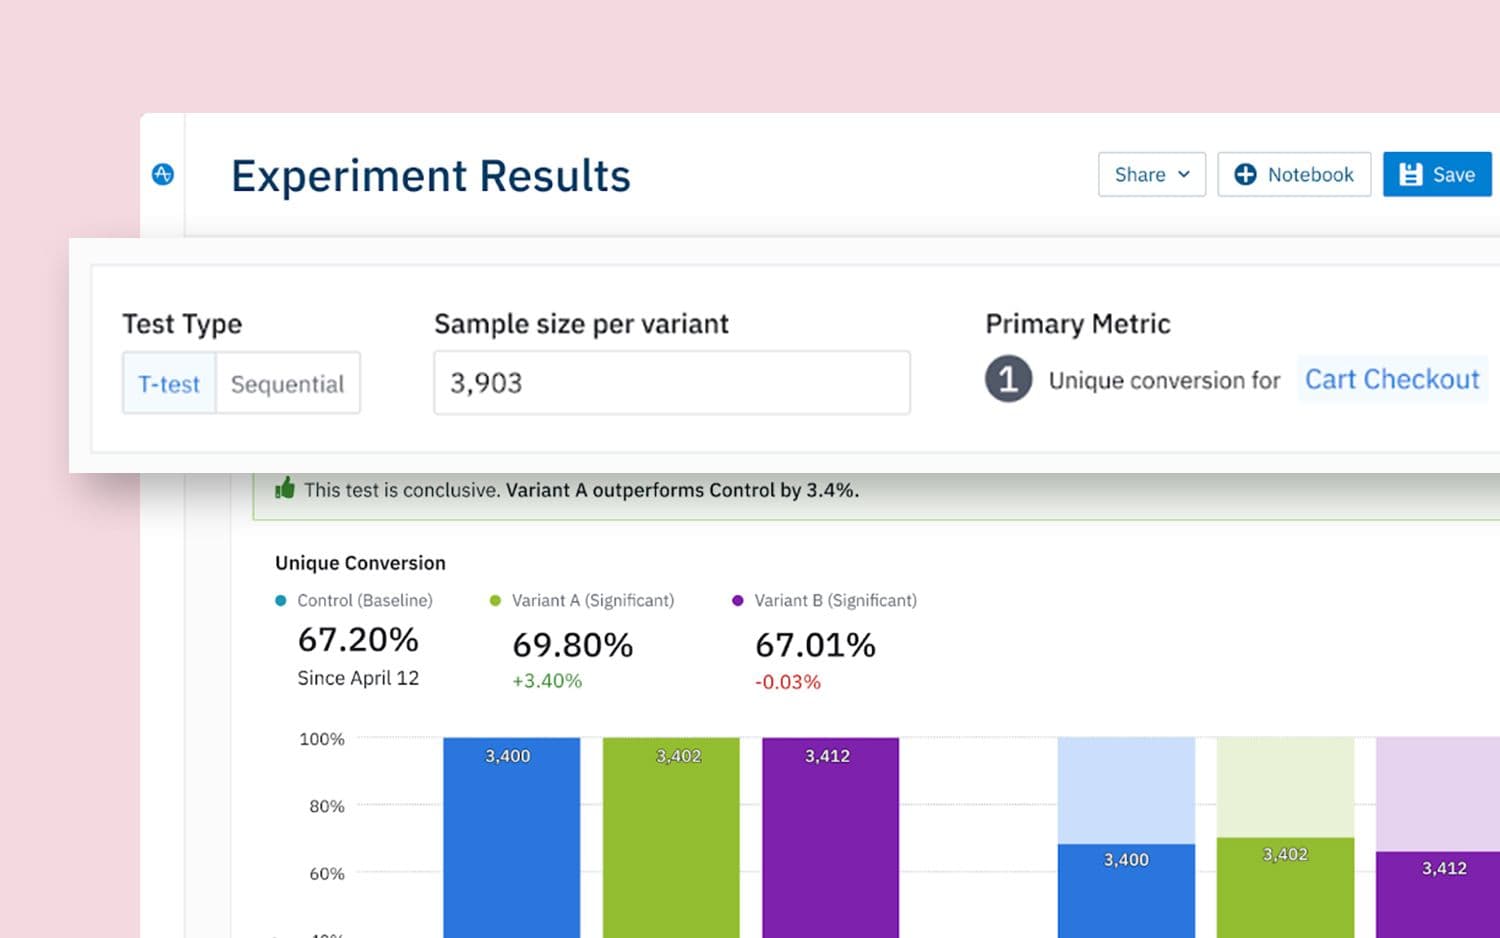
Once your teams are delivering the experiment, and the A/B data is brought into the Amplitude Behavioral Graph, teams can start analyzing the data immediately with our peak-proof, sequential-testing stats engine. Our engine will track exposures, calculate statistical significance, and measure lift in the metrics that matter most to your business.
All that rich experiment data is made available in Amplitude Analytics, for even further analysis and cohort segmentation, something no other experiment product can provide.
Test, learn, and decide as a team
We truly believe that experimentation is a team sport, and sharing what you learn is critical to success. But not just within the product team. Like everything inside Amplitude, we treat collaboration as a first-class citizen. You can add your latest experiment results directly into a dashboard where you can annotate, comment, and share your findings with cross-functional stakeholders.
Analytics and Experiment Results, side by side, all in one place.
Easy-to-consume reports not only make decision-making easier, but they uplevel the data literacy and collective knowledge of your entire organization.
Now, finally, scaling experimentation isn’t only achievable by the largest companies in the world. With Experiment Results, your teams can make better product decisions faster.
Learn how Experiment Results can help your teams accelerate the number of experiments you can run today and achieve true scale. Request a demo, or learn more about Experiment Results by streaming our Amplify conference keynote live today, Wednesday, May 25, or on-demand.
Thank you to the team
We say that experimentation is a team sport. So is building Experiment Results! We wouldn’t be able to share this exciting announcement without the incredible passion and hard work by the very people involved. Thank you to everyone!
Engineering, Design, & Product:Ye Rin Cha, Ian Go, David Mann, Wil Pong, Akhil Prakash, Shelley Wang, Larry Xu
Go to Market: Chelsie Cauthon, Haley Cen, Jess Chiu, Spencer Fleury, Michael Heriford, Harvey Liu, Grace Lynch, Aly Mcgue, Jake McKibben, Maria Newman, Rachel Torres, Audrey Xu


RJ Gazarek
Former Group Product Marketing Manager, Amplitude
Formerly Group Product Marketing Manager at Amplitude, RJ has been in product marketing for 10 years working at tech companies of various sizes, largely in either Cybersecurity or the Dev/DevOps spaces. He has a strong focus on B2B, Midmarket & Enterprise, and PLG motions.
More from RJ


