9 Tips for a Successful Website User Experience Analysis
Learn how to perform a website user experience analysis and better understand your customers and prospects.
Originally published on October 30, 2022
Browse by category
Running a website user experience analysis uses up a lot of your team’s resources. So whenever you do one, you’ll want to squeeze out as much as you can from it to learn how your people experience your website, and more importantly, what changes you need to do to improve it.
In this post, we’ll take a look at a few best practices for an effective and efficient website UX analysis.
Key Takeaways
- Make your core business metric the driving force behind what you measure during a UX analysis. This ensures everyone in the company is more inclined to implement any recommendations you may make to improve user experience. Use the HEART framework and the Goals-Signal-Metrics process to identify which UX metrics are most important for user experience while taking into account the business goals.
- Conduct a heuristics analysis to quickly find where users get stuck. NN Group’s heuristics analysis guideline should set you off right.
- Map out the customer journey before conducting a UX analysis using Amplitude Analytics or the AIDA framework. Your website UX analysis can then focus on the different stages before purchase to see where people get stuck.
- Make sure your implicit biases don’t skew with how you conduct the analysis or interpret the data. Recognize that they exist and put precautions in place to stop them from influencing your research. For example, you can go into the research seeking evidence to falsify rather than confirm your assumptions.
- Lean on small UX changes that you can easily track rather than a website overhaul when making recommendations in your reports.
- Triangulate data analysis using both quantitative and qualitative analysis. Do quantitative analysis using product analytics tools like Amplitude Analytics as well as heat mapping tools like Hotjar, Lucky Orange, or Microsoft Clarity. To know more about the why behind user behavior, use qualitative analysis methods such as customer interviews, usability testing, and surveys.
- To ensure the implementation of your recommendations, collaborate with the product design and customer-facing/revenue teams from the onset and present your report after the analysis in a digestible and easy-to-understand manner.
Website User Experience Analysis Overview
A website user experience analysis is a set of processes that measure the satisfaction of website visitors, how easy it is for them to navigate the website, and where they get stuck or drop off from it.
You usually do a UX analysis of your website after it’s been redesigned or before you start a conversion optimization experiment. Why? So that you rely on data instead of your intuition when doing experiments or making changes.
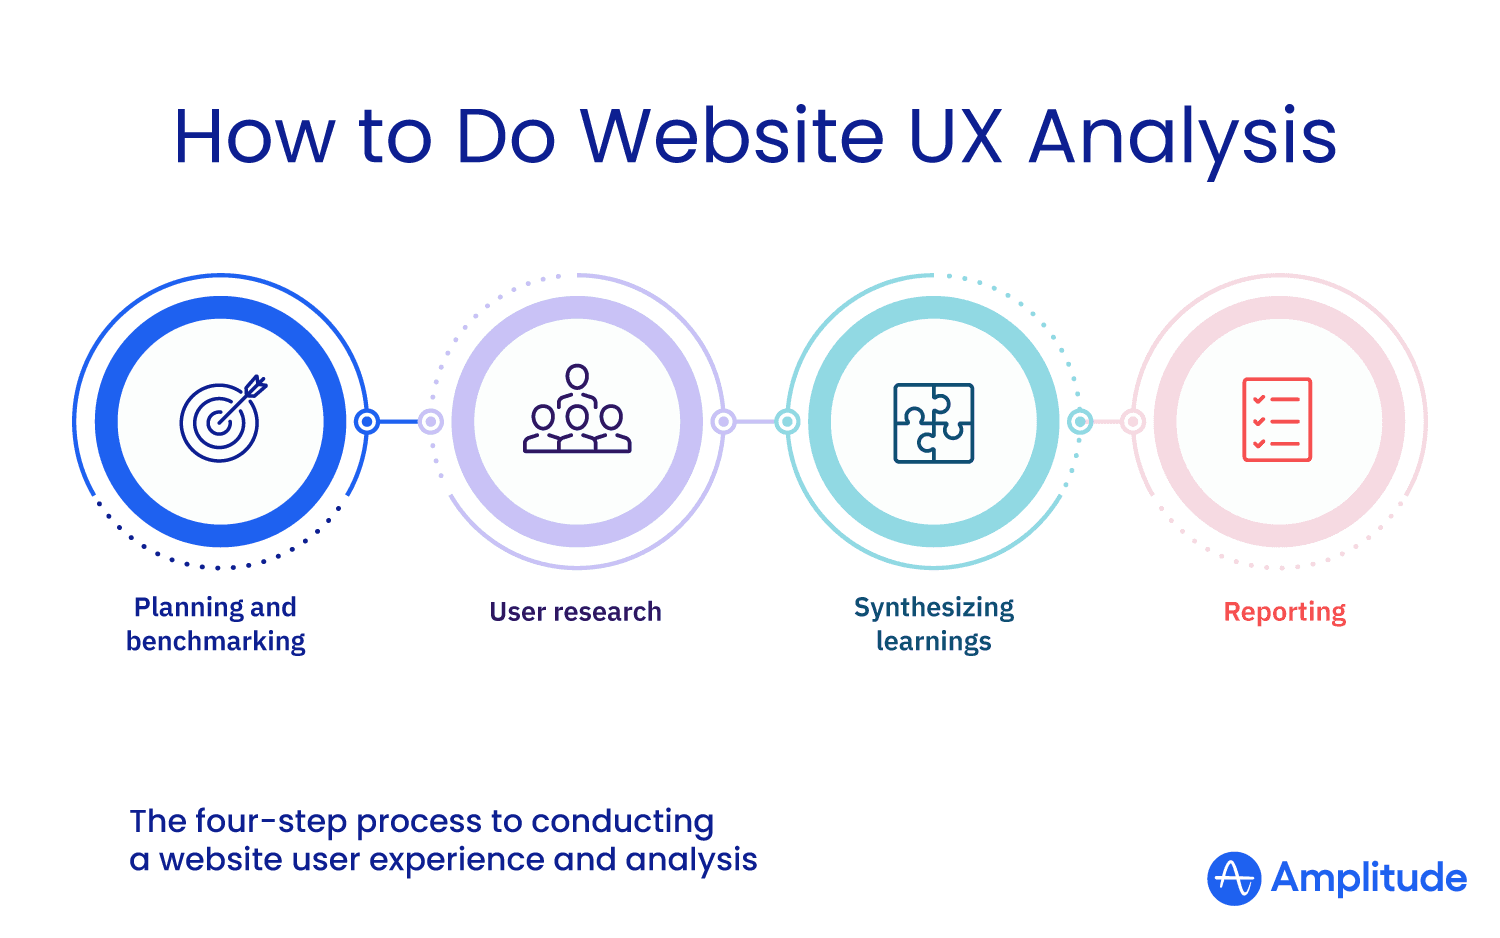
A typical website UX analysis follows these four steps:
- Planning and benchmarking
- Conducting user research analysis
- Synthesizing learnings
- Sharing results and reporting

9 User Experience Analysis Tips & Best Practices
1. Start with the core business metric
Eric Itzkowitz, Director of Funnel Optimization at McGaw.io says, “Everything has to point back to the business core metric. To make UX, testing, and CRO worthwhile, you have to understand ahead of time what you want visitors to do, and what is the core goal you need to succeed.”
He adds, “A lot of businesses have product metrics and KPIs that are lofty but don’t always drive back to the main goal of the business. Always ask, ‘What do you want to accomplish? Is it really free trials or is it the number of trials that convert into a paying user?’
Using the core business metric as your beacon when conducting a website UX analysis, it’s much easier for other departments to act on any of your recommendations after the analysis.
This alignment can go a long way to ensuring that your analysis isn’t just a document that people look at once and then forget.
2. Track the right metrics
There’s a fine line between optimizing user experience and staying true to your business goals, as too much optimization can sometimes hurt the core usability of your website.
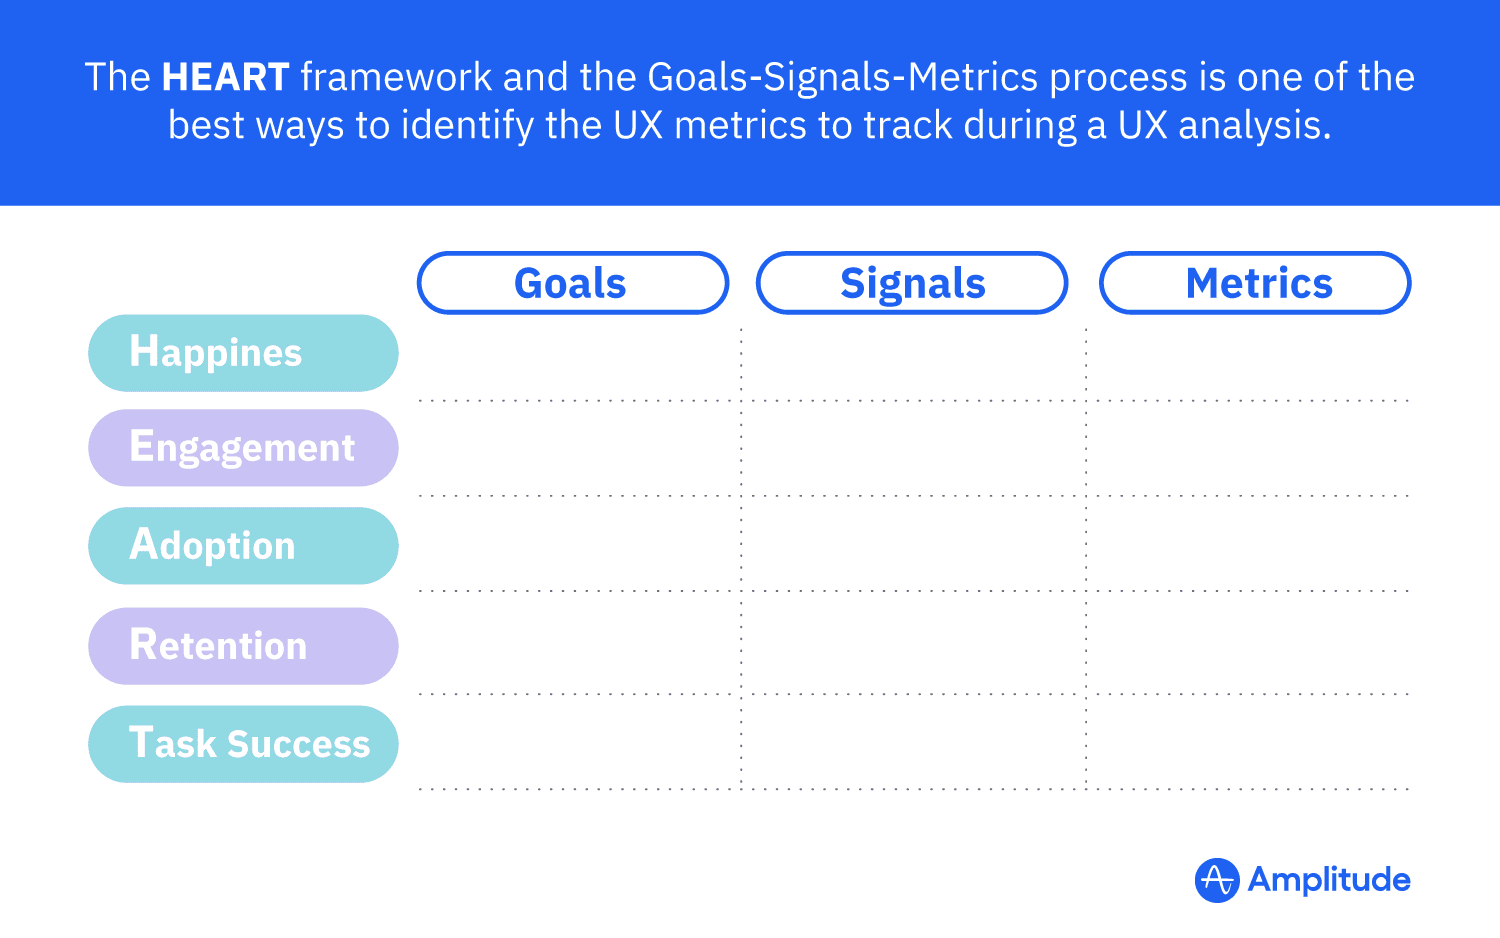
The HEART framework and the Goals-Signal-Metrics process, developed by Google, will help you ensure this doesn’t happen. The HEART framework measures the impact of UX changes based on five factors: happiness, engagement, adoption, retention, and task success. The Goals-Signals-Metrics process then further evaluates these five factors to figure out which specific metrics to focus on.
Once you’re clear on metrics to track:
- Identify the best-fit users for the website user experience analysis.
- Decide which tools are relevant for the metric you’re tracking.
- Remember to be wary of vanity metrics that look and feel good but are not likely to help with achieving business goals. They include social media shares, number of downloads, and page views.

3. Run a heuristics analysis especially if you have limited resources
You may not always have the time, the budget, or the people to do a full-blown website UX analysis. This doesn’t have to be a reason to put off user research and analysis.
Start with a heuristics analysis in which you evaluate your website based on UX best practices to identify possible usability issues.
NN Groups’ heuristics analysis guideline is commonly used for this even though it’s not been evaluated. You can find an alternative research-based ISO heuristics analysis in the Ergonomics of human-system interaction – Part 110: Dialogue principles.
If a heuristics analysis is not possible, Eric Itzkowitz recommends going through critical pages of your site and asking yourself the same questions that people ask whenever they find themselves on your website:
- Am I in the right place?
- How do I feel about the site that I’m seeing?
- What do I need to do and what’s my next step?
4. Conduct a funnel analysis and examine user issues at each step of the funnel
Don’t limit your analysis to one page. There’s so much more value when you assess a user’s experience on your entire site. Map your customers’ path to purchase to help identify which pages need your immediate attention and which metrics — closely related to your goal – to focus on during the analysis.
You can map the customer journey using the AIDA framework. If you want a more data-driven and less time-consuming solution, use Amplitude’s Journeys feature.
5. Beware of your implicit biases such as the confirmation bias
Everyone has cognitive biases that can be manifested in a website UX analysis setting. This affects the way you conduct user testing or how you interpret research results.
The first step to overcoming these biases is by being aware that they exist. The next step is to put precautions in place to limit their influence during your research.
Confirmation bias, which is cherry-picking information to support your assumptions, is one of the common implicit biases. Instead of looking at what the data is telling you, you unconsciously look for evidence to reinforce that which you already believe.
To reduce the damaging influence of this bias, follow these steps:
- List down your assumptions before the start of your research, and seek evidence to falsify rather than confirm them.
- Whenever possible, get a third party to look at the analysis results. You can also have them sit in during an on-site user testing to make sure that you don’t just ask questions that are geared towards confirming your assumptions.
- Triangulate data from multiple sources. Use analytics software like Amplitude. Talk to customer support, or observe users in a user testing lab.
6. Always start with a benchmark test
A benchmark test will give you a baseline for your website’s UX metrics. With these baseline metrics, you can compare the performance of your website over time.
Standardize this benchmark test based on metrics that are important to your business. Then use this set of metrics to evaluate website UX every time you make changes to your site.
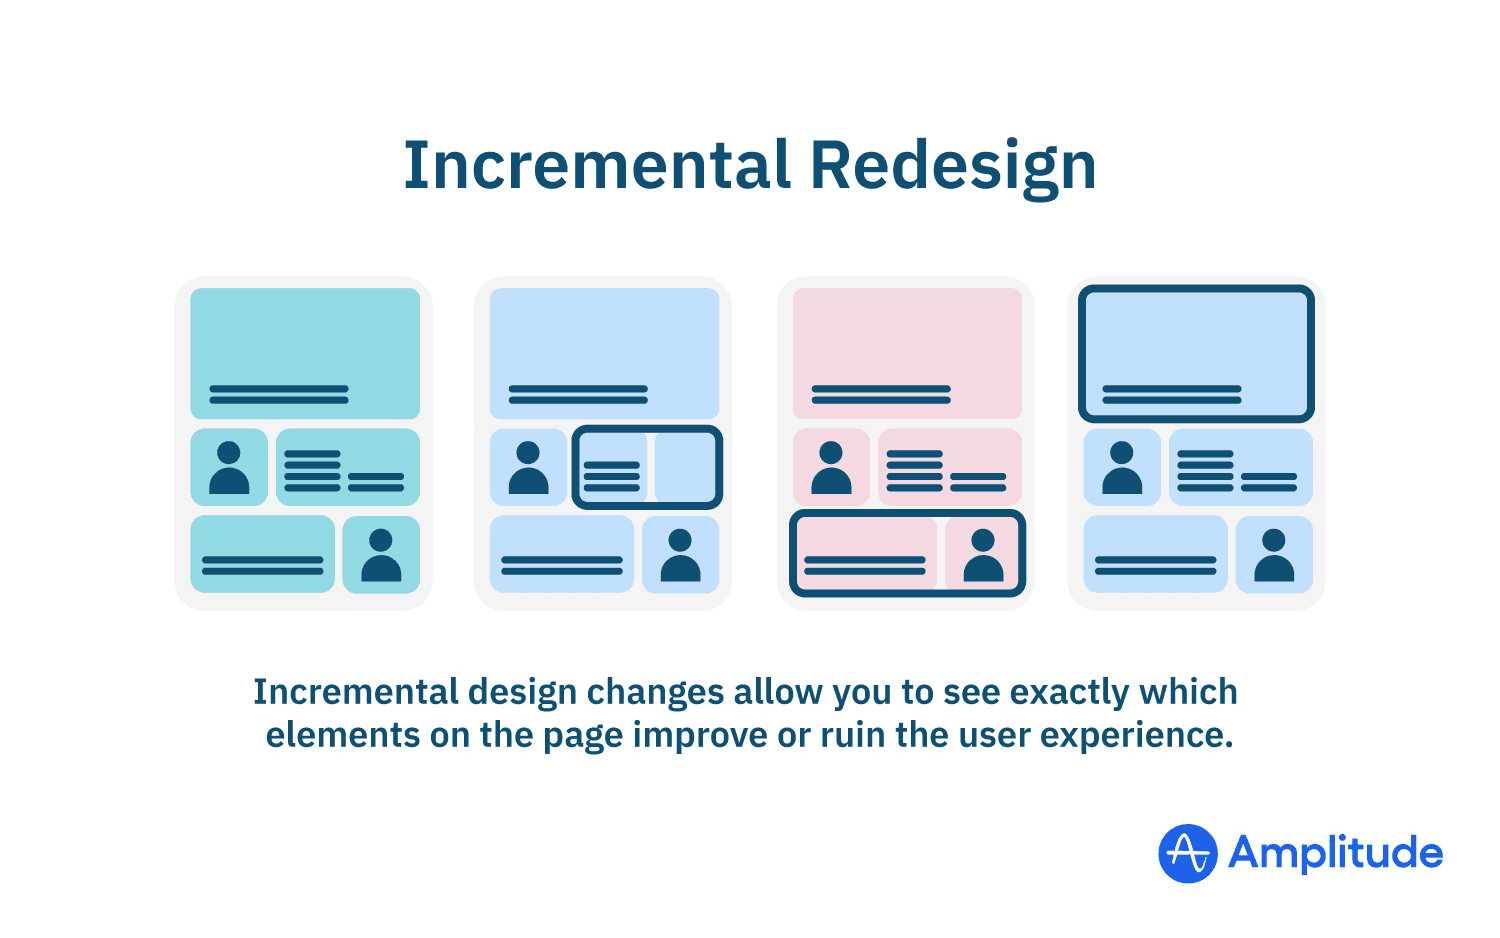
7. Opt for incremental changes rather than a site overhaul
A website overhaul is often not necessary to improve your website’s UX performance. Apart from it being a big risky project that may take a lot of time for a complete overhau, itl will often not show you the details of which exact website elements are negatively impacting user experience.
We recommend small changes to your site first before embarking on a full site overhaul. This way you can test different elements at different times and get precise data on exactly how those elements affect user experience.

8. Collaborate with the UX team in your company
Nielsen Norman Group says there’s an overlap between product management and UX professionals in most companies. And that they’re not usually aligned on who is responsible for what. This misalignment can sometimes result in duplicating research or animosity between two vital teams that are central to the implementation of any insights your UX analysis will gather.
To foster a more streamlined process, when it’s time to implement changes, a collaboration between these departments will help produce better results.
9. Have a moderator when doing on-site website usability testing
Website usability testing is valuable in observing how users behave while on your site. However, it’s only as good as the quality of the moderator running the test.
There’s an art and a science to asking questions and getting respondents to share exactly what they’re thinking as they go through the site. A trained moderator who knows how to build rapport with respondents in a research setting ensures that you get the most relevant data from web usability tests.
Qualitative vs. Quantitative Website UX Analysis
You’ll get a more reliable website UX analysis when you use both qualitative and quantitative data to support your findings.
Quantitative UX research looks at user behavior in terms of numbers such as page views, how long it takes to complete a task, which links people click, and how high the conversion rate is.
Qualitative UX research digs deeper into the why of the user behavior and is obtained through surveys, customer interviews, or on-site user testing.
Some methods are better suited than others depending on the metric you’re tracking. For example, you can track drop-off points at every stage of the funnel by using Amplitude Analytics. You can also use Amplitude’s Personas chart to find your website or product’s user personas or Lifecycle chart feature to track their overall growth.
Tools to Help with User Research
The tools you use for website user analysis depend on what you want to measure.
For example, if you want to test how intuitive page categorization and navigation are on your site, a tree testing tool can help you optimize both of these things with low effort. But if you want to see how a user interacts with a web page, you can run usability tests followed by user interviews.
Some common tools to help with user research include:
Quantitative UX Analysis Tools
- Heatmap tools like Hotjar, Lucky Orange, and Microsoft Clarity
- Funnel analysis tools like Amplitude Analytics
- Tree testing and card sorting
Qualitative UX Analysis Tools
- Targeted surveys
- Lab user testing
- Customer interviews
How to Make UX Improvements From a Web Analysis
You’ll know that a website UX analysis is successful when the different departments in the company incorporate your recommendations in their strategy and act on them.
To ensure this smooth implementation process, follow these two steps.
1. Prepare the results of the analysis in a way that is easy for key decision-makers to understand
At the end of a website UX analysis, you’ll need to synthesize all the research results you’ve gathered. This report can make or break the implementation of UX improvements.
Prepare and present your report in a way that key decision-makers, the internal team, and any stakeholders, can easily understand what needs to be done. There should always be a leave behind deck or resource that can be understood on its own.
Some guidelines on how to do this:
- Pull out the key findings in your research.
- Succinctly organize the key findings in one report for a general audience.
- Prepare different reports for different departments, focusing on tasks that affect them.
- When presenting the reports, make them engaging with actionable recommendations. Leave the large amount of data you’ve gathered in a separate document that they can refer to and read at their leisure. Present the report using a thoughtfully organized presentation. Use these Google Slides templates for inspiration.
- Map out the recommendations using collaborative tools like Miro.
- Make it clear what can happen if recommended changes are not implemented and things are left as is.
- Make it clear which actions need to be taken right away and which ones are lower down the priority list.
2. Run A/B Tests Before Releasing New Changes to All Users
A/B testing ensures that you employ a scientific process to test recommendations and assumptions.
Start by testing the top priority pages that need immediate attention. Look at which changes will yield the best results. The VICE framework by McGaw.io helps you quickly vet different hypotheses against each other—before the experiment—to see which ones are most likely going to work.
Once you’ve identified which hypothesis to test first, use an A/B testing tool like Amplitude Experiment to facilitate the experiment and see what changes get the best results.
Summary
Websites thrive on change. And every change invariably affects the overall user experience.
Since UX is a major defining factor in conversions, a website change should be followed with a user experience analysis so that you can objectively see how the impact of the changes affects the users’ experience.
By following these best practices, you can be sure that you get as many insights as possible from your research to help improve the customer experience.
References
- User Experience Basics, Usability.gov
- What is User Experience (UX) Design?, Interaction Design Foundation
- A UX review template anyone can use, Vernon Joyce for UX Planet

Jake McKibben
Product Designer, Amplitude
Jake McKibben is a product designer and former art director at Amplitude, where he specialized in illustration and web design. Previously, he was an independent designer and designer at Localytics.
More from Jake


