Why Clevergy Uses Amplitude to Understand Its Users
Discover why Clevergy uses Amplitude to better understand its users and how it enabled them to boost conversion rates to 24.7%.
This post was originally published on Clevergy’s blog and is co-authored by Álvaro Pérez Bello, co-founder and CPO of Clevergy, and Jesús Luque Reyes, product manager at Clevergy. Clevergy is a Spanish company transforming the energy industry by providing consumers with a more transparent and sustainable way to track their energy consumption.
Introduction
At Clevergy, we have a strong data culture. From day one, engineering and product teams have considered it essential to instrument the product and systems to make better decisions. Our data strategy is based on two main pillars: traceability of domain events and independence in queries.
In the product, we log all domain events in BigQuery. This means all events related to domain entities in the platform are stored in a database. Thanks to this process, we can review and audit all events within the Clevergy systems. If you're curious, you can learn more about the technical details in this blog post.
In addition to storing data in BigQuery, we make each person responsible for running their own queries in BigQuery. Although learning SQL has a steep learning curve, data becomes accessible to anyone on the team. As a result:
- We have all application events recorded so we can audit any user flow.
- We can understand the history of a metric without needing to ask engineering to instrument that new flow.
- There is 100% reliability between the data we analyze and the data we have in the operational databases.
- It is decoupled from production. A query that analyzes our entire history will not affect production performance.
The problem with BigQuery
So why did we consider using Amplitude?
BigQuery in itself is not a user-focused analytics tool. It is a database that handles large volumes of information very well. While we do analytical queries in BigQuery to understand how the platform behaves, it is difficult to query and analyze user behavior patterns.
We can infer a login based on login and module loading requests. But once the information is loaded, do users stay for an hour? Five minutes? What happens to people who registered last week compared to last month?
The closer the question gets to user behavior, the more complicated the query becomes.
We considered logging these application events in BigQuery, but it would require developing a collection and analysis engine. So we discarded this approach as we do not have enough resources to develop and maintain such a solution.
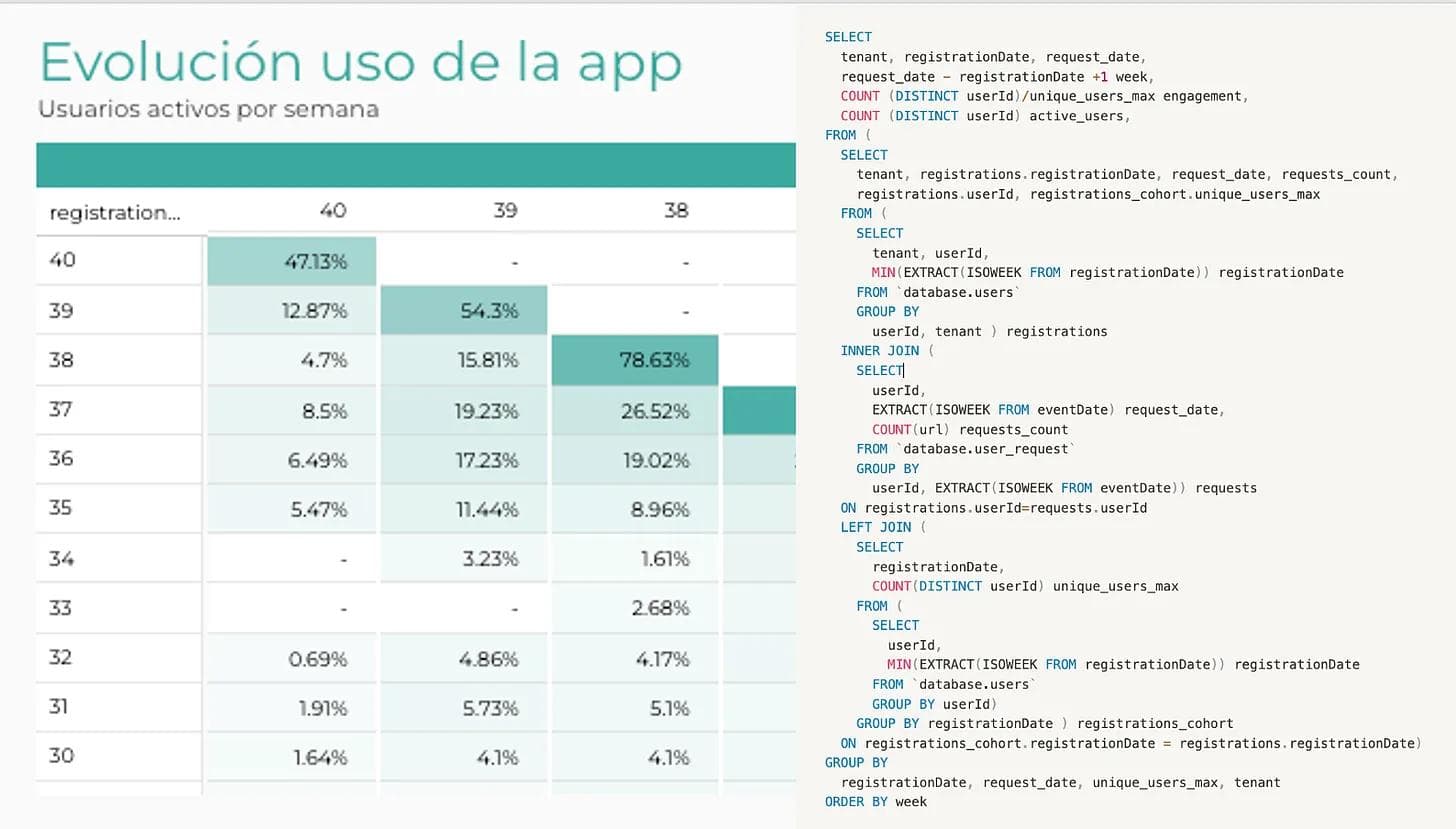
To see the complexity of the analysis, we have attached the cohort analysis we performed on users who register in the application. To create this graph, the product team had to invest approximately eight hours and still were unable to make the query flexible enough to filter by customers.
This meant that:
- We dedicated extra resources to something that did not provide inherent value (performing a query to view data).
- It required a high level of learning, and not everyone on the team could perform these queries.
- It was slow to obtain the data we needed. Knowing the high effort it took to extract this kind of data, we didn't measure it because it was not a "priority."
Amplitude, our best option
When we realized we needed a change, we started exploring different options, particularly the Amplitude startup program.
Amplitude is an analytics platform that enables companies to easily associate user behavior in our app through graphs and collaborative analysis, most of which are already created.
Before fully implementing the tool, we verified two essential factors:
- First, we needed to ensure that it would solve our main problem: agility in answering business-level questions about user behavior. This includes the implementation time by the development team to creating a dashboard by anyone on the team.
- Second, we needed to trust the data. We needed to trace and compare the metrics we saw in Amplitude with the information in BigQuery to grow with both systems. To do this, we analyzed that there was less than a 1% deviation in some basic metrics such as registered and active users.
The Starter plan was sufficient to play around with the tool and verify these hypotheses, so we decided to implement our analytics system in Amplitude.
First steps in Amplitude
The Amplitude team was attentive during the implementation and helped us focus our testing efforts. To do this, we decided not to capture all the default information collected by the Amplitude SDK, as it generated many events that were not relevant to our use cases.
In this regard, Amplitude has a philosophy of analytics that is opposite to ours using BigQuery. The less you monitor, the better it is.
We decided to define which use cases we would measure and track specific events for them. After a week of defining the flows and another week of implementing the tracking in the tool, we started to have our first data insights.
First, we tried to perform the same cohort analysis I showed before, which we did with BigQuery and Looker Studio. This time, it took us two minutes to do it.
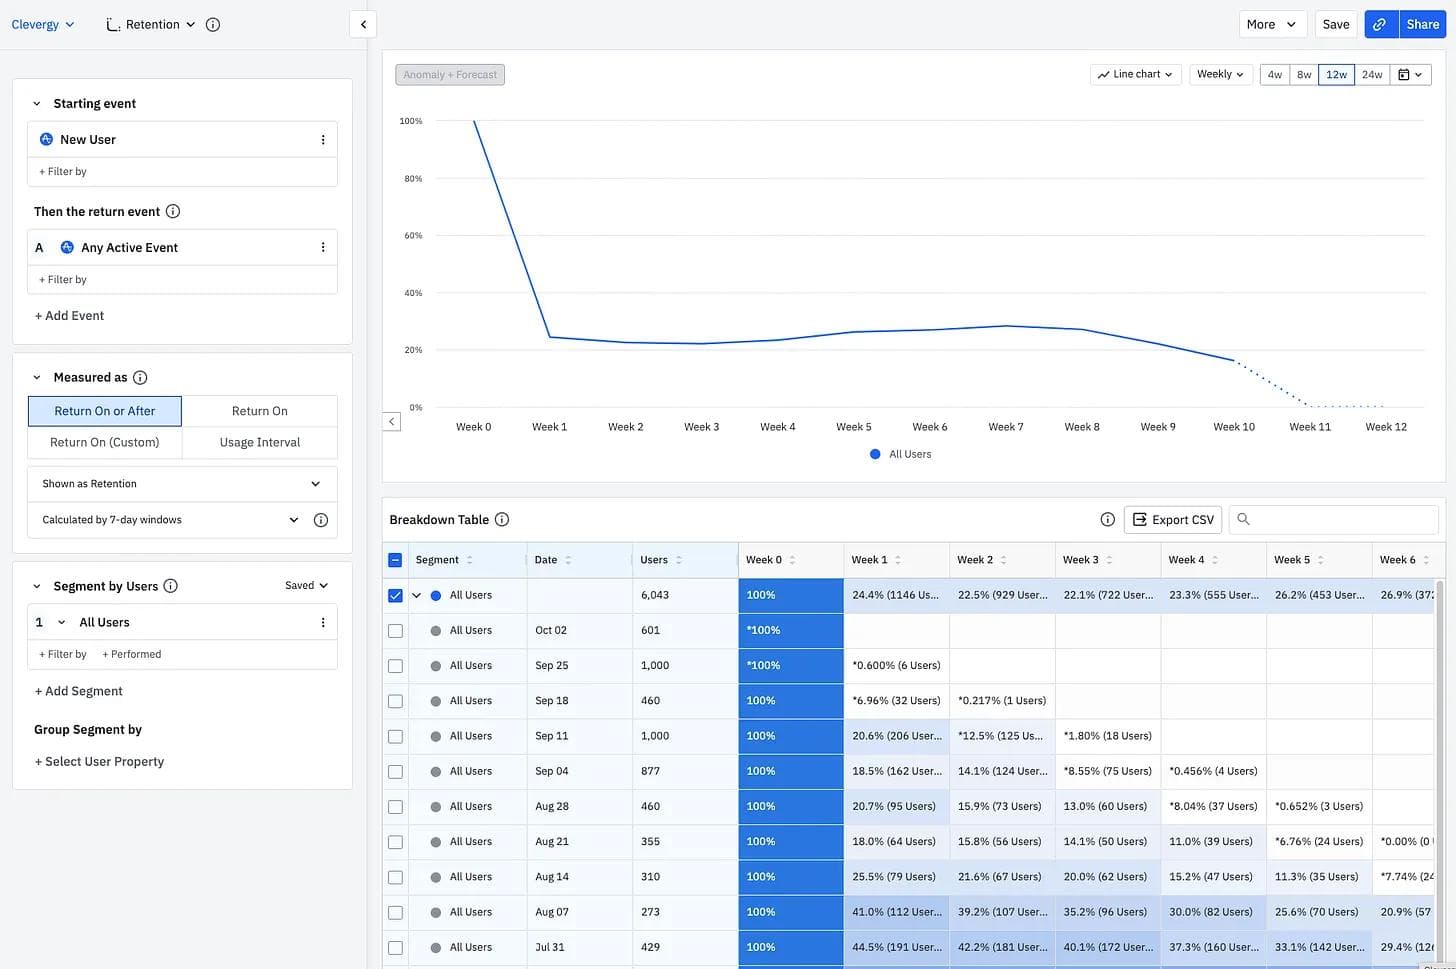
We also made some data confidence checks, which closely matched what we obtained from BigQuery.
It is tempting to implement a tool like this. It seems that thanks to it, all the answers to your questions will magically appear in the tool.
However, the reality is that success lies not in the answers, but in the questions. Knowing how many users log in to the application every day won't take you very far—but understanding the patterns that make a user repeat will.
Case study: improving the onboarding funnel
One of the projects we undertook with Amplitude is optimizing the onboarding funnel.
At Clevergy, we need personal data from each user—including the number of people living in the house, square meters, and appliances—to access the consumption data of their home and make the most of the application.
This represents a great challenge, as reducing potential friction and increasing the value of users through onboarding is key to achieving a higher number of activated users.
To date, we have analyzed this onboarding flow to access user data. With this goal in mind, we increased conversion from 30% to 78% in the last few months.
But how many of those users return to the application within 24 hours after we have access to their data? We decided to instrument the flow in Amplitude and, after a week, the answers started to appear.
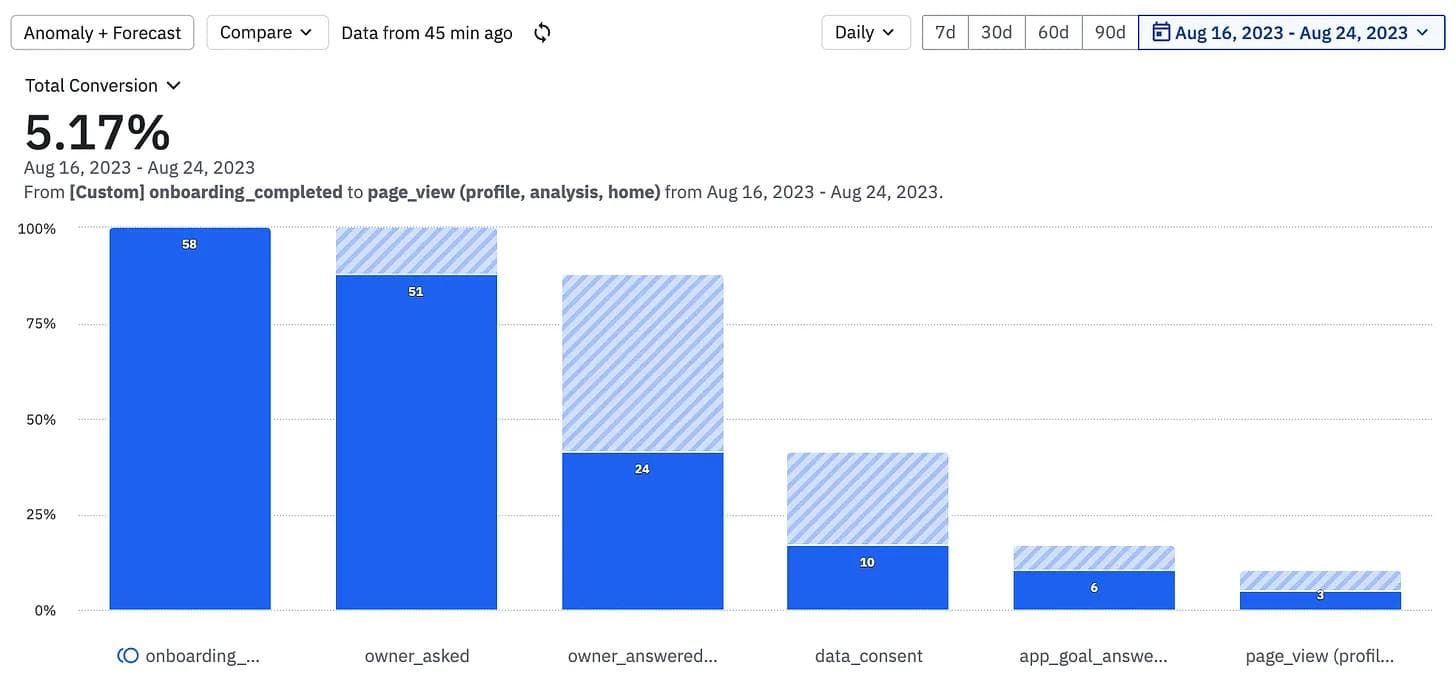
5%!
We focused so much on improving the conversion of data access that we forgot about the conversion that really matters—showing the value of their data to the user in the first few hours after registration.
The good news is that we were expecting this result, as we had seen similar ratios between users who completed their registration and those who returned to the application.
Our first idea seemed obvious: reduce the time it takes to access customer data. We can't make users access the application in less than 24 hours if we can't access that data in that time. The reason was technical. We could not register a user through an API service. Therefore, real-time access was ruled out. The solution stayed within our system, but by using different tools, we reduced that time to an average of 3 minutes.
Unfortunately, when we implemented this change, users did not return...
By the time we had access to data, the user had closed the application and forgotten about us.
What could we do to prevent the user from leaving?
Make the onboarding unnecessarily longer. Keep the user's attention within the application so we have time to access their data and show them useful information.
These screens served two purposes:
- Inform the user what to expect before using the application to expedite their onboarding process.
- Request information from the user to personalize their experience.
It is important to note that we had already verified that the ratio of active users increased from 17% to 57% for users who completed information such as their home profile within the application, so facilitating this step seemed obvious.
Results
The conversion rate after these developments increased to 24.7%.
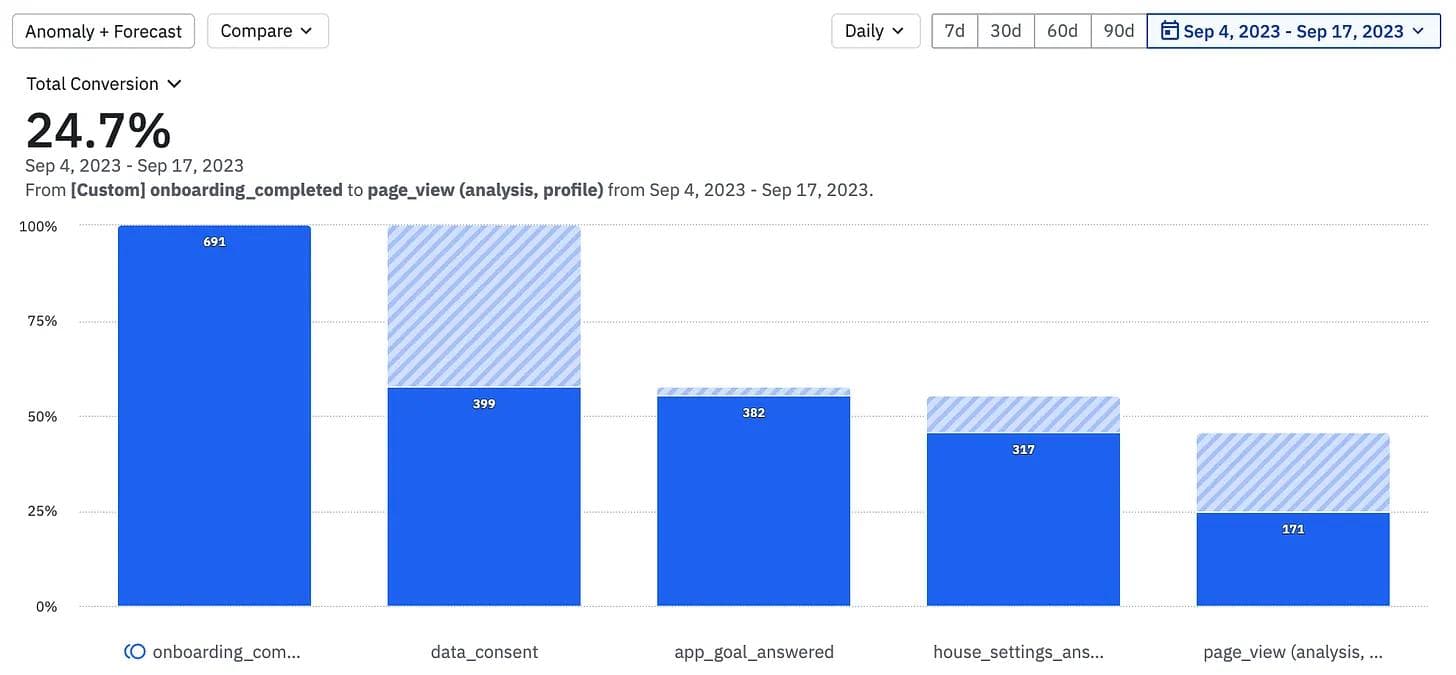
Although this is just the beginning and the sample size is not large, the purpose of this post is not to show how much the number has improved but to tell how Amplitude has helped us throughout this process of reflection and testing.
In addition, we not only have been able to extract absolute samples from the funnel, but we also obtain other valuable information that enables us to create new hypotheses, such as:
The time it took the user to complete the profile with their home data:
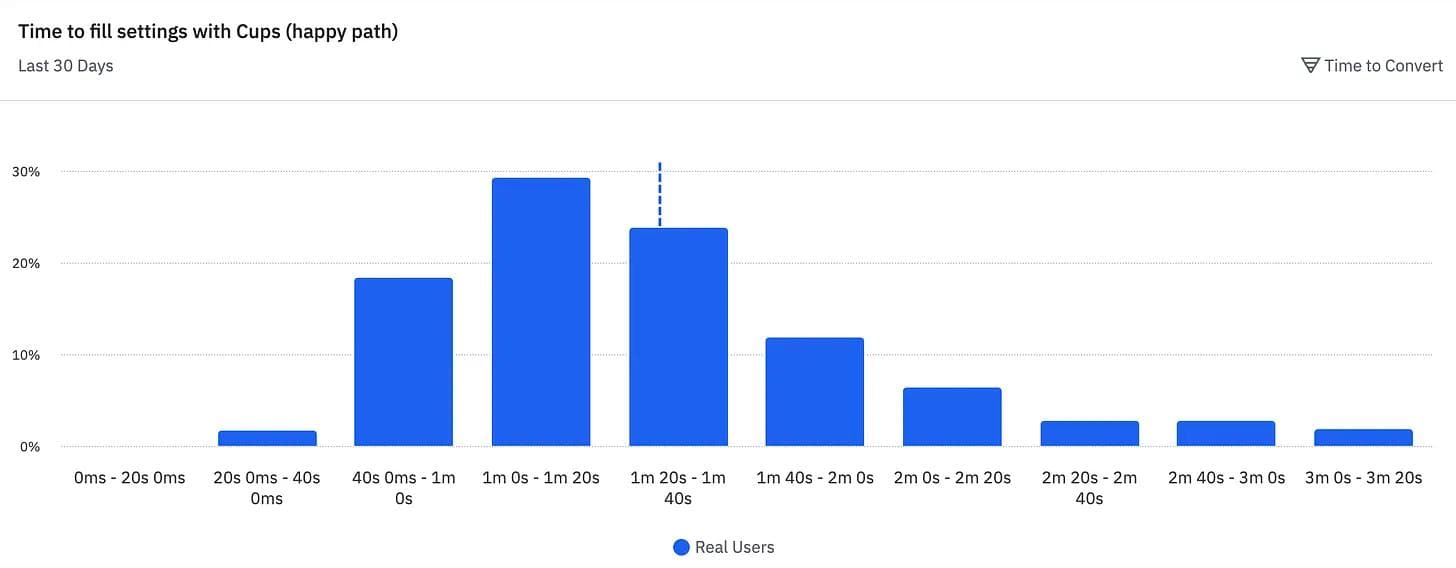
Or the possibility of creating cohorts and measuring the retention difference between users who registered with the new onboarding and the old one:
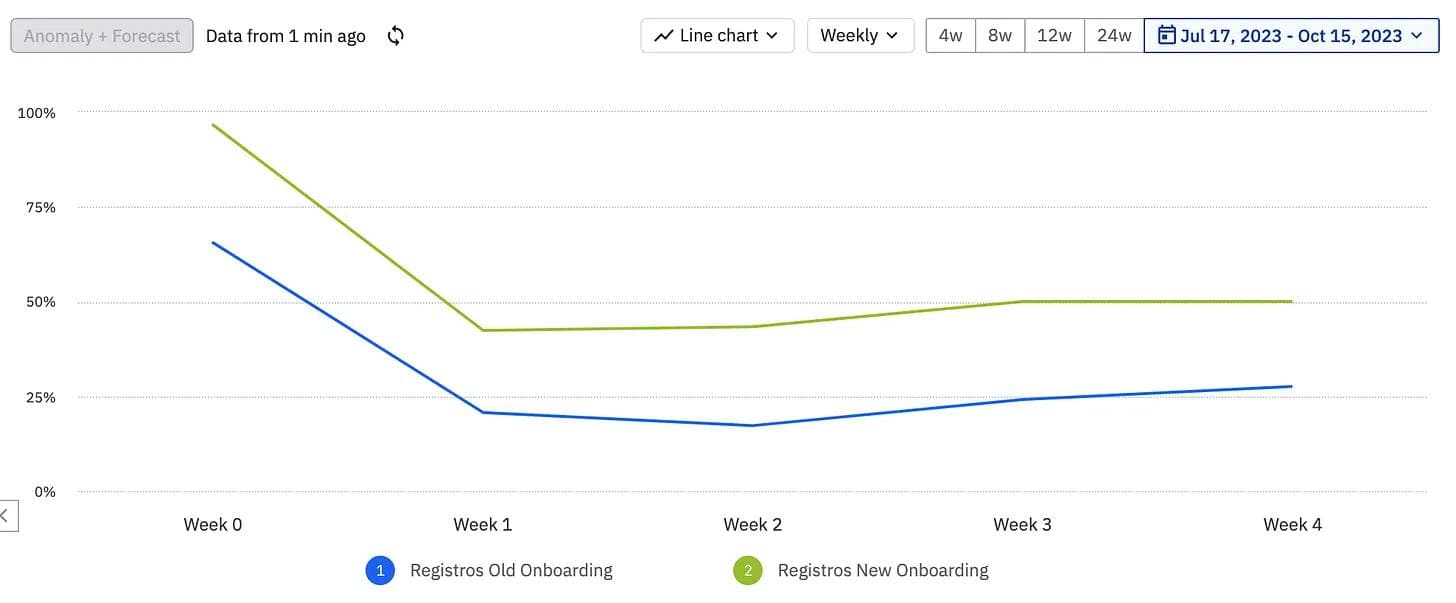
Undoubtedly, this ease and agility in answering questions about user behavior has been a significant advancement in Clevergy's data culture.
The impact of the application redesign has been enormous—not only because we increased the conversion between registration and the user's first useful session, but also because of two learnings that we would not have been able to measure without Amplitude:
- By lengthening the onboarding process, we decreased the percentage of completed registrations, but the people who finished the registration were more prepared to use the application. This increased the net number of people who visit the application.
- When you only analyze a funnel through traces and abstract from the process the user performs in your application, you tend to optimize vanity metrics, such as reducing registration time or increasing the number of completed registrations.
Key learnings along the way
During the Amplitude implementation journey, we have encountered positive and negative aspects. Before concluding, we would like to reflect on several lessons we have learned.
Define a use case versus measuring everything
In the past, we had tested several analytics tools, so we were clear that when you have access to everything that happens in your application, it generates so much noise that it becomes increasingly difficult to find what you want.
With this premise, we decided to start using Amplitude without measuring everything. We thought about specific use cases that we wanted to measure and from there, we traced the necessary events from our backend.
This made the tool more useful, but we also had more confidence in the data, as they were events that we controlled.
You need time to generate data history
On the other hand, this virtue is also a point that has caused conflict for us. When you propose hypotheses, you need data, and with Amplitude, we had to wait a while to collect data.
Although you can import data from various sources, they are likely new use cases, so you might not be able to use Amplitude immediately.
In our case, we needed about a month to start collecting data and be able to create these types of graphs and comparisons.
Involve the development team for proper implementation
Whether defining new events at the beginning of the implementation or debugging metrics that are not being measured correctly, we need continuous help from the development team.
It is important to note that you may need technical resources to measure correctly. This implies dedicating time to define requirements, plan development, and collect data that enables you to make decisions.
The learning curve for the product team is very good
Unlike other tools, Amplitude has been very easy to learn and use. In addition, it has many templates that help you understand how to maximize the tool's potential.
This has been a great advantage for our company since many of BigQuery and Looker Studio's graphics were complex at the SQL level, and not all team members could create or understand them.
Now, anyone on the team can enter Amplitude and create their own graph.
Next steps at Clevergy
Amplitude has substantially boosted our agility in obtaining behavioral data from our users and helped us improve our application and user experience.
If there is one thing I take away from the whole process, it is that this implementation has laid the foundation for us to foster a culture where all new product hypotheses are data-driven.
Now, anyone can open Amplitude, draw their own conclusions, and share them with others.

Álvaro Pérez Bello
Co-founder and CPO, Clevergy
Alvaro is an industrial engineer with more than 8 years building B2B products. He has extensive experience in IoT and ML product development. He is also a professor at ICAI teaching electronics to masters students.
More from Álvaro
