Session Engagement Dashboard
Enhance session engagement with our focused dashboard. Track daily session counts, average session duration, and sessions per user. Analyze user session durations and distribution, along with session initiation patterns. Perfect for optimizing user engagement and session experiences across platforms.

About this template
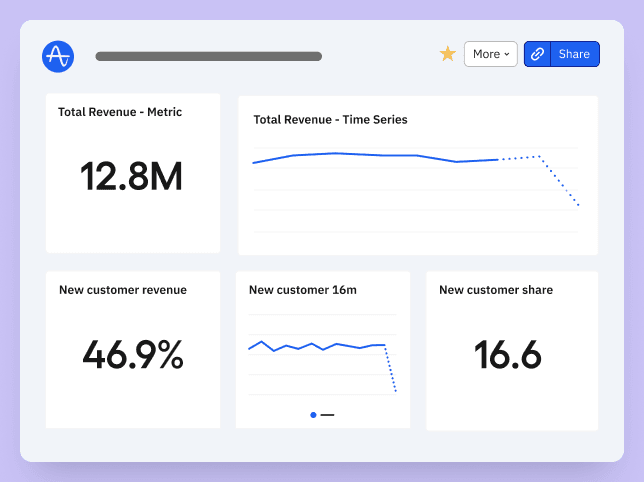
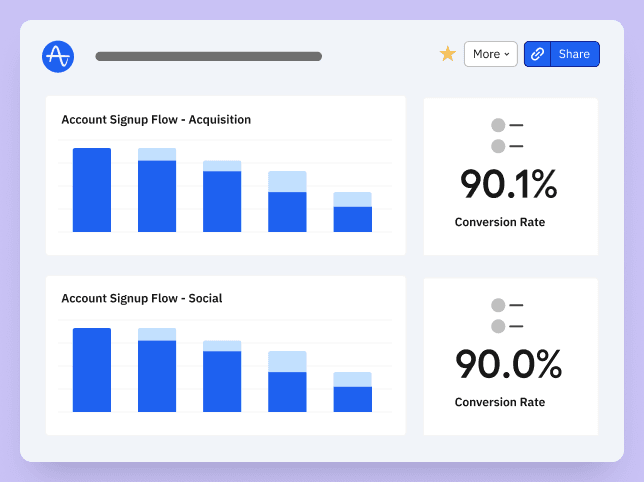
Amplitude's session engagement dashboard offers a robust view of charts to help evaluate your product metrics like DAU, engagement, and retention.
- How many sessions are there each day?
- How long is the average session each day?
- How many sessions per user are there each day?
- How long do users spend across sessions each day?
- What is the distribution of session lengths?
- How do users start their sessions?
How this template works
About Amplitude
Frequently Asked Questions
Amplitude is a leading digital analytics platform that helps companies unlock the power of their products. Amplitude guides companies every step of the way as they capture data they can trust, uncover clear insights about customer behavior, and take faster action. When teams understand how people are using their products, they can deliver better product experiences that drive growth.
Yes, Amplitude is free to get started. Our Starter plan includes up to 50K MTUs, out-of-the-box Analytics and templates, Session Replay, Web Experimentation, and more—all at no cost.
Related templates

Founder & Data Engineer @ Deepskydata
Ecommerce Core Metric Tree Dashboard by Timo Dechau

Head of Growth at Labelbox
Growth Dashboard by Drew Teller

Feature Adoption Dashboard


