How To Identify and Use Actionable Metrics Across Your Company
How to avoid setting vanity metrics as KPIs.
Actionable metrics measure specific and repeatable activities directly impacting your business goals and performance.
When determining what to track and analyze, many companies get stuck on vanity metrics that don’t provide an accurate or meaningful picture of performance. Organizations should zero in on the right mix of metrics to align with their immediate and long-term goals.
In this article, we compare vanity and actionable metrics, explain why vanity metrics don’t bring value to your bottom line, and conclude with actionable metric examples you should track for your software-as-a-service (SaaS) business.
Key takeaways
- Actionable metrics directly relate to a specific result or business goal and bring accurate insight into business health.
- Vanity metrics are superficial, fail to provide meaningful information about business performance, and do nothing to help you improve your product.
- Organizations should avoid using vanity metrics as key performance indicators (KPIs).
- Seven examples of actionable metrics that SaaS companies should track are:
- Conversion rate
- Retention rate
- Churn rate
- Number of active users (NAU)
- Customer lifetime value (CLV)
- Monthly recurring revenue (MRR)
- Customer acquisition cost (CAC)
- See the top 15 metrics you should track and how to measure them in The Amplitude Guide to Product Metrics.
Actionable metrics vs. vanity metrics: What’s the difference?
Actionable metrics directly align with your KPIs and business goals. Vanity metrics, on the other hand, can provide a superficial or misleading picture of your sales and marketing campaigns and business health.
Vanity metrics don’t reflect your business's actual performance or provide any valuable information to help optimize your business. Many vanity metrics are popular because they look impressive and have a feel-good factor any business owner will enjoy. Common examples of vanity metrics include:
- Social media followers: You report 20,000 Twitter followers, but what does this mean for your business? What percentage of these followers purchase your products and generate revenue? How many of these followers did you pay for? Better still, how many of your followers are bots?
- Total app downloads: The number of downloads provides no insight into how many resulted in consistent use or the user’s experience inside the app.
- Page views: You can see on Google Analytics that your landing page has some page views, but you don’t know how much time people spend on the page or if they’re carrying out the desired actions.
Actionable metrics allow you to tie an action or an event to a specific result or business goal. These metrics typically tell you what aspects of your sales funnel or digital marketing efforts are working and which need improvement. Collecting and analyzing actionable metrics helps you optimize your product and design a more effective marketing strategy.
Don’t use vanity metrics as KPIs
If you’re discerning whether a metric falls into the vanity or actionable category, ask yourself, “Can I use this metric to improve my business?” You may find that many of your KPIs are vanity metrics that do not strengthen your business.
Your KPIs need to be SMART:
- Specific: Should answer questions like “What do you need to accomplish?” or “What do we need to do to achieve it?”
- Measurable: Must be quantifiable so you can collect information over time and make adjustments based on this information.
- Attainable: Need to be achievable. Setting possible or unrealistic goals is a recipe for failure.
- Relevant: Must be relevant to your overall business goals. Take a step back and ask yourself why you are setting this KPI.
- Time-bound: Need to identify a start date and an end date.
Crafting and measuring SMART KPIs helps you develop better strategies, make more accurate budgets, and compete more effectively.
For example, if your KPI is to increase the quarterly number of landing page views, ask, “What business decision can I make knowing the number of website views?” Chances are, views alone don’t enable you to take any meaningful action.
But if you prioritize this landing page because it has a call to action (CTA) to collect subscribers, you might want to rephrase your KPI to something like, “Obtain X subscribers from X landing page in Q2.”
Seven examples of actionable metrics for SaaS companies
There are several important metrics SaaS companies should collect and analyze. These metrics can be easily monitored and managed in real-time using tools like Amplitude Analytics. Below, we have outlined seven actionable, agile metrics for your business to consider.
1. Conversion rate
Conversion rate is the percentage of users that enter your website or e-commerce platform and take an action you would like them to take. For example, you might want more users to convert from free trial users to premium users.
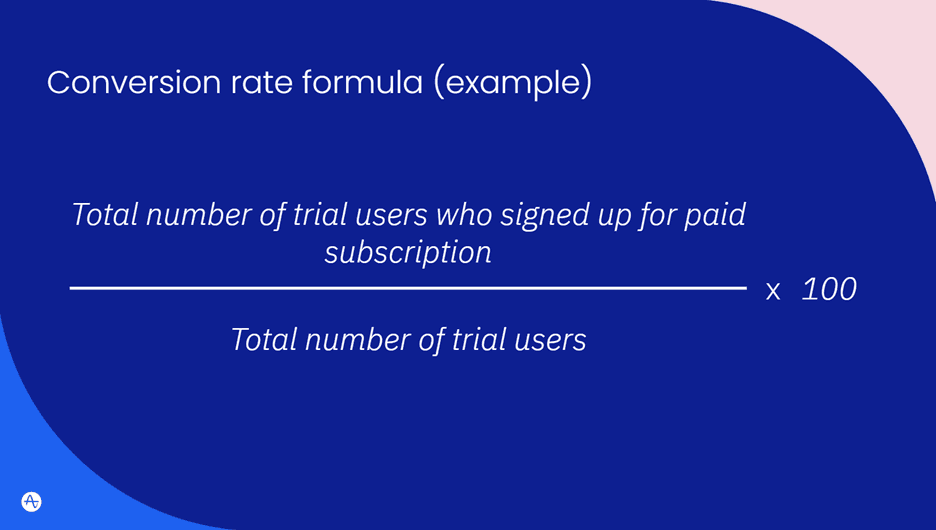
If you have 200 trial users and 150 sign up for a paid subscription, your conversion rate is 75%.
A high conversion rate indicates that you have effectively communicated your product’s value to users and have a well-designed and intuitive platform, which results in a better user experience, lower bounce rate, and higher customer retention.
To improve your conversion rate, you should analyze your typical customer lifecycle to see where people are dropping off and take action to address potential issues.
The average conversion rate for web visitors to free-trial sign-up is 7%, according to Userpilot.
2. Retention rate
User retention is vital for business success. Retention rate is the percentage of customers that continue using your product or service after a period of time.
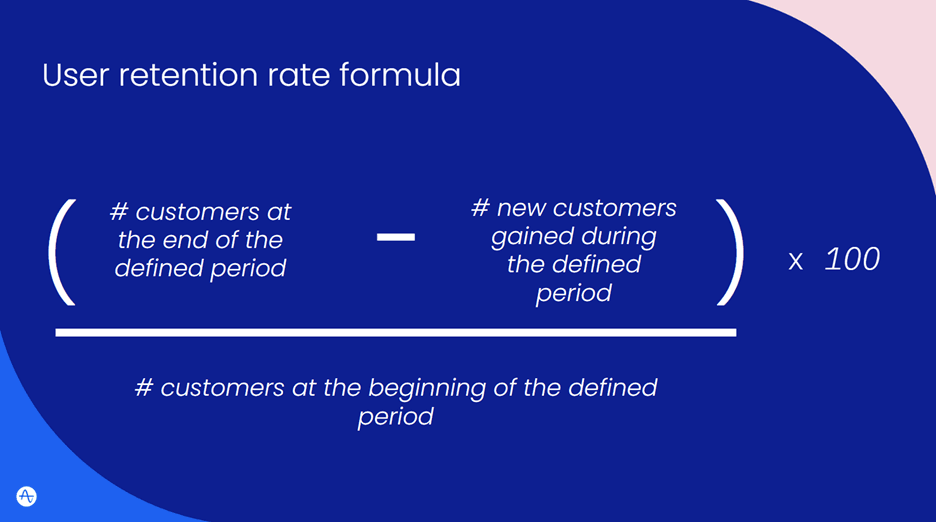
For example, if you had 200 customers at the end of a time period, 50 of which were new acquisitions, and you had 175 at the beginning of the time period, your retention rate is 86%.
Retention rate is a critical metric since returning customers generate more recurring revenue than new ones, and your ability to retain customers is a good indicator of your ability to generate revenue.
To improve retention rate, you should evaluate and optimize every step of the customer journey to create better user experiences. A common way of doing so is implementing continuous onboarding to constantly guide and help customers get the most out of your product.
Another approach is focusing on personalized messaging and marketing campaigns. Research shows that customers have come to expect personalization from the brands they interact with.
The industry average retention rate for SaaS companies in an 8-week timeframe is anything above 35%.
3. Churn rate
Your churn rate is the percentage of customers lost within a defined period and is the inverse of retention.
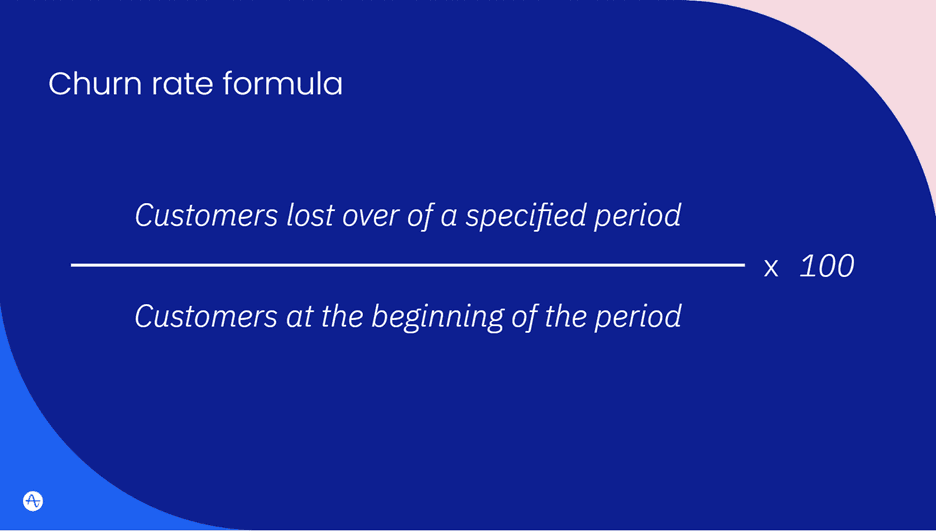
For example, if you started the first quarter with 200 customers but lost 13 customers by the end of the quarter, your churn rate is 6.5%.
Your churn rate helps you measure how much revenue you have lost from churned customers. It also gives you insight into the user experience and surfaces pain points that might be causing churn.
One way to improve your churn rate is to prompt customers with an exit survey when they churn to understand why they’ve decided to leave your product—the insights gleaned help you improve your product, pricing, or marketing strategy to mitigate additional churn.
For SaaS companies, the average monthly churn rate is 3–8%, and the average annual churn rate is 32–50%.
4. Number of active users (NAU)
Vanity metrics like the number of app downloads are not enough to obtain a clear picture of your product usage. You need to understand which downloads have converted to active users.
The definition and measurement of active users varies from company to company depending on the product and desired user behavior. A social media platform might require users to engage with the platform daily to consider them active. Still, a car-sharing app’s active user definition might not require such high-frequency usage.
Companies sometimes split active users by time periods:
- Monthly active users (MAU)
- Weekly active users (WAU)
- Daily active users (DAU)
Active users are essential because, as we mentioned earlier, the more they engage with your product, the more opportunities you have to upsell.
The insights from active users can help you optimize your product to attract more users. For example, you can tweak features popular amongst heavy users to increase the probability of new customers using them.
5. Customer lifetime value (CLV)
Customer lifetime value (CLV) is the monetary value of a customer to your business throughout their lifetime as a user. Customers spend different amounts throughout their lifetime, and higher-spending customers are naturally more valuable.
CLV calculates the average amount of money your existing customers will spend throughout their lifetime.
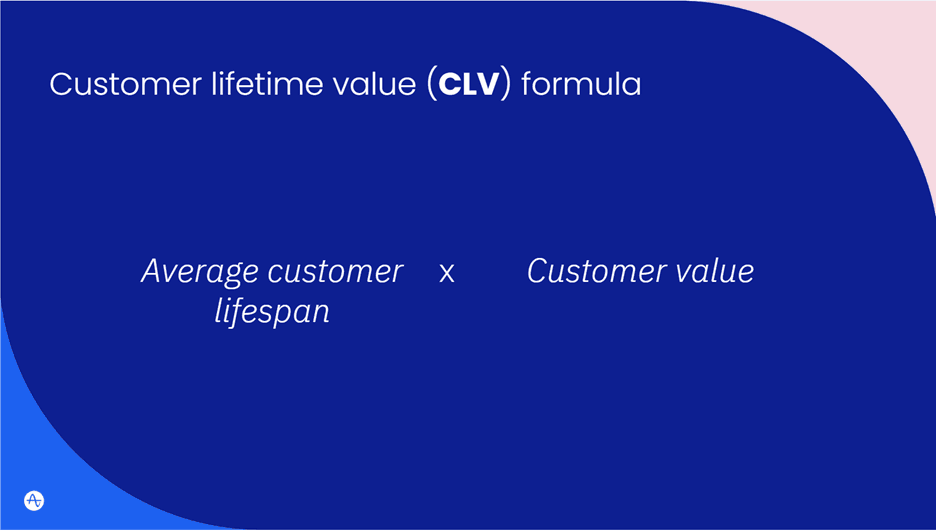
You usually express the average customer lifespan in years or months, depending on your typical churn rate. Customer value is calculated by multiplying your average purchase frequency with the average purchase value.
For example, if your average customer lifespan is six months, and your average customer usually makes two monthly purchases with an average value of $200, your average customer lifetime value is $2,400.
Identify and study high CLV users to identify critical behaviors you’d like to see from all your customers, and then optimize your product to encourage those behaviors.
You can increase CLV by:
- Personalizing user experiences to increase retention and engagement rates
- Minimizing friction points throughout your funnel; bad experiences cause more customer churn, decreasing average CLV
6. Monthly recurring revenue (MRR)
Monthly recurring revenue (MRR) is the money generated monthly from recurring income such as user subscriptions.
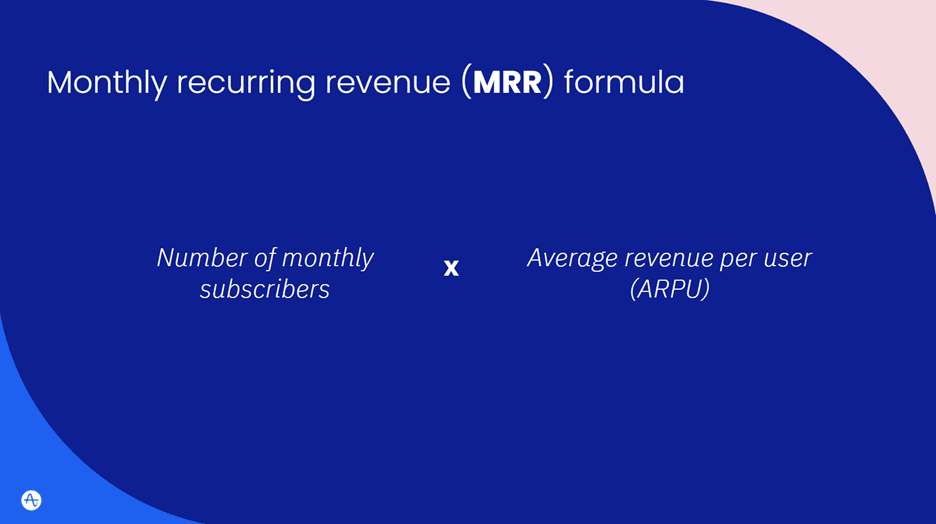
For example, if you have 100 monthly subscribers with an average revenue of $200 per user, your MRR is $20,000.
For companies with annual subscriptions, simply multiply MRR by 12 to obtain annual recurring revenue (ARR). This metric gives you insight into how financially stable your company is.
You can increase your MRR or ARR by:
- Creating upselling opportunities for existing customers
- Crafting various price plans to attract different customer segments
- Improving retention and reducing churn
7. Customer acquisition cost (CAC)
Attracting new customers costs money. Customer acquisition cost (CAC) tells you how much it costs in marketing and sales efforts to gain new customers.
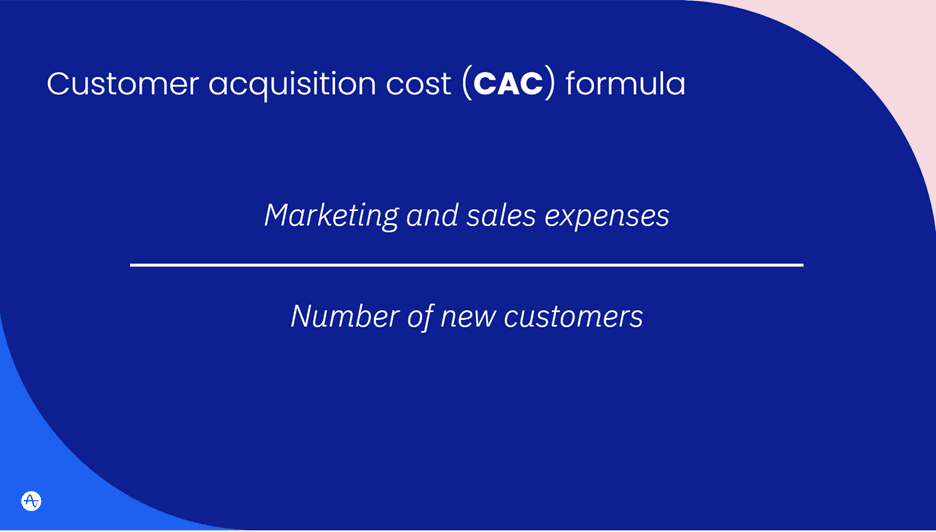
For example, if you spend $200,000 on sales and marketing and acquire 500 new customers in a given time period, your customer acquisition cost is $400 per customer.
Your CAC helps you calculate how long it will take to recoup the money spent after acquiring a new customer. This is particularly useful for startups looking for the right product/market fit.
You can improve your CAC by:
- Improving retention and churn rate to reduce dependency on acquiring new customers
- Implementing more targeted marketing efforts to ensure reasonable, optimized marketing spend
- Carrying out A/B testing to optimize your product
- Focusing on affiliate marketing and creating referral programs that reward customers who bring in new customers
Track actionable metrics with Amplitude
It’s time to say “goodbye” to vanity metrics and “hello” to actionable metrics. Identifying and tracking the right actionable metrics for your business is critical, and a best-in-class customer analytics platform like Amplitude can help.
Check out The Amplitude Guide to Product Metrics today for help choosing the right combination of metrics and tips for avoiding vanity metrics.

Nate Franklin
Former Director, Product Marketing, Amplitude
Nate Franklin is a former director of product marketing at Amplitude. As a former product manager and self-declared product nerd, he's often asking, "ok, so what is our goal?"
More from Nate


