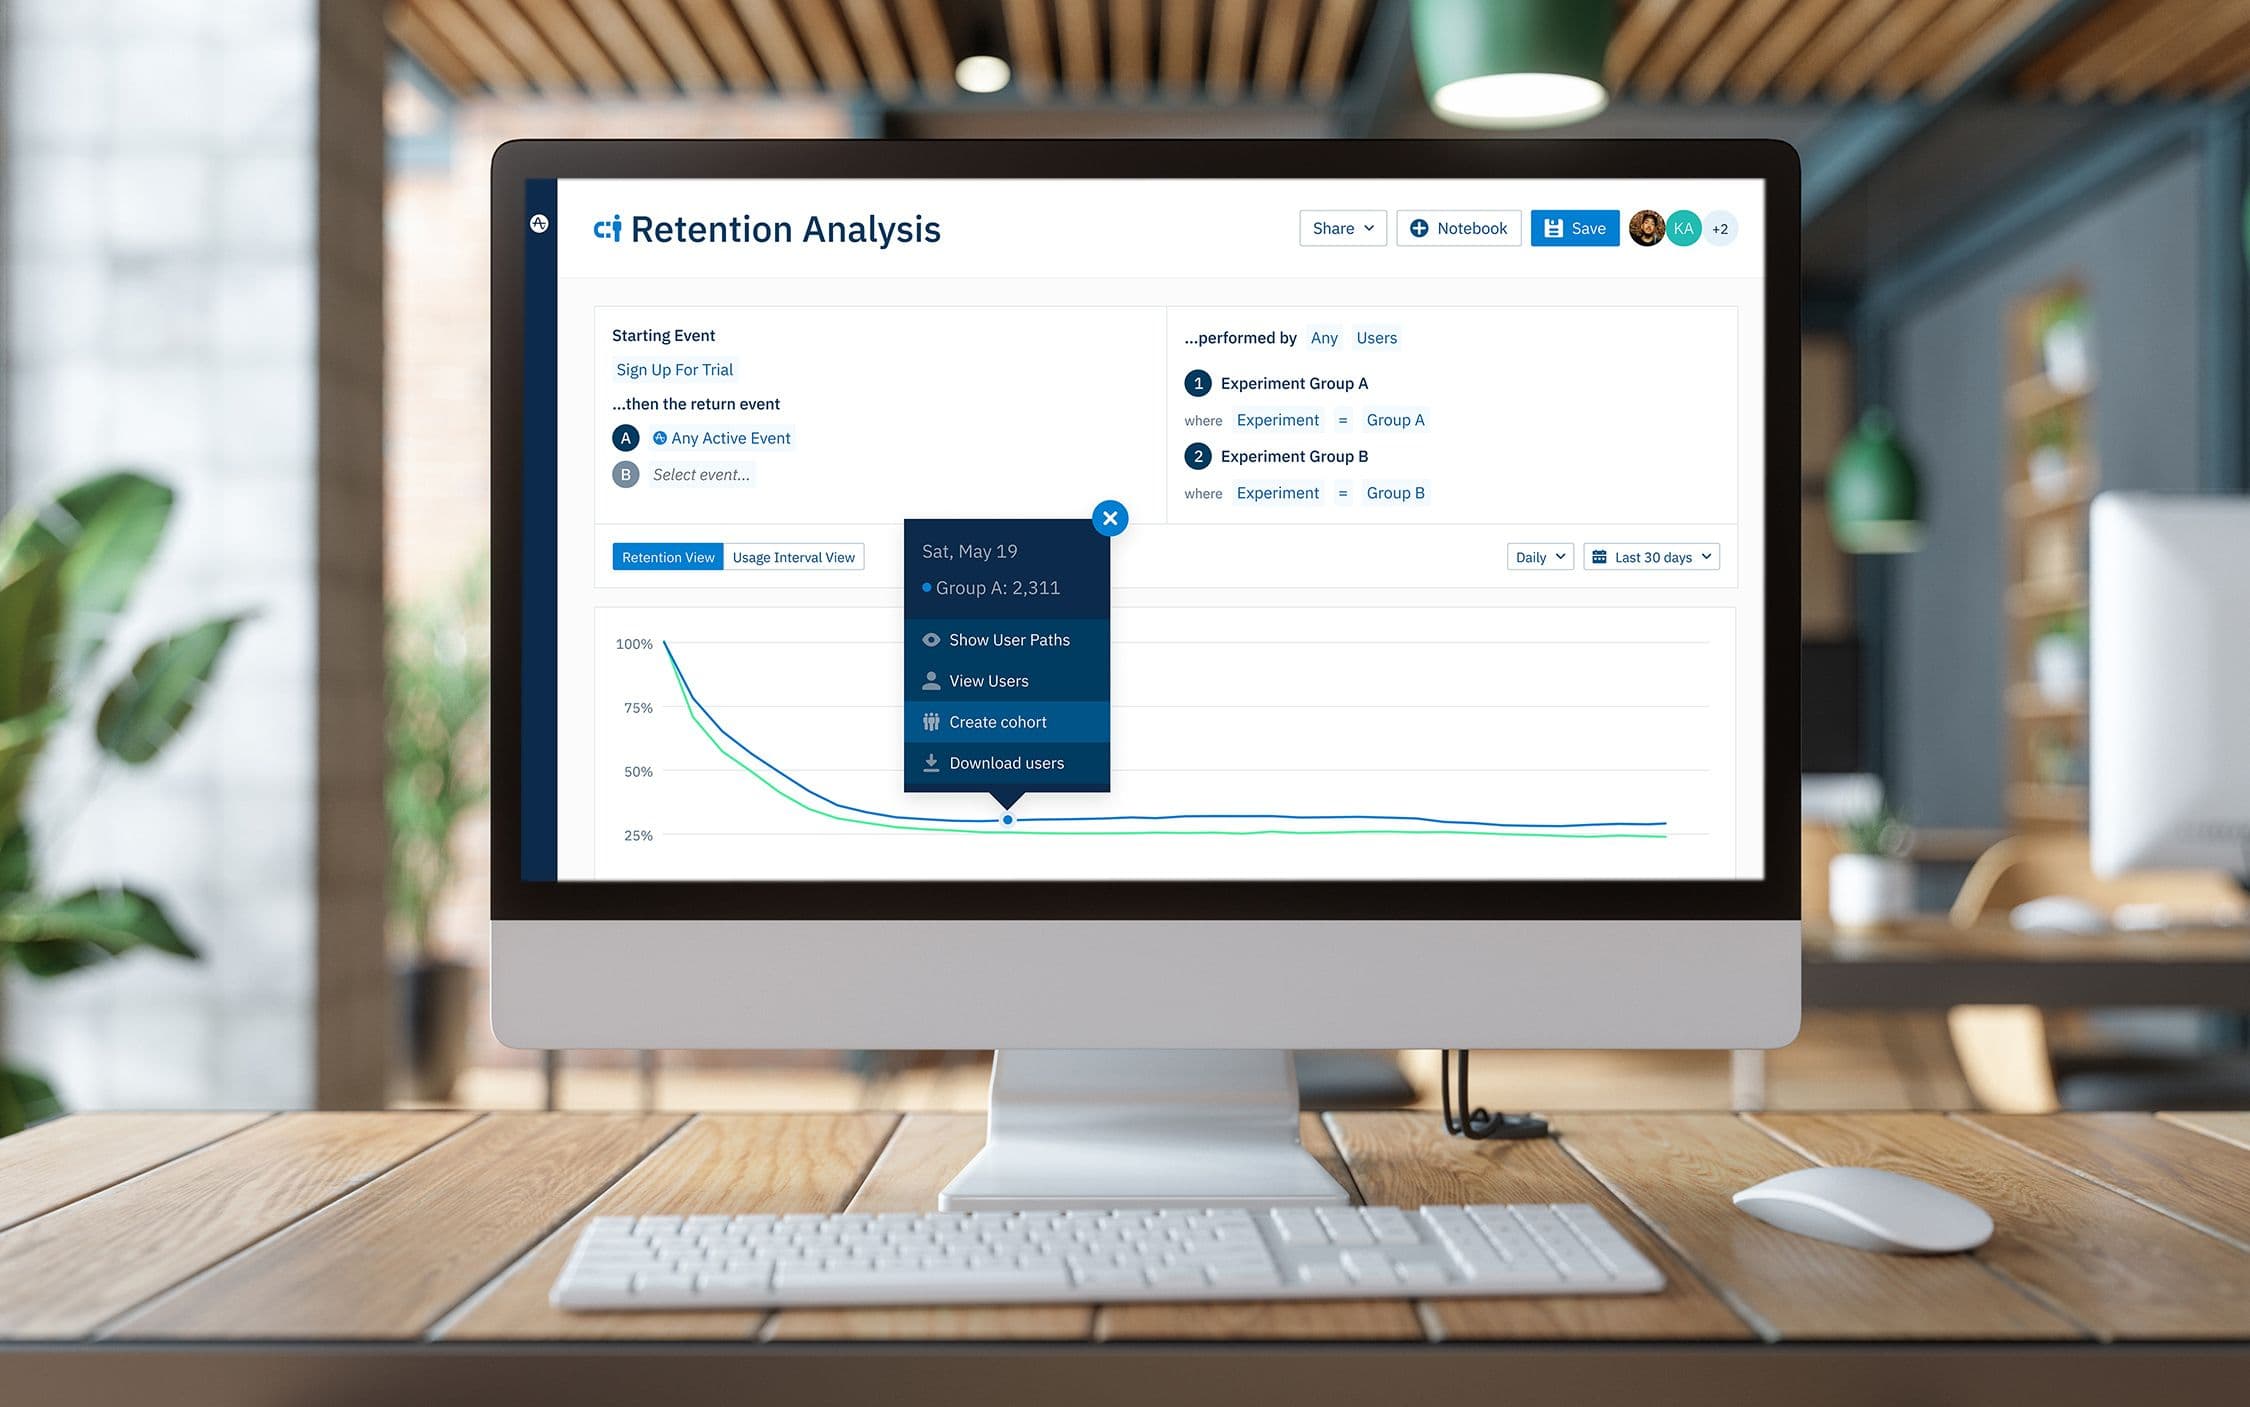
What Is User Retention? Plus 5 Ways to Improve it
How to define and improve user retention.
Browse by category
User retention is how many active users log in or use your product over a specified period, typically measured monthly, quarterly, and yearly for subscription-based products. Retention is most often expressed as a percentage, known as a user retention rate.
While the customer retention can be broad and complex, user retention is more straightforward. A solid understanding of user retention principles and how to measure and sustain high retention levels can pay dividends for your company’s profitability.
Key takeaways
- User retention measures how many people use your product over a set period.
- Unlike customer retention, user retention is an activity metric, not a financial metric.
- The user retention rate formula is: (number of active users at the end of a set period - number of new users during the set period) / total number of active users at the beginning of the period.
- Key ways to improve user retention include: cohort analysis; soliciting and acting on customer feedback; improving your onboarding experience; and leveraging push notifications.
User retention rate vs. customer retention rate
On the surface, user retention may sound similar to customer retention. Still, there is a distinct difference: customer retention measures how many customers continue paying for a product, while user retention is how many people use the product.
In direct-to-consumer companies, user and customer retention are often interchangeable since a direct subscriber is usually both the active user and the person paying for the subscription.
Customer retention rate
Customer retention measures the number of customers who continue to pay for your product or service over a given period.
Customer retention is a financial metric that measures how many customers renew their subscription to your product or service, and a single customer might include multiple users. For example, a company selling HR solutions to large enterprises would measure customer retention by how many enterprises continue their subscription over a quarter or a year.
User retention rate
User retention measures how many individual people from a client company log in or interact with your product over a given period.
User retention is a usage metric, not a financial measurement. For the HR software example, they’d measure user retention by how many users from a client’s company log in to their product over a quarter or a year.
User retention rate vs. churn rate
User retention and churn rate are related but different. While user retention calculates the number of users a business retains, churn rate is the number of users a business loses or how many customers don’t re-subscribe to a SaaS product. All users have two options: churn or continue using your product. So your churn rate is the inverse of your retention rate, and together they should add up to 100%.

Example of a user retention table in Amplitude.
How to measure user retention
Measuring user retention can help you understand your company’s overall health, with high user retention signifying stability and profitability. But to improve user retention, you must first define your terms and time frame and determine the type of retention to track.
The user retention rate formula
The basic calculation for user retention rate is as follows:
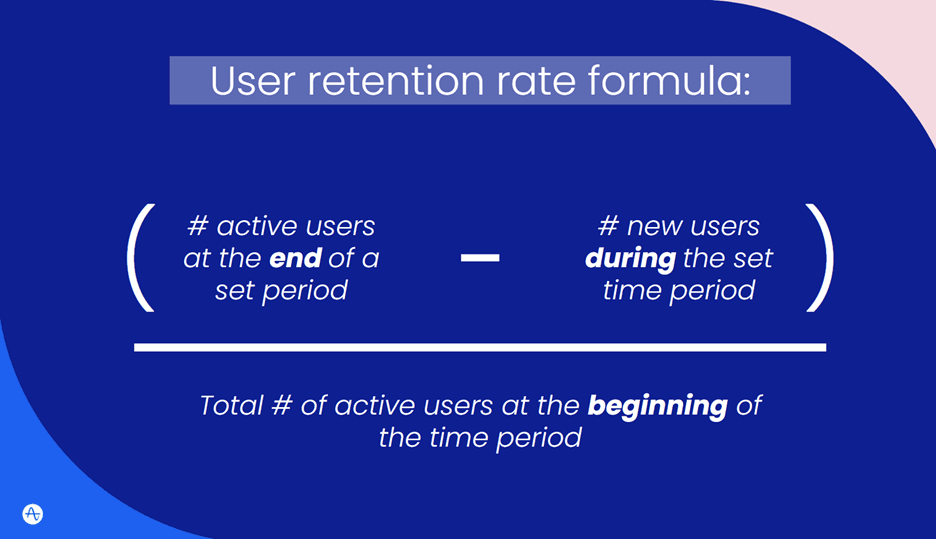
The first part of the equation determines how many users you retain during a period. Then, dividing your retained users by your total number of users tells you the percentage of total users that are repeat customers.
While calculating user retention rate is relatively straightforward, the easiest way to ensure accuracy is using a platform like Amplitude to do the math for you.
Ideally, your company would have a 100% user retention rate and a 0% churn rate. But in reality, you should aim for a retention rate that makes sense for your industry. CustomerGauge’s B2B NPS & CX Benchmarks Report 2022 found that the energy and utilities industry had the highest user retention at 89%, while the wholesale industry had the lowest retention, at just 44%.
Benchmark reports can help you compare your retention rate with the industry standard and then aim to increase that retention figure over time.
Set your formula parameters
To use this calculation accurately, you need to decide how you’ll measure two key factors: how to define a user and your timeframe for tracking retention.
- Define user: Determine what constitutes “using” your product. Is it enough to have the application on their desktop? Do they have to use it every day for it to count? This definition will differ for every product, but you need to align your definition internally for an accurate retention measurement.
- Set a timeframe: You should pick a timeframe based on your product’s intended use. For example, if you sell an analytics tool that creates quarterly reports, measuring user retention on a weekly basis won’t give you an accurate understanding of customer engagement with your product. On the other hand, if you sell a single sign-on application that users should interact with multiple times daily, a weekly timeframe may be appropriate.
Look at alternative retention benchmarks
The basic user retention formula works for many use cases, but a more specific version of the primary formula may better suit your product or industry.
For example, you wouldn’t expect users to engage daily or even weekly with a travel app for booking flights. Alternatively, you would expect users to engage with a calendar app every day, so analyzing user retention on a daily basis would make sense.
In some cases, a specific retention rate formula might give you a more accurate picture of your user behavior.
N-Day or Return On retention
N-Day retention, referred to as Return On retention in Amplitude, measures the number of users that engage with your product on a specific day, starting from Day 0. Day 0 is typically when a user downloads and installs your app or the first day the user performs a specific action, like creating a profile.
To measure Return On retention, analyze how users behave in the days following Day 0. Use the formula to understand how many return to your product on Day 1, Day 3, Day 5, and so on.
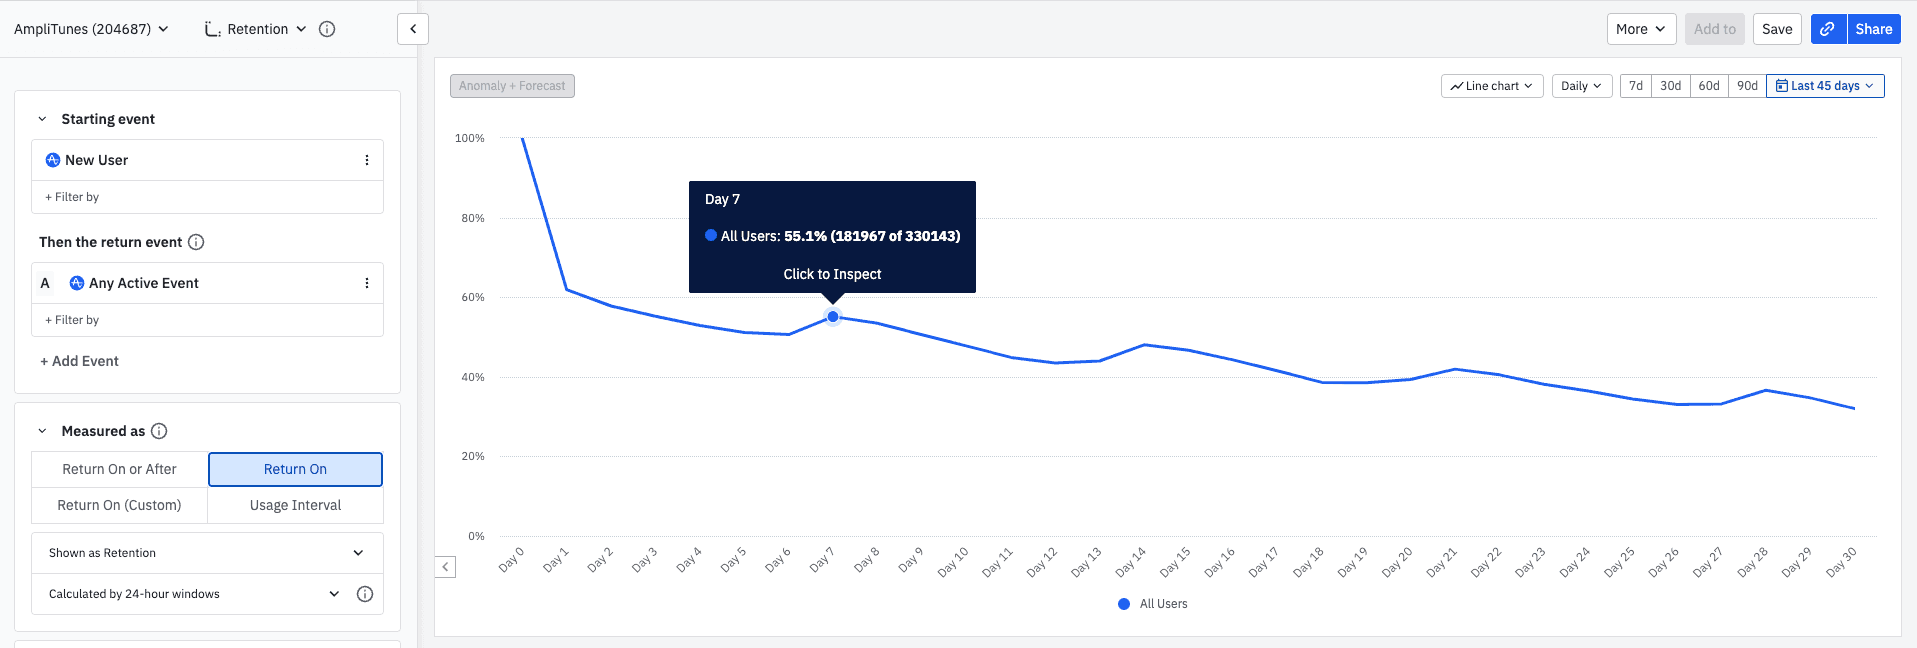
This chart shows Return On retention in Amplitude. Specifically, the spike on day 7 means more users return on precisely the 7th day after their initial engagement.
Bracket or Return On (Custom) retention
Bracket retention, known as Return On (Custom) in Amplitude, is a more complex version of Return On retention that involves grouping your measurements into custom periods. These periods can help determine where buyers lose interest in your customer journey.
Let’s say a fitness app offers a six-week challenge, and while many new users are signing up for the challenge, they are dropping before the end of the six weeks. With Return On (Custom) retention, you would set the following parameters:
- Day 0: first day of the program
- Day 1-14: the first two weeks of the program
- Day 15-28: the second two weeks
- Day 29-42: the third two weeks
After calculating retention for each chunk of time, you can compare them to see where the steepest drop-off occurs and work with your sales and marketing teams to develop incentives to keep people returning to the app.
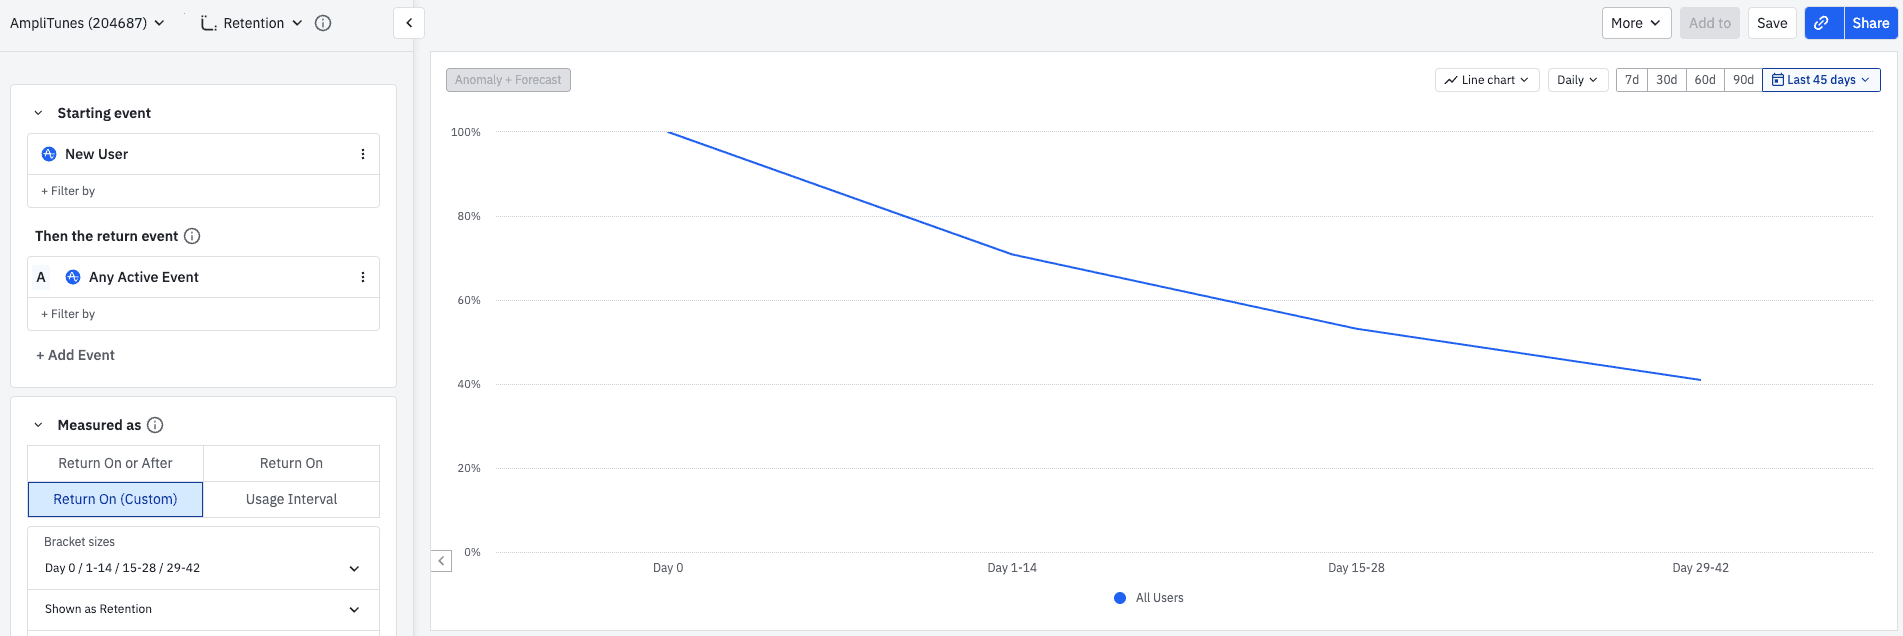
Visual of Return On (Custom) retention in Amplitude.
Unbounded or Return On or After retention
Unbounded retention, also known as Return On or After retention in Amplitude, measures the percentage of users returning to your product on one particular day and anytime after. For the fitness app, Return On or After retention would enable you to see users who joined on January 1st compared to the percentage of users still using the app on January 10th or February 1, and so on.
Return On or After retention works for businesses that don’t expect their users to return daily. For example, makers of a grocery delivery app are more interested in how many users return to the app after weeks or months rather than how many use it daily.
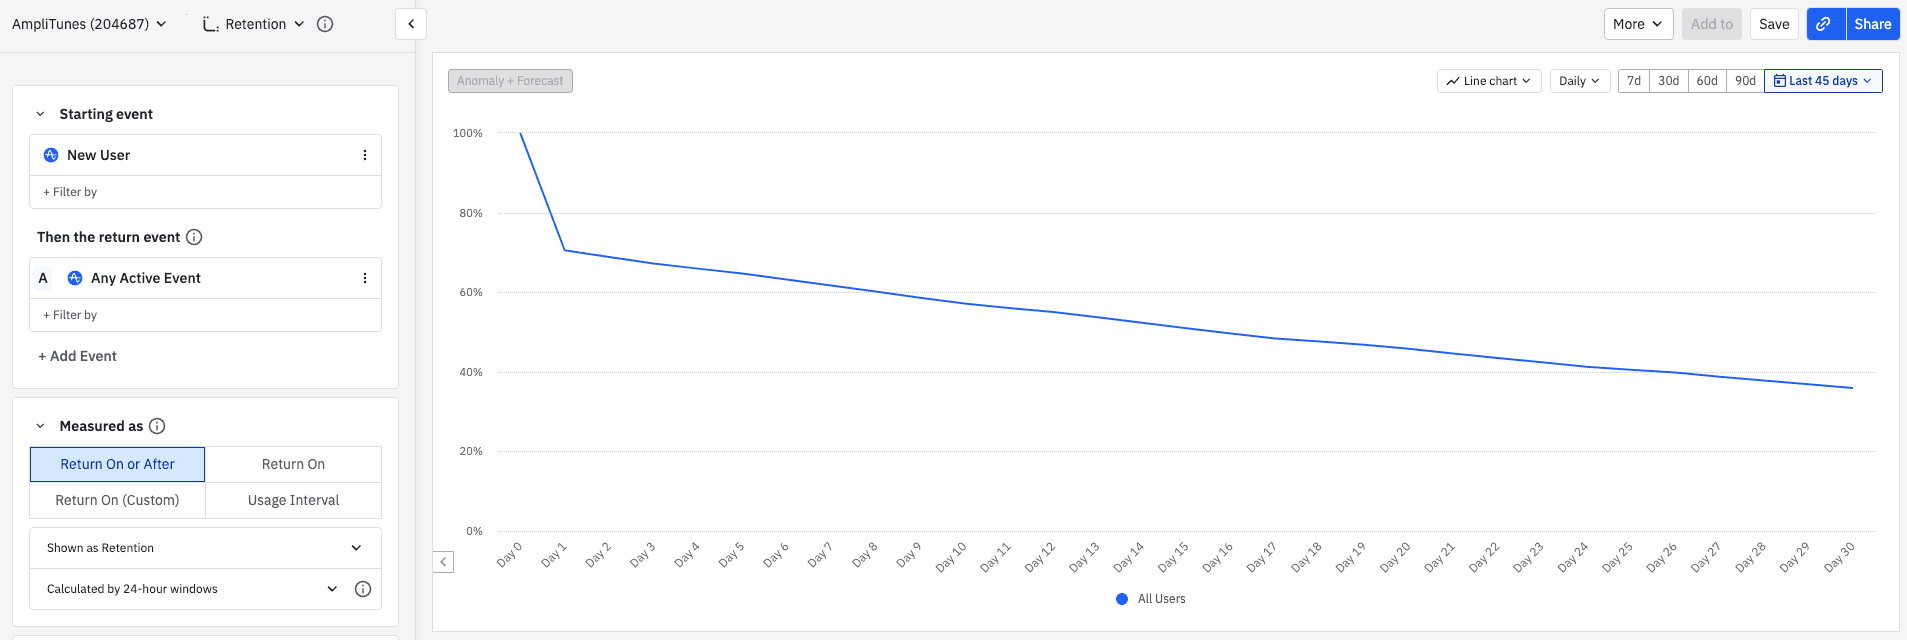
Example of Return On or After retention in Amplitude.
How to improve user retention
Improving user retention and improving user experience go hand in hand. If users enjoy using and find value in your product, they’ll be more likely to stick around. To improve your retention rate, focus on the tactics that also help you improve customer experiences, like cohort analysis, feedback loops, customer onboarding, and timely updates.
1. Study your users with cohort analysis
Cohort analysis is a data-driven method for comparing how individuals across user groups behave. Instead of analyzing a single view of your users, cohort analysis splits them into categories based on factors like acquisition date, platform, channel, and user behavior.
Use cohort analysis to test hypotheses related to user trends and behaviors observed amongst different customer segments–whether it’s churning after the first month or sticking around for years. Once you’ve identified a specific cohort’s sticking points, you can develop strategies to combat that churn.
An analytics platform like Amplitude enables you to perform cohort analysis and understand your users more deeply.
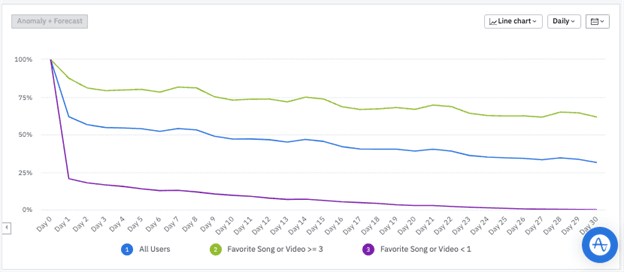
Example of a retention cohort comparison in Amplitude for a music app. The chart displays a comparison of users who Favorite a Song of Video 3+ times to those who do so 0 times.
2. Offer frequent opportunities for feedback
You have to know how users feel about your product to improve it. Sending regularly cadenced surveys can empower you with these insights. For example, prompt users to rate your app every fifth use, offer incentives for users to leave reviews, or ask for a reason when they cancel their subscription.
Share the feedback with the internal teams best equipped to address it, like routing glitch reports to engineering and onboarding frustrations to customer success. Your team can work on the feedback to assess your users’ demand and improve user experience.
You should create a continual feedback loop of requesting comments, reviewing and routing them to the appropriate department, and making product updates accordingly. Taking action demonstrates to users that you hear and value their opinions, in turn improving user retention and loyalty.
3. Improve your onboarding experience
You only get one shot at a first impression, which is why your onboarding experience is so critical. A report by Wyzowl found that 8 out of 10 users have deleted an application because they didn’t know how to use it. Users expect a frustration-free, intuitive experience with your product from Day 0, which you should strive to deliver.
Consider providing in-app demos, tutorials, and interactive walkthroughs to create a positive onboarding experience. You can also add interactive, informative tips the first time a user accesses a specific feature. Doing so can create a better experience with that feature while ensuring users aren’t overwhelmed with unnecessary information until they need it.
You can add in-app customer support capabilities for more complex issues, including self-help options via a chatbot or knowledge base or access to a live customer representative via chat, email, or phone.
4. Leverage push notifications
Push notifications that target churned or infrequent app users can also improve user retention. But don’t overwhelm them with a flurry of messages, which may annoy and push them further away.
Instead, use these notifications to keep users apprised of updates or share new and exciting ways to use your product–all with the goal of encouraging them to log back in.
You can also craft a personalized call-to-action (CTA) in your notification that triggers a specific user behavior. For example, you can suggest they explore a newly launched feature relevant to them or complete a missed step in setting up their profile.
5. Master retention with Amplitude’s Playbook
Improving customer retention doesn’t happen overnight; it’s a long-term process that requires more than short-term hacks. That’s why we’ve created a playbook to help you implement an adaptable, repeatable user retention strategy that you can apply for products at all stages of growth and in all verticals.
With our Mastering Retention Playbook, you’ll learn how to:
- Determine your business’s true growth potential.
- Analyze retention at different user lifecycle stages.
- Increase your user engagement and loyalty–and much more.
Ready to check it out for yourself? Download the guide today.

Darshil Gandhi
Director, Product Marketing, Amplitude
Darshil Gandhi is a Director of Product Marketing at Amplitude. He leads global technical and partner product marketing, collaborates with product and go-to-market teams on strategy, positioning, messaging, campaigns, and enablement. He was previously a solutions consulting team principal at Amplitude, and has helped dozens of Amplitude customers turn their data into actionable insights. Darshil graduated from Dartmouth College with a Masters in Engineering Management.
More from Darshil
