How to Improve Retention with Churn Prediction Analytics
Use churn prediction models to identify which customers are at risk of churning and which areas to prioritize to increase retention.
Originally Published on October 25, 2022
Browse by category
Churn prediction uses artificial intelligence (AI) and machine learning (ML) models to identify which customers are at risk of churning. With this information, companies can take the necessary steps to optimize the areas of their business that are causing friction and keep customer attrition levels under control.
Customers churn for many reasons, from negative customer service experiences to finding better offers from a competitor or a perceived lack of value from your product. Improving customer retention and keeping your churn rate low is vital, especially since acquiring new customers is costly.
Key takeaways
- Churn prediction is used to forecast which customers are most likely to churn. Churn prediction allows companies to:
- Target at-risk customers with campaigns to reduce churn.
- Uncover friction across the customer journey.
- Optimize their product or service to drive customer retention.
- Churn prediction uses ML models and historical data.
- Subscription-based companies are particularly vulnerable to customer attrition and can benefit significantly from churn prediction.
- Building a churn prediction model consists of identifying churn prediction goals, collecting and extracting data through the use of features, and building and monitoring your model.
- Churn prediction using an analytics Amplitude involves four simple steps to identify at-risk customers and retarget them with strategies to improve retention.
What is churn prediction?
Churn prediction is a process where companies use AI and ML models to forecast which customers are at the highest risk of ending their patronage. Churn prediction uses customer data based on user behavior and usage. Customer churn prediction and prevention allows companies to:
- Identify at-risk customers and implement highly targeted efforts to stop them from churning.
- Identify pain points and friction across the customer journey.
- Identify strategies that target these pain points to lower churn and increase retention rates.
Is it actually possible to predict customer churn?
Thanks to machine learning algorithms and big data, predicting customer churn is, in fact, a possibility. Data analysis techniques are used to look at past behavioral trends and patterns in customer behavior.
The idea is that you can identify specific behaviors as churn-risk actions and address them before it’s too late. These are often referred to as red flag metrics. For example, you may find that customers who unfollow you on social media or who uninstall your app are at higher risk of churning.
When conducting churn prediction, it is important to keep the following in mind:
- Proactivity is key when it comes to customer retention. Churn prediction should help you set up plans to engage with at-risk customers the moment they are flagged as such.
- Ensure that your churn prediction technique accurately identifies customers likely to leave. Misidentifying at-risk customers could lead to you spending resources on outreach campaigns and special offers for no reason, resulting in reduced revenue.
- You need a churn prediction model built on data sources obtained in real time. This data reflects current behaviors and will lead to more accurate predictions.
Churn prediction for subscription companies
Companies with business models based on selling subscription services—B2B SaaS, music streaming, and telecommunications, to name a few—rely on the recurring revenue they generate from their customers. Subscription churn prediction, harnessing customer loyalty, and increasing customer lifetime value are particularly important for such businesses.
During an interview with AltexSoft, the then-general manager of Service Hub at HubSpot, Michael Redbord, argued that:
“In a subscription-based business, even a small rate of monthly/quarterly churn will compound quickly over time. Just 1 percent monthly churn translates to almost 12 percent yearly churn. Given that it’s far more expensive to acquire a new customer than to retain an existing one, businesses with high churn rates will quickly find themselves in a financial hole as they have to devote more and more resources to new customer acquisition.”
High churn rates mean less revenue due to a decreased number of customers. Moreover, people who leave a company due to bad experiences are likely to leave negative reviews, impacting its image and making it even more difficult to attract new customers.
There are many types of subscription-based service providers who can benefit from using churn prediction. Some of these sectors include:
Music and video streaming services
These companies offer on-demand access to music, TV shows, and movies to their subscribers. Examples of such companies include Netflix and Spotify. According to Deloitte’s 2022 Digital Media Trends report, paid video streaming services in the US have had a consistent churn rate of 37% since 2020.
News media
News media companies have shifted their focus to digital over the past years. In 2021, 65% of people in the US said that they never or rarely got their news from print media. Organizations like The New York Times and the Financial Times offer their customers digital subscription packages where they can access news articles and information through their online platforms.
Despite the shift to digital, mobile news apps still experienced an uninstall rate of 25% in 2022.
Telecommunications service providers
Telecom companies offer a range of subscription-based services such as wireless, TV, internet, and cell phone services. Such companies include AT&T and Vodafone. In 2020, Telecommunications companies experienced a 20% attrition rate.
Software as a Service (SaaS) companies
SaaS companies include any business that offers a type of cloud-based service. This could be anything from online graphic design services like Canva to ecommerce platforms like Amazon.
According to Woopra, the average monthly churn rate for SaaS companies is anywhere between 3% and 8%. Annually, this is 32–50%.
Further reading
Learn more about SaaS companies with the following resources:
- How to Calculate & Interpret SaaS LTV: Learn how to calculate, interpret, and improve SaaS lifetime value.
- How to Perform a SaaS Cohort Analysis to Reduce Churn: Use SaaS cohort analysis to learn how different groups of users and accounts behave in your platform and reduce customer churn.
Understanding your customer lifecycles
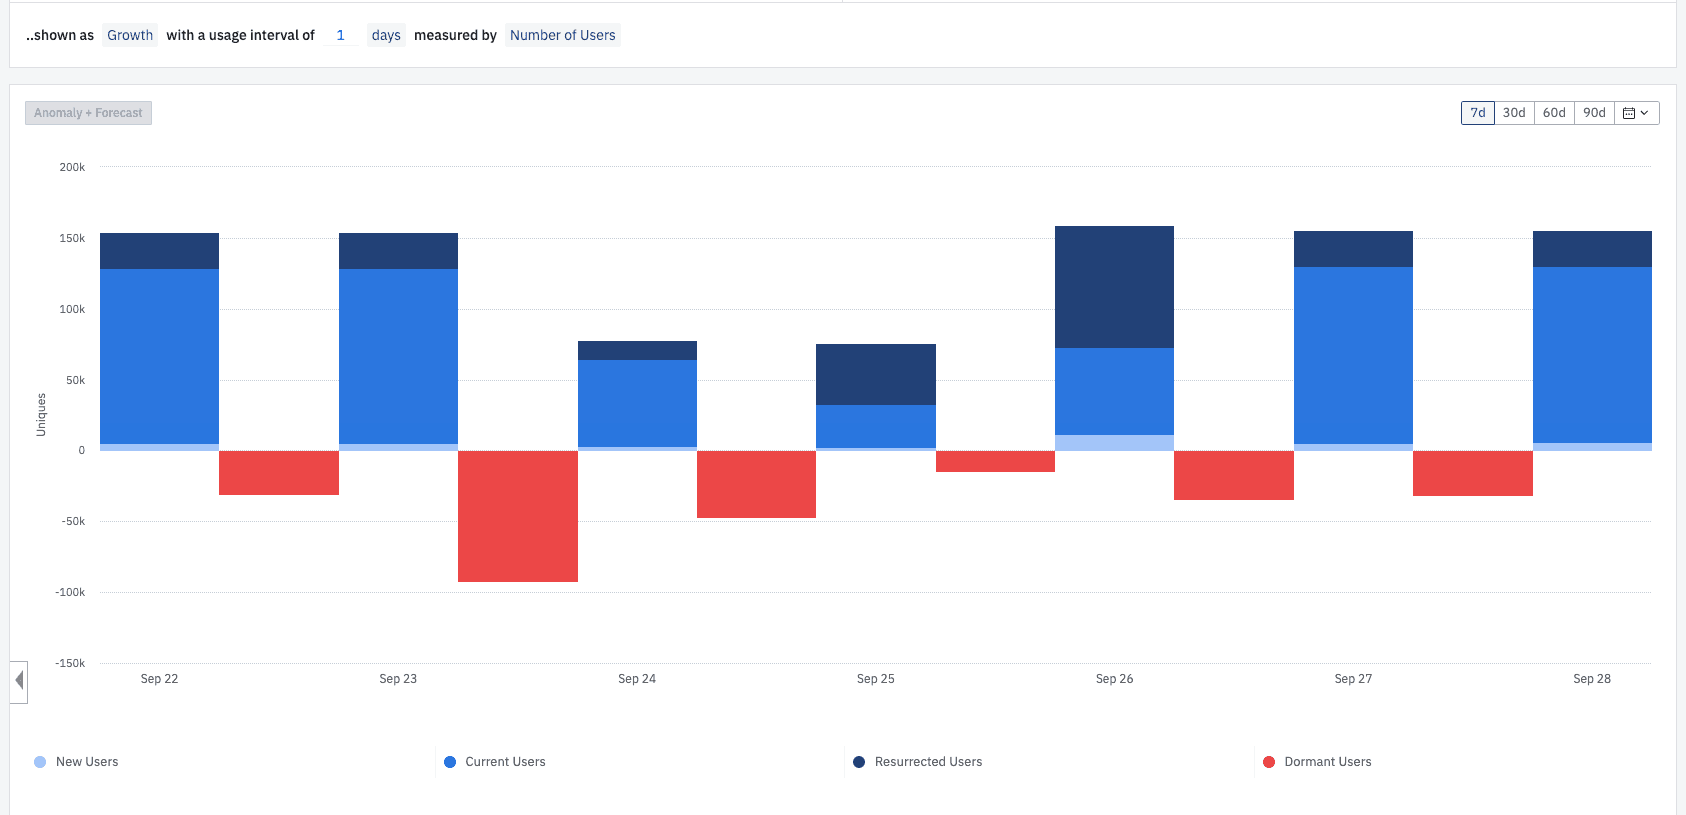
Before you can predict churn, you need to understand your customer lifecycles. A product analytics tool like Amplitude Analytics can break your active users into four subgroups: new users, current (active) users, resurrected (formerly inactive) users, and dormant (inactive) users. You should keep an eye on each group of users to ensure your product’s user base is growing over time.

Amplitude’s Lifecycle chart gives you a quick, easy-to-understand overview of your product’s user growth.
This view helps measure churn in an ongoing manner, so you can take action to reduce it. You should strive to grow your current and resurrected user counts by keeping users engaged or giving them a reason to become active again. You’ll also want to lower your dormant user count; if this group starts growing, you may have an engagement problem on your hands.
Churn prediction model: The key to improving customer retention
Thanks to tools like CRMs and analytics software, companies can access large datasets full of information about their customers throughout their lifecycles. This historical data is crucial in building your customer churn prediction model using tools like Amplitude Audiences.
You can build your churn prediction model by following five steps.
1. Identify your churn prediction goals
The first step to ensure optimal churn prediction model performance is to identify and define what you’d like to achieve from your model. At a high level, you are aiming to:
- Reduce customer attrition by identifying which of your customers are at the highest risk of churning.
- Understand the reasons why your at-risk customers might be likely to churn.
- Design and implement changes in the customer journey to promote retention for your at-risk customers.
2. Data preparation
Whether through your CRM, analytics software, or direct customer feedback, you collect data from your customers at every touchpoint of their purchasing journey.
Collecting relevant customer data and having it ready for classification and extraction is the second step toward building your churn prediction model. If you’re using an analytics tool, read our Guide to Behavioral Data & Event Tracking to learn how to collect accurate data.
3. Working with features
Use feature engineering to represent and categorize customers based on the features that likely make them churn. There are five types of features when discussing customer churn:
- Customer features: These are general, demographic-based information about the customer, such as their age, how much they earn, and their level of education.
- Support features: These refer to the interactions your customers have with your customer support team, including the number of emails sent, time to resolution, and satisfaction ratings after the issue is resolved.
- Usage features: These describe elements of how a customer uses your product or service. For example, the average call duration for telecom company customers or the number of times users log into an app.
- Contextual features: These include any context-based information a company has about the customer. This could be the OS system they use on their device or their past purchases.
- Behavioral features: These are the specific behaviors and actions customers take inside your product. For example, the number of times a user shares a playlist in a music-streaming app.
Once you have identified the features to focus on, you will need to extract them to standardize the variables or attributes. You should only select the information that is relevant for analyzing churn.
4. Build your model
ML algorithms typically work using binary classification, which organizes your target variables and gives them a true or false value. In other words, did that specific feature cause your customer to churn or not? For example, does uninstalling the app off their phone typically lead to customer churn?
Another common predictive model is a decision tree, which uses any available features and provides potential results. The decision tree model will provide multiple scenarios to see whether or not a customer will churn.
In the case of companies working with larger datasets, you could build predictive models on numerous decision trees, also referred to as a random forest. In a random forest, every decision tree has a classification with either a positive or negative answer. If the majority of decision trees provide positive answers, the final prediction will be positive.
5. Monitoring your model
Once your model is ready, it is time to integrate it into your prediction tool. With this tool, you can test and monitor your model’s performance and make any adjustments to the features if necessary. You implement your chosen model and send it into production. If it performs well, you can either update your existing application or use it as the focus of a new product.
Further reading
Learn more about predictive analytics with the following resources:
- How to Use Predictive Customer Analytics to Convert Users: Know what your customers will do before they do it to refine product pricing, inform marketing campaigns, decrease churn, and increase lifetime value.
- Marketing Forecasting 101: Using Analytics for Future Insights: Use marketing forecasting to predict future performance and optimize your product and marketing strategies accordingly.
Building a prediction model in an analytics tool
Let’s walk through how to build a prediction model in an analytics tool like Amplitude.
1. Define a starting cohort or group of users

2. Predict their future outcome state
Predictions use past behavior to predict future behavior. An analytics tool like Amplitude will look at users who were in the starting cohort two periods ago and identify the users who reached the desired outcome one period ago, as well as those who did not.

3. Rank and score users based on this model
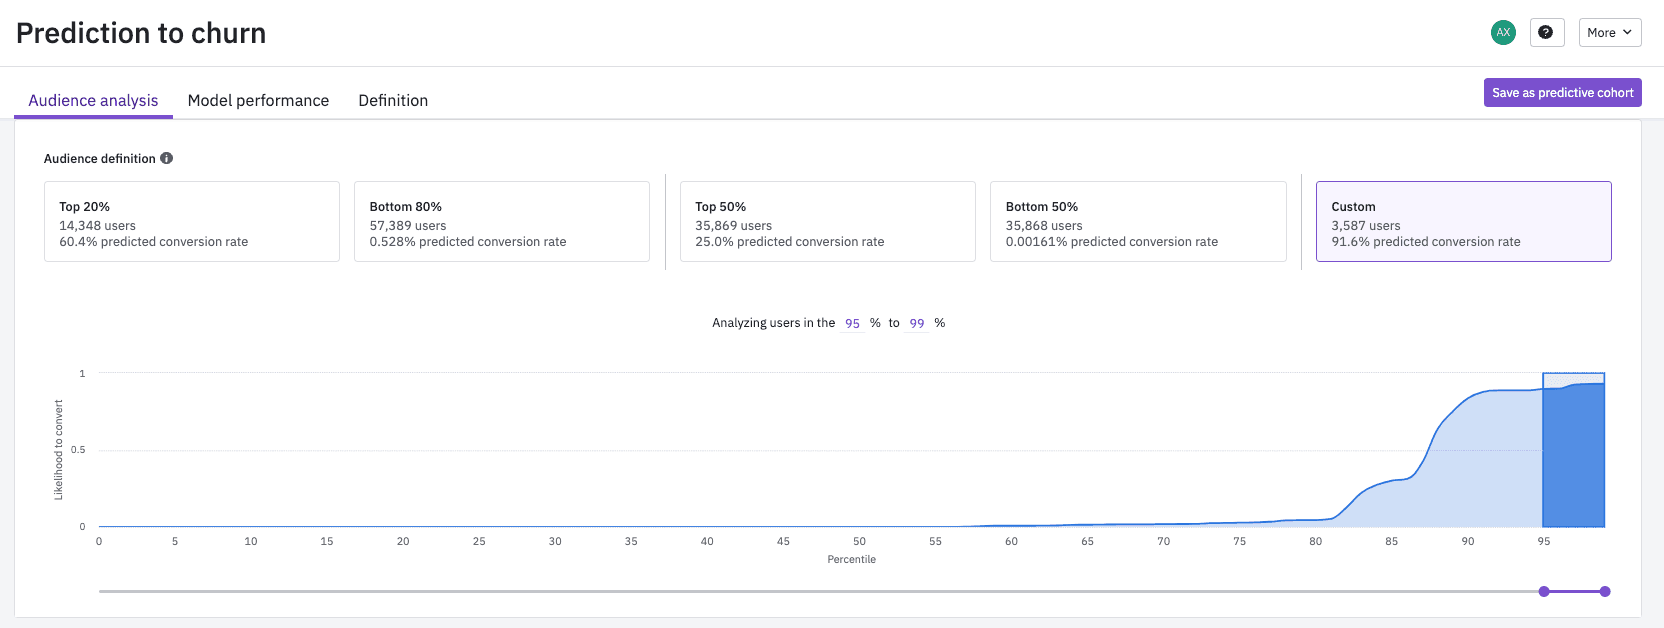
The predictive model calculates a probabilistic score for every user in the starting cohort to reach the desired outcome in the next 7, 30, 60, or 90 days. The model retrains every day to account for seasonal data.
The image below looks at the top 5%.

4. Use predictive cohorts to inform your product and marketing strategies
You can use predictive cohorts to segment users based on their likelihood to churn. Turn your ranked users from step 3 into a new cohort and retarget them by:
- Including them in marketing campaigns designed to increase retention
- Offering dynamic pricing, including discounted rates or special offers
- Personalizing content and product experiences based on their preferences
- Adjusting messaging frequency based on their likelihood to convert or drop-off
- Running custom A/B tests to experiment with new website or product changes
For example, if you find a cohort of users with a high likelihood of churning, you might use inverse pricing tactics to offer them a larger discount or incentive.

An entertainment-streaming service might offer customers with a low likelihood of upgrading a “Get 3 months free” promotion to increase retention.
Further reading
Learn more about cohort analysis with the following resources:
- Cohort Analysis: Reduce Churn & Improve Retention: Your users aren’t all the same, and you shouldn’t treat them that way—use cohort analysis to understand the differences and improve retention.
- Step-by-Step Guide to Cohort Analysis & Reducing Churn Rate: Follow this step-by-step guide to conduct a cohort analysis that will help you reduce churn.
Getting started with churn prediction analytics
Despite how complicated churn prediction might sound, it’s easy to do with the right tools. Amplitude empowers non-technical teams to build complex AI models without writing code or relying on engineering resources and dependencies. Simply use a self-service interface with point-and-click actions to build a powerful model to predict and reduce churn. Try it yourself for free with Amplitude’s starter plan.
Watch the video below to learn how to calculate churn in our self-service demo experience.
References

Darshil Gandhi
Director, Product Marketing, Amplitude
Darshil Gandhi is a Director of Product Marketing at Amplitude. He leads global technical and partner product marketing, collaborates with product and go-to-market teams on strategy, positioning, messaging, campaigns, and enablement. He was previously a solutions consulting team principal at Amplitude, and has helped dozens of Amplitude customers turn their data into actionable insights. Darshil graduated from Dartmouth College with a Masters in Engineering Management.
More from Darshil


