How to Measure True ROAS in Ecommerce: Amplitude + Shopify
Discover how one growth marketer determined true return on ad spend across channels for a Shopify brand.
Jamie Dunbar Smyth has spent the last twelve years working in growth roles across various industries including fintech, martech, and ecommerce. Most recently, Jamie worked with Common Clouds, a rapidly growing ecommerce brand leveraging Shopify for their point-of-sale platform.
In this episode of How I Amplitude, Jamie demos in real-time how he measures the true cost of acquisition and return on advertising spend (ROAS) for Common Clouds across a variety of marketing channels.
As new channels are added, you’ll truly know why things are working and why they’re not.
Key highlights
How do we know what’s working and what’s not?
When Common Clouds approached me, they were in a position many startups dream of—being profitable after just two years in business. But this small Swedish skincare brand, with products ranging from 150 to 300 SEK ($15 to $30 USD), was facing a critical challenge:
They were struggling to confidently say which growth channels were profitable.
Without clear insights, Common Clouds risked throwing money at underperforming channels while neglecting the ones actually driving growth. With ecommerce’s tight margins, one wrong move could have easily eaten away their profitability and stopped momentum in its tracks.
Take their Klarna affiliate program, for instance. At first glance, it looked promising—decent conversion rates, steady traffic.
But I knew from experience that surface-level metrics can be deceiving.
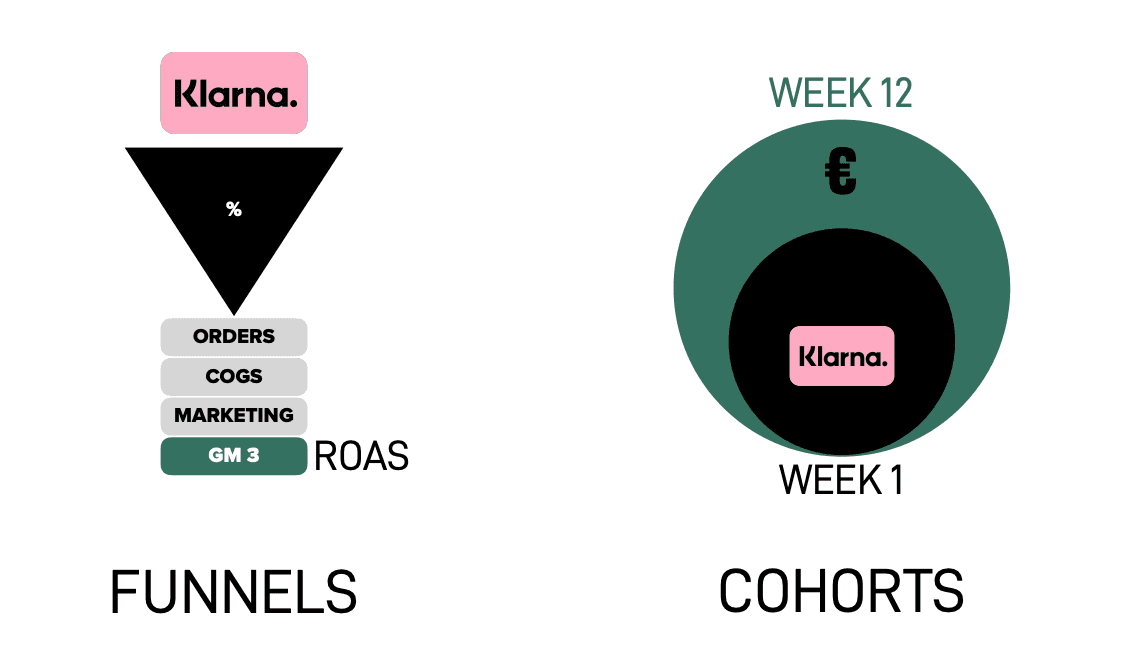
A channel may show positive ROAS while the business suffers due to high costs from shipping or marketing inefficiencies. To understand the true ROAS, I needed to go deeper and account for costs like:
- affiliate costs
- influencer fees
- shipping
- transaction fees
- COGS (Cost of Goods Sold)
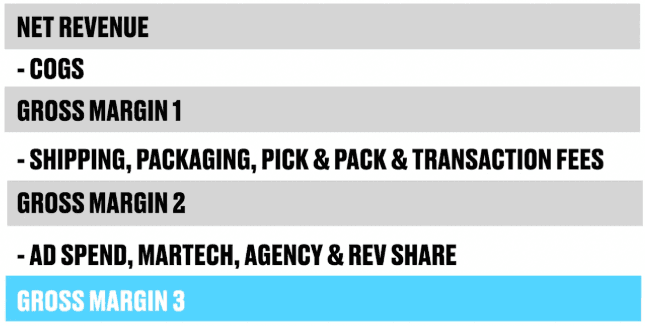
This full accounting of costs is Gross Margin 3 (GM3)—deeper and more accurate than the sales minus COGS of a typical gross margin or a GM2 that looks at fulfillment costs too. By calculating a GM3 not just for Klarna but for every marketing channel they were using, I created a comprehensive view of each channel’s actual contribution to profitability.
Big picture, my plan involved three phases:
- Create a single source of truth to set the data foundation
- Define the rules of engagement for interpreting the data
- Monitor what matters from a bird’s-eye view, then experiment and optimize

Phase 1: Create a single source of truth
Using the Amplitude Shopify plugin, I was able to get everything hooked up in just three days. Here are the steps I took to make that happen:
Connecting the data
I began by integrating Shopify with Amplitude.
And just like that, 162 separate events with up to 100 properties each were flowing automatically into Amplitude. Normally, when you're setting up analytics with a development team, you're fighting to get more data—with the Amplitude integration, you're overwhelmed with data.
Of course, I didn't know what data was what, though, so I still had to clean and focus it to make it usable.
Educating myself on the events
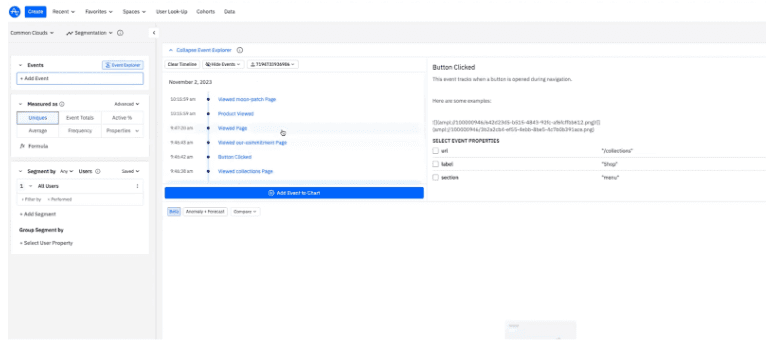
I did this by simply clicking around the Common Clouds website and interacting with every clickable element to generate events.
Then, inside Amplitude, I went into the segmentation graph, opened the Event Explorer, and watched the data flow in.
This step is key: Knowing how your events and properties work is like learning the local dialect of the language that is data. Without it, you will miss all of the eccentricities and details that really make the data come alive.
Educating myself on the user flows
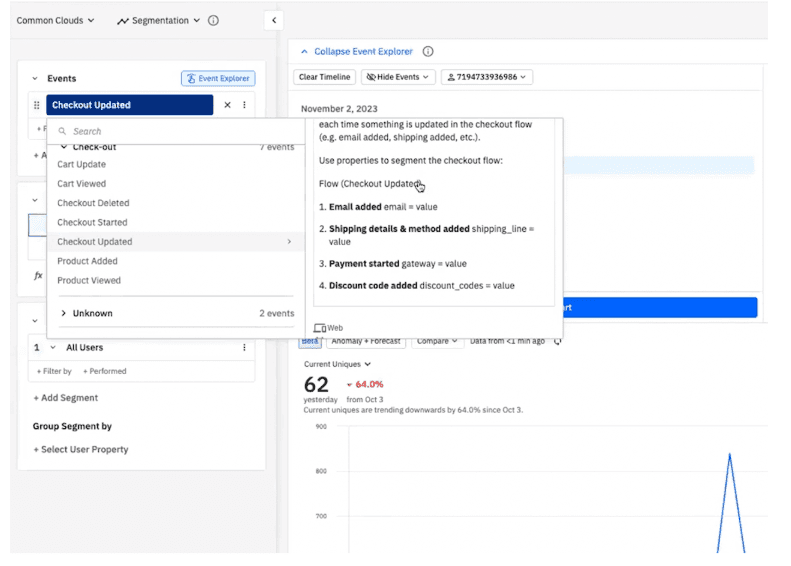
To understand user flows—most crucially the checkout flow—I looked for certain events that remained consistent throughout the flow while their associated properties changed.
Drilling into the “Checkout Updated” event, for example, let me identify exactly when key actions occurred in the checkout flow, such as discounts being applied or shipping details being finalized. The event itself didn’t change, but its properties did.
Leveraging array splitting
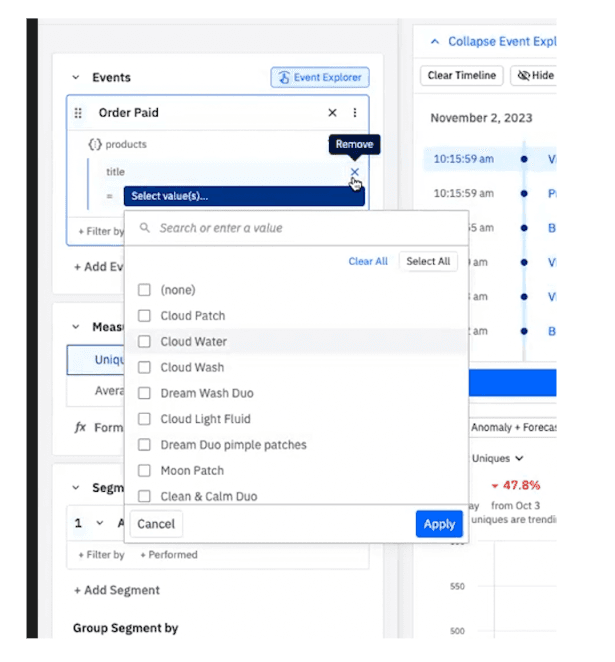
One of the most powerful features of Amplitude is its ability to handle properties that come in as arrays, such as “products” and “discounts.” These arrays represent multiple values tied to a single event like “Order Paid” for example.
For example, let’s say a customer buys three different skincare products in one order: an acne treatment, a moisturizer, and a cleanser. Without array splitting, you’d just see one “Order Paid” event with all three products lumped together. But by using Amplitude’s array splitting functionality, you can break that single order into its individual components and analyze each product separately.
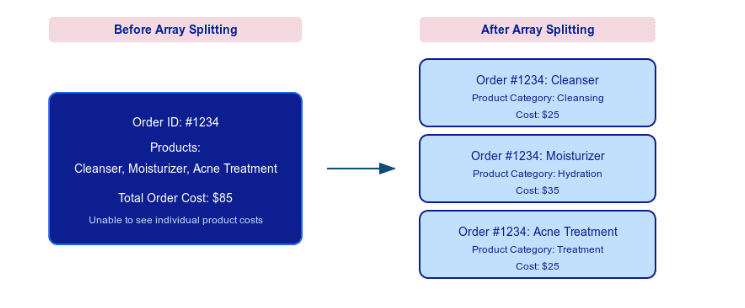
Here’s how to turn on and use this functionality:
- Locate Array Properties: Navigate to the event properties in Amplitude and identify those that are arrays. Common ones include “products” (listing all items in a cart) and “discounts” (listing all discounts applied).
- Enable Splitting: Use Amplitude’s array functionality to split these properties. This creates separate entries for each value in the array, allowing you to analyze individual items or discounts within the context of the overall event.
- Analyze each product separately: Splitting the “products” array lets me:
- Break down the titles, categories, and prices of each product in a customer’s cart.
- Analyze which product combinations are most frequently purchased.
- Determine how individual items contribute to revenue and conversion metrics.
Setting up Google Ads integration into Amplitude
To bring this back to ROAS, I wanted to see Common Cloud’s ad spend metrics alongside all the other data.
Implementing the Google Ads integration for additional insights on ad performance and spend metrics was crucial because it enabled me to bring essential advertising data directly into Amplitude.
For example, here’s the daily ad metrics and the properties that I get there all coming in automatically via the integration.
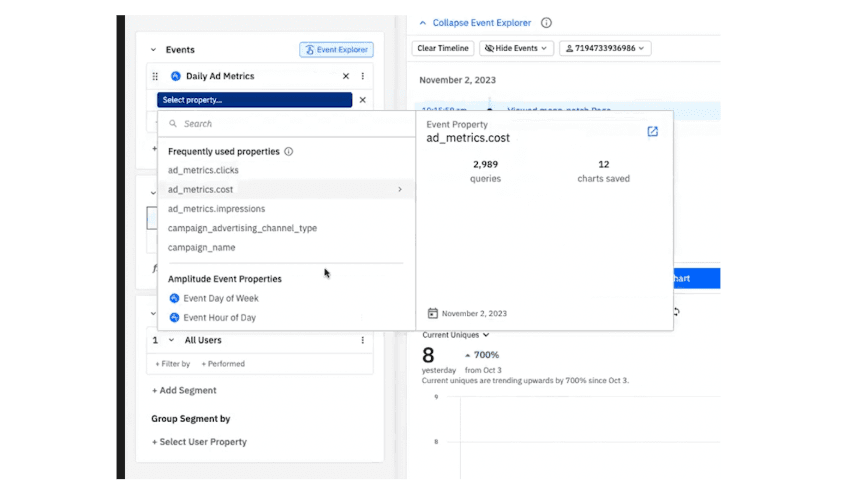
The result of this first phase: Common Clouds now had a single source of truth for all of its marketing efforts.
Phase 2: Define the rules of engagement
With the data foundation established, I moved on to creating a unified structure for interpreting the data.
Standardizing UTM Tracking
UTM tracking means adding unique parameters to URLs to capture information like where traffic is coming from, what medium or campaign it’s tied to, and other relevant attributes. It’s a way to track specific marketing activities, like ad clicks or affiliate links, and see their impact on traffic and conversions.
I standardized UTM tracking using Amplitude’s Channel Classifier to categorize and attribute marketing efforts into paid, organic, and affiliate sources.
To access the classifier, navigate to Data > Properties > Channels.
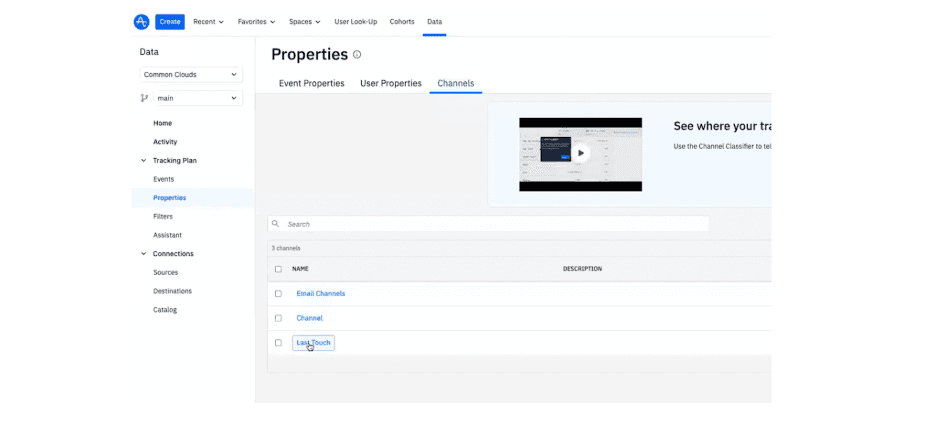
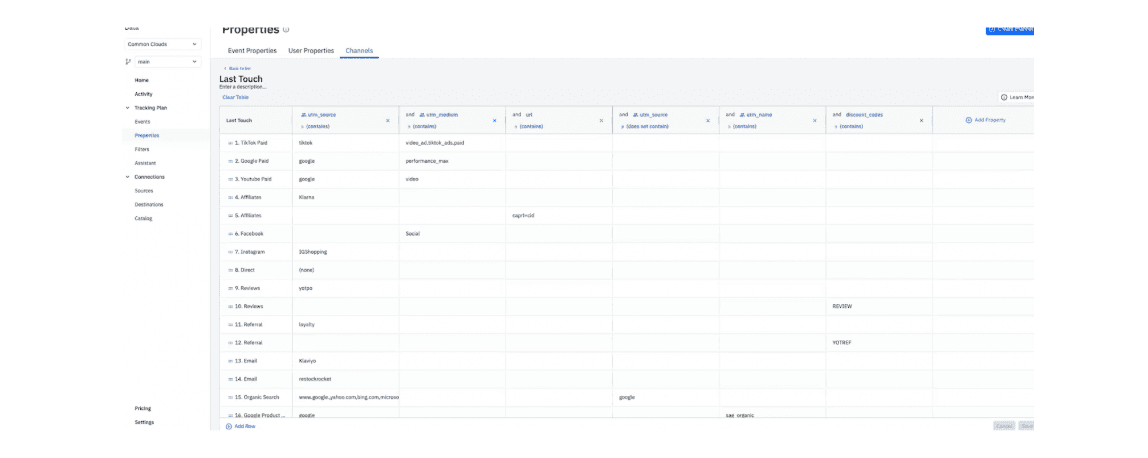
From there, I defined rules for each channel by specifying conditions like UTM parameters or referral sources.
This setup allowed me to group traffic into meaningful categories that the Common Clouds team could use when making decisions, generating reports, etc.
Here's an example of my setup:
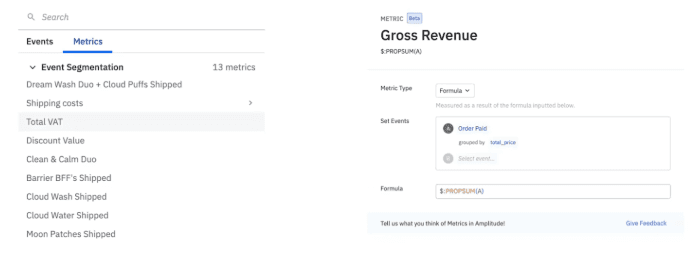
Getting everyone to agree on how metrics are defined
You may think everyone is on the same page but trust me, there’s a good chance they aren’t. Does everyone on the team define net revenue, gross margin, and ROAS the same way?
Establishing clear definitions for the company is key.
Once aligned, set up those definitions properly inside of Amplitude:
Phase 3: Monitor what matters, experiment, optimize
By tracking everything in Amplitude, I was able to get a true bird's-eye view of all channels and platforms.
Instead of assessing each channel individually, I could analyze them side-by-side in a unified dashboard. This allowed me to pinpoint the channels that were driving sales but ultimately losing us money.
Here’s the step-by-step process for creating this dashboard and mapping your gross margins.
Populating relevant costs per product
The first step in this approach was to fully understand gross margins, which involved breaking down costs and revenues to determine profitability at each level.
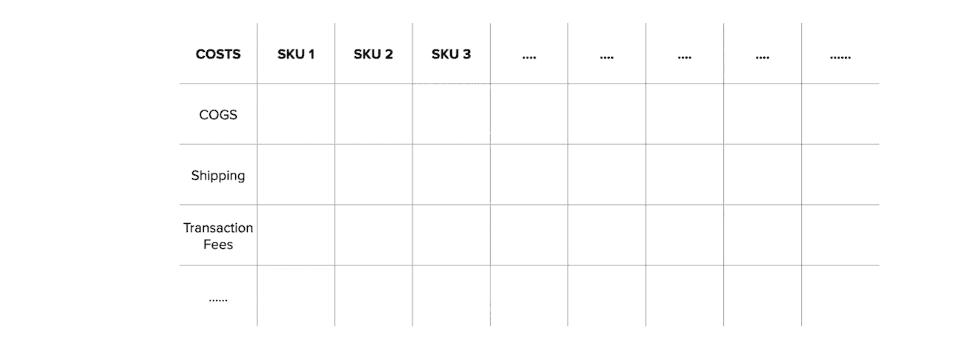
I started by creating a detailed cost table in a Google Sheet. This included all relevant cost components on a per-SKU basis:
- COGS: The direct cost to produce the products.
- Shipping/packaging and transaction fees: These varied per product and needed to be tied to specific SKUs.
Mapping out metrics that matter per channel
Now I wanted to align on the important metrics to track per channel, so I defined them in a table like this:
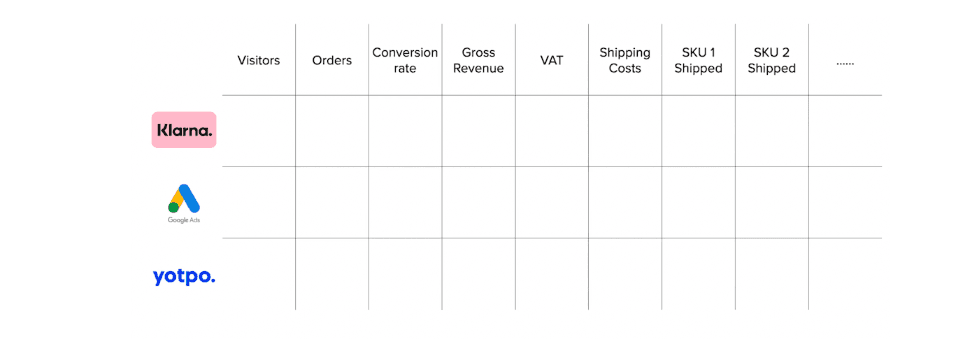
Then, I built out a channel performance table in Amplitude to show me the real-time performance for each of these identified metrics across each channel.
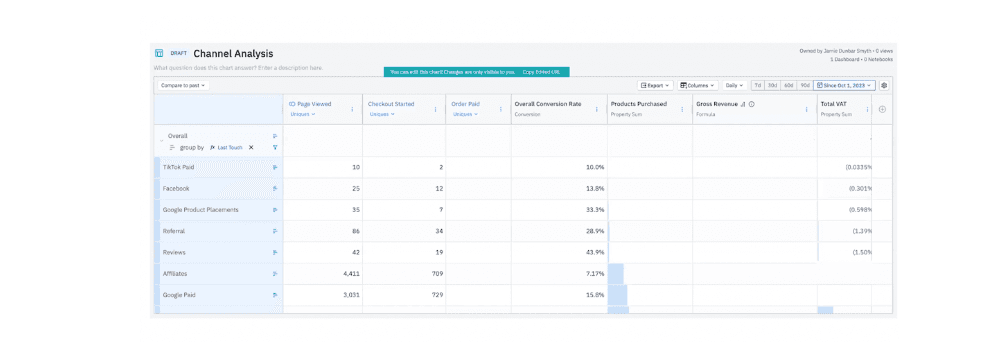
Now I had a granular dashboard showing at how each channel was performing, but I still didn’t have enough information to calculate the various costs attributed to each of these channels.
Piping data into Google Sheets
In order to bring the various costs together, I used the Amplitude Sync to Drive and Sheets extension in Google Sheets:

Calculating channel performance
With everything in Google Sheets, I was finally able to combine the SKU data, channel data (via Amplitude), and the cost data (pulled in separately via each channel) to calculate GM3 and determine the true ROAS for each channel.

Bringing this all into one view, I can now monitor these metrics live and identify true channel profitability.
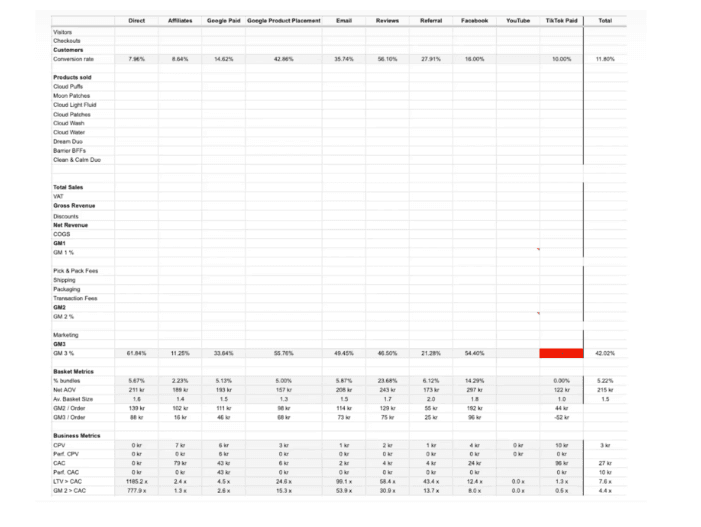
For example, note that the TikTok is showing a negative GM3 in month one. That isn’t great, but it’s also not anything too concerning since what really matters is tracking cohort performance over time. Unfortunately, I can’t share that data publicly, but I can say generally that what we’re looking for here is the break-even point for a cohort. Does it happen after two months? Six? Tracking this data over time will allow you to zoom out and identify the right inflection points.
Wrapping up
For other teams looking to replicate this success, I’d emphasize the importance of getting the fundamentals right by following this three-step process:
- Create a single source of truth
- Define the rules of engagement
- Monitor what matters, experiment, optimize
Perhaps most importantly, this solid data foundation will scale with your business. As new channels are added, you’ll have the infrastructure to understand what’s working and what’s not.
Join Jamie and connect with more peers and experts using Amplitude every single day.

Jamie Smyth
Growth Advisor
I help venture-backed startups from seed to series C drive growth through data-driven strategies. From ecommerce to fintech, I support businesses across the full customer lifecycle to unlock funding, boost revenue, and achieve profitability. My passion lies in leveraging customer insights to craft compelling cross-channel journeys. By establishing robust data foundations and a culture of experimentation, I've helped companies raise over $80M in funding and optimize marketing for businesses generating €1-40M in revenue.
More from Jamie


