Click-Through Rate (CTR): How to Calculate and Increase Your CTR
Learn more about how to calculate click-through rate (CTR) and how to increase your CTR.
Originally published on November 16, 2023
Browse by Category
Knowing your audience is vital to connecting with and convincing them to purchase your product or services over those of a competitor. One metric that helps you understand and measure your audience’s engagement with your brand is click-through rate (CTR).
Click-through rate (CTR) tracks the percentage of clicks your paid ad or organic link receives out of the total number of times it’s displayed to potential visitors.
Tracking CTR is one of the most quantifiable ways to gauge user interest and the effectiveness of your messaging. This article breaks down CTR and how to increase it to get more people to click through to your content.
Key Takeaways
- CTR measures how many people click on an ad, search result, or call to action compared to the total number of people who see it.
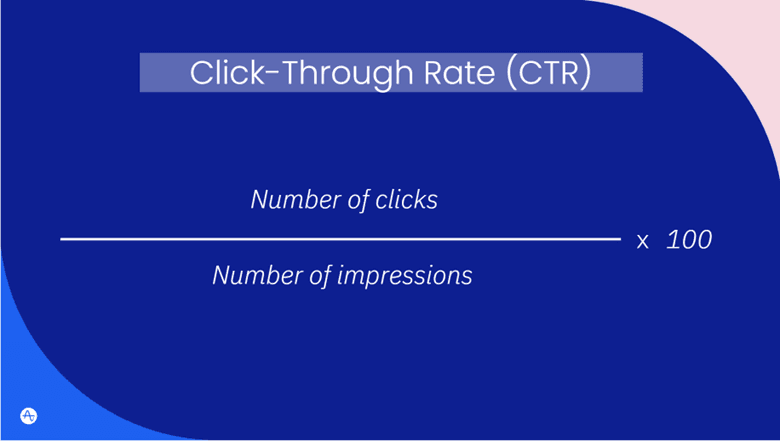
- Your CTR is calculated by dividing the number of clicks by the number of impressions and multiplying the result by 100 to get the percentage.
- You can use audience segmentation, targeting, compelling copy, and A/B testing to increase your CTR.
- Data analytics platforms can help you increase your CTR by gathering and consolidating vast amounts of data related to user interactions with your ads or products.
What is a CTR?
CTR measures the number of people who click on an ad, search result, or call to action out of its total number of impressions—aka the total number of people who see it.
Businesses use CTR to assess the effectiveness of their online campaigns, including pay-per-click (PPC), social, email, and more. Measuring CTR can help you understand which products, visuals, and messaging resonate most with your target audience. It shows your campaign’s success in getting potential customers to take a specific action.
How to calculate CTR
To calculate your click-through rate, you divide the number of clicks by the number of impressions and then multiply the result by 100 to get the percentage.

Suppose you run a PPC advertising campaign on Google Ads. Your ad is displayed 10,000 times, so it has 10,000 impressions. If it receives 200 clicks, your CTR would be 2%, calculated as follows:
- CTR = (200 / 10,000) x 100 = 2%
Similarly, let’s say you want to calculate the CTR for a Facebook ad campaign. You create a sponsored post that appears in users' news feeds 50,000 times. This post contains a link to your product and receives 750 clicks. Your CTR for this Facebook post would be 1.5%, calculated as follows:
- CTR = (750 / 50,000) x 100 = 1.5%
What is a good average CTR?
What constitutes a good CTR for one company may not be the same for another. Consider two ecommerce businesses, Company A and Company B, both running online advertising campaigns. Company A operates in a highly competitive industry, where a CTR of 2% is considered good due to the fierce competition for clicks. Company B operates in a niche market with less competition, where a CTR of 5% is more achievable with effective targeting.
The key is to use your own historical CTR as a benchmark so you can continuously monitor, measure, and improve the performance of your campaigns. Business leaders and marketers often track their CTR monthly to monitor fluctuations and understand what causes increases or decreases. CTR tracking enables them to make informed campaign decisions to drive better results.
While CTR benchmarks can vary by company, it may be helpful to know the average rates across different channels:
|
Channel |
Average CTR |
|
1.2% |
|
|
3-5% |
|
|
Around 2.91% |
However, take these numbers with a grain of salt. For example, if your CTR is consistently improving but is slightly below the average, we’d recommend continuing to focus on making continuous improvements over meeting the industry averages.
How to increase your CTR
Here are a few ways to increase your CTR while still providing genuine value and meeting user expectations.
1. Audience segmentation and targeting
Audience segmentation and targeting is a great place to start when looking to increase your CTR. First, segmentation enables you to create tailored ad campaigns, making them more relevant to your target audiences. Directly addressing your audiences’ interests will make them more likely to click on the ads.
Second, targeting increases the precision of your campaigns and content by reaching the people who are most likely to engage with them. Whether it’s demographic, behavioral, or interest-based targeting, you can increase the probability of clicks from ideal customers and avoid wasting your ad budget on uninterested users.
With segmentation and targeting you can create ads that speak directly to your target audience's needs and interests.

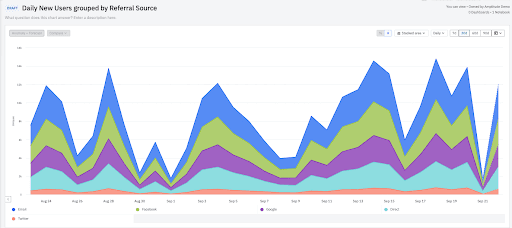
An example of a segmentation chart in Amplitude showing daily new users for an app over 30 days, grouped by referral source. Try this chart yourself in our self-service demo.
We recommend identifying and addressing your audience's specific challenges or problems in your campaigns. Offer solutions or benefits that directly alleviate those pain points. For example, if you’re selling running shoes, show how your product addresses and combats common running challenges, like avoiding knee or joint pain.
2. Compelling copy
Your copy and visuals become highly relevant when they align with your audience's needs. Relevance is a key factor that motivates users to click through. If your message speaks directly to their needs, they’re more likely to engage with it.
People usually read headlines first. Try to write headlines that immediately capture your audience’s interest while communicating the essence of your offer. A compelling headline should be concise, clear, and directly related to your users’ needs. Use action-oriented words, numbers, and emotionally resonant language to make your headlines stand out.
Spread relevant keywords throughout your copy. Keywords indicate user intent, and using the right keywords in your copy signals to users that the message is relevant to what they're searching for.
Lastly, ensure you have a clear call to action (CTA) that encourages users to click. Compelling CTAs avoid ambiguity and convey the specific action users should take.. Marketers often use action words to prompt immediate engagement, like “Buy Now” or “Learn More.” This language can create a sense of urgency and value.
3. A/B testing and experimentation
A/B testing can help you stay agile and adapt your marketing strategy to evolving trends and consumer preferences, ensuring your CTR remains competitive.
This kind of experimentation involves creating multiple variations of a webpage or other asset, with each version comparing a single, distinct change (e.g., different headlines, imagery, colors, or CTAs). A/B testing enables you to test different messaging styles, tones, and visual elements.
By comparing the performance of these variations, you can pinpoint which elements are most effective at driving clicks. For example, you might discover a headline with an informal tone generates a higher CTR than one with a formal tone, or that you get more clicks with a blue CTA button than with a yellow one.

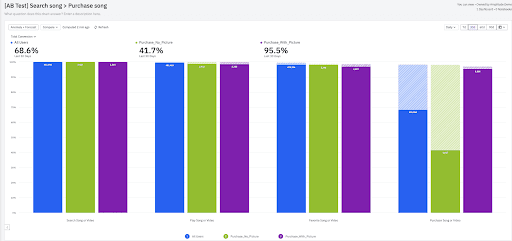
An example of an A/B Test Chart by Amplitude shows how including a picture can affect users' purchasing behavior. Try this chart yourself in our self-service demo.
A/B testing is an iterative process. Leading companies use insights from one A/B test to inform subsequent tests so they can continually refine their messaging and visuals. The iterations help product and marketing teams make informed decisions that resonate with their audience.
Use data analytics platforms to track and improve CTR
Data analytics platforms like Amplitude gather and consolidate vast amounts of data related to user interactions with your product and marketing channels. The data includes information on clicks, impressions, conversion, and bounce rates, which serve as the foundation for analyzing CTR and campaign performance.
Amplitude's data analytics tools can equip you with data and insights to track, analyze, and optimize CTR effectively. Amplitude solutions like behavioral analytics, automated reports, data visualizations, segmentation, goal tracking, and A/B testing and experimentation enable you to confidently make data-backed decisions.
Watch the demo to learn more about how Amplitudecan help you improve your digital marketing campaigns and drive higher CTRs, or get started today for free.

Katie Geer
Former Growth Marketing Manager, Amplitude
Katie is a former growth marketing and product manager at Amplitude focused on acquisition. Previously she was in product at Redfin where she focused on experimentation and data instrumentation.
More from Katie


