Why N Day Retention is the Metric that Matters for Mobile Games
The percentage of returning users is a key health indicator for mobile games. GoPractice CEO Oleg Yakubenkov explains N Day Retention and how it applies to the gaming industry.
Originally Published on February 14, 2020
Browse by category
Retention rate is one of the fundamental metrics in product management. We all use it regularly, yet few of us know that there are many different ways to calculate mobile retention rate. When it comes to measuring the performance of mobile games, however, I recommend using N day retention data.
Let me start with a story. When I worked at Zeptolab (a popular game development company responsible for Cut the Rope, King of Thieves and CATS) we received an email from a game development studio that wanted us to publish their game. While we were used to receiving these types of emails, this one got our attention. We were impressed by the metrics of the game, which had just recently soft launched. According to the developers, Day 1 retention of the game was over 55 percent, and Day 7 retention was over 25 percent.
However, when we started playing and testing the game, we noticed an inconsistency: the gameplay was not engaging enough to justify a greater than 55 percent Day 1 retention rate. Based on this hunch, we investigated further. As it turns out, the metrics that were presented to us actually represented unbounded retention (or rolling retention). Classic N Day retention of the game happened to be unimpressive.
What Is N Day Retention?
N Day retention shows the percent of users who return to the app on a specified day after their first launch.
For example, if Day 2 retention is 50 percent, it means that 50 percent of new users launched the app on day 2.
By comparison, unbounded (rolling) retention measures the percentage of users who return to the app on a specified day or any day after that.
If Day 2 unbounded retention is 50 percent, it means that 50 percent of new users returned to the app on day 2 or later.
N Day Retention Compared to Unbounded Retention
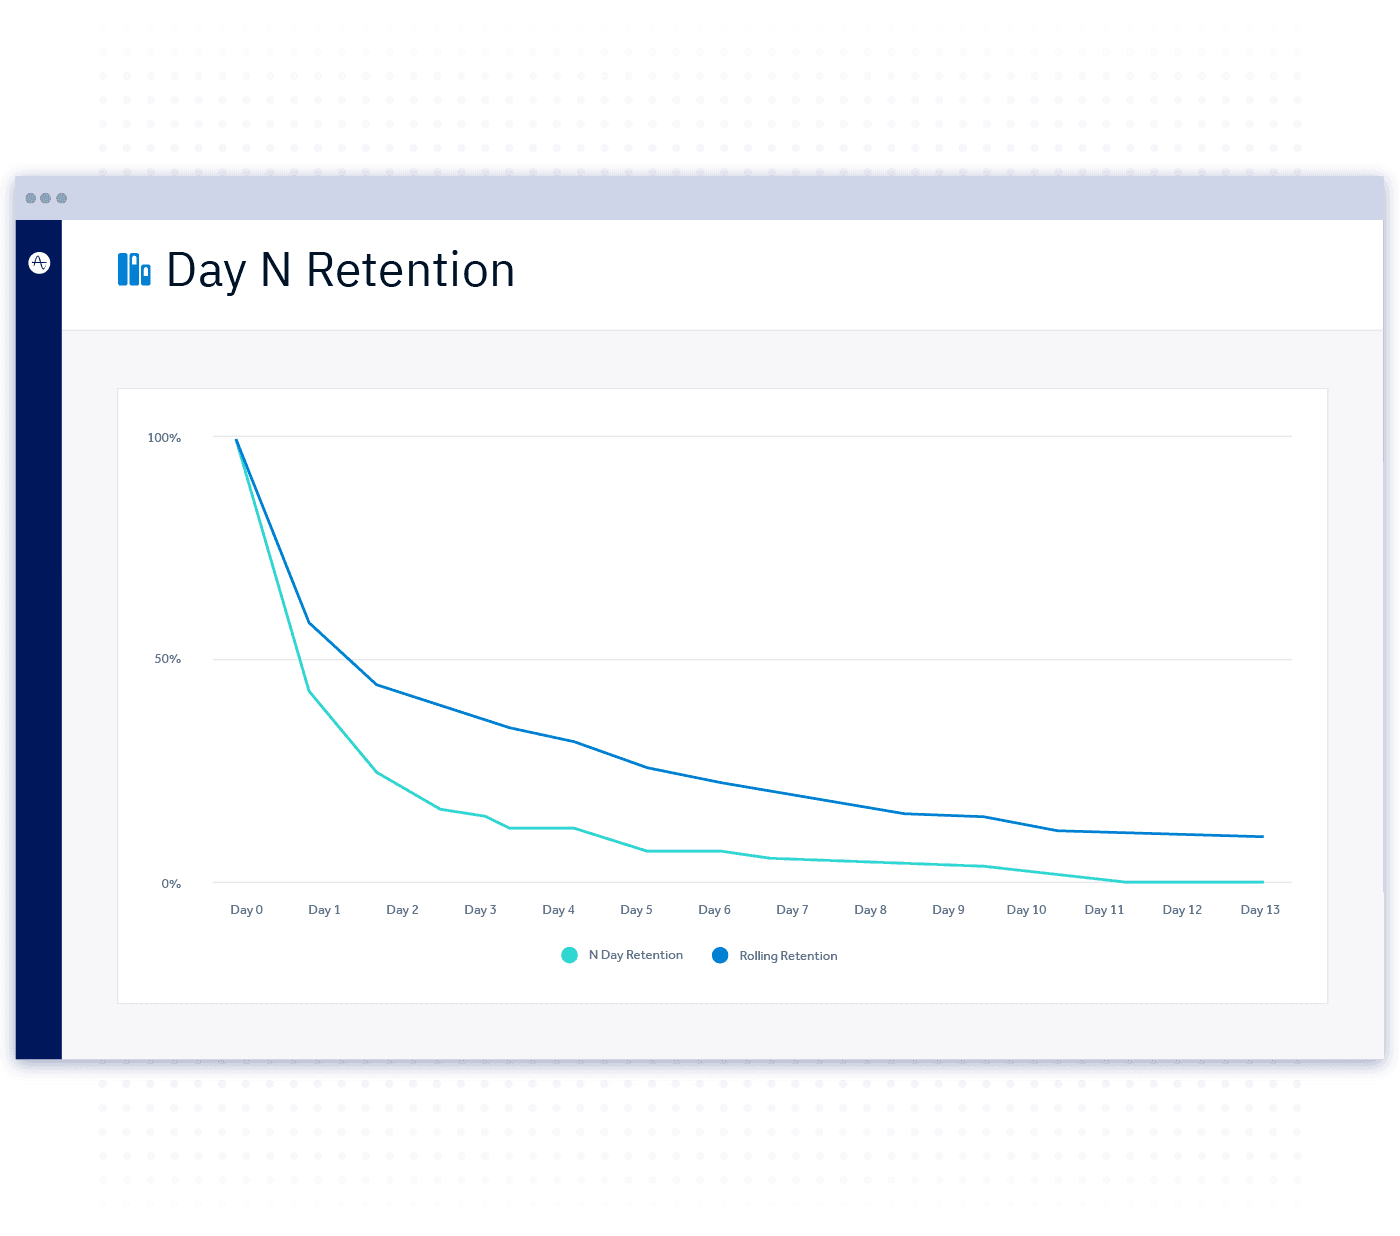
On this graph you can see how N Day retention compares to unbounded retention for the same mobile application.

Day N Retention on Amplitude
The gap between these two metrics is quite noticeable. Therefore, based on which retention rate you analyze, you may come to different decisions about the product’s future development direction.
Let’s take a closer look at the difference between Day 1 classic and unbounded retention.
- Day 1 classic retention is 43 percent, which means that 43 percent of new users launched the app on day 1 after they started using it.
- At the same time, Day 1 unbounded retention is 59 percent, which means that 59 percent of new users launched the app on day 1 or later.
When to Use N Day Retention
With N Day retention, you know the exact percent of users who returned to the app by the time N days have passed since the first launch. For daily use applications—such as mobile games—N Day retention is a much more useful metric than unbounded retention because it does a better job of showing active users from day to day.
That’s not to say N Day retention is always the best retention method to employ. Based on use case, a successful interaction with a product might mean that a user returns every 30 days over a long period of time. For example, if you’re developing a mobile rent payment app, you might intend for users to engage with your app only once a month to make a payment. In this case, unbounded retention would be more useful to your team than N Day retention.
Calculating N Day Retention by 24-hour Windows and Strict Calendar Dates
In addition to the differences between N Day retention and unbounded retention, it’s important to understand the nuance between calculating N Day retention with 24-hour windows or strict calendar days. The values of N Day retention can vary significantly depending on which method you use to calculate it.
When retention is calculated by 24-hour windows, retention charts will measure each user on their own rolling 24-hour windows, where Day 0 runs from the exact time of the first event (usually the first time the user launches the app) through the next 24 hours. Day 1 runs from hour 24-48, and so on.
Let’s say we calculate retention by a 24-hour window and Day 1 retention is 10 percent. What this means is that, say out of 1,000 users, 100 came back and triggered some event between the 24th and 48th hour after their respective start action (e.g. User X launched the app for the first time on Tuesday at 4:00 p.m., and then reopened the app sometime between Wednesday at 4:00 p.m. and Thursday at 4:00 p.m.).
When retention is calculated by strict calendar dates, retention charts will measure each user based on actual calendar dates. This means that if a user launched the app for the first time on October 1st at 11:00 p.m., their day 1 will be October 2nd, even though their day 0 lasted no more than an hour (from 11:00 p.m. to 12:00 a.m.).
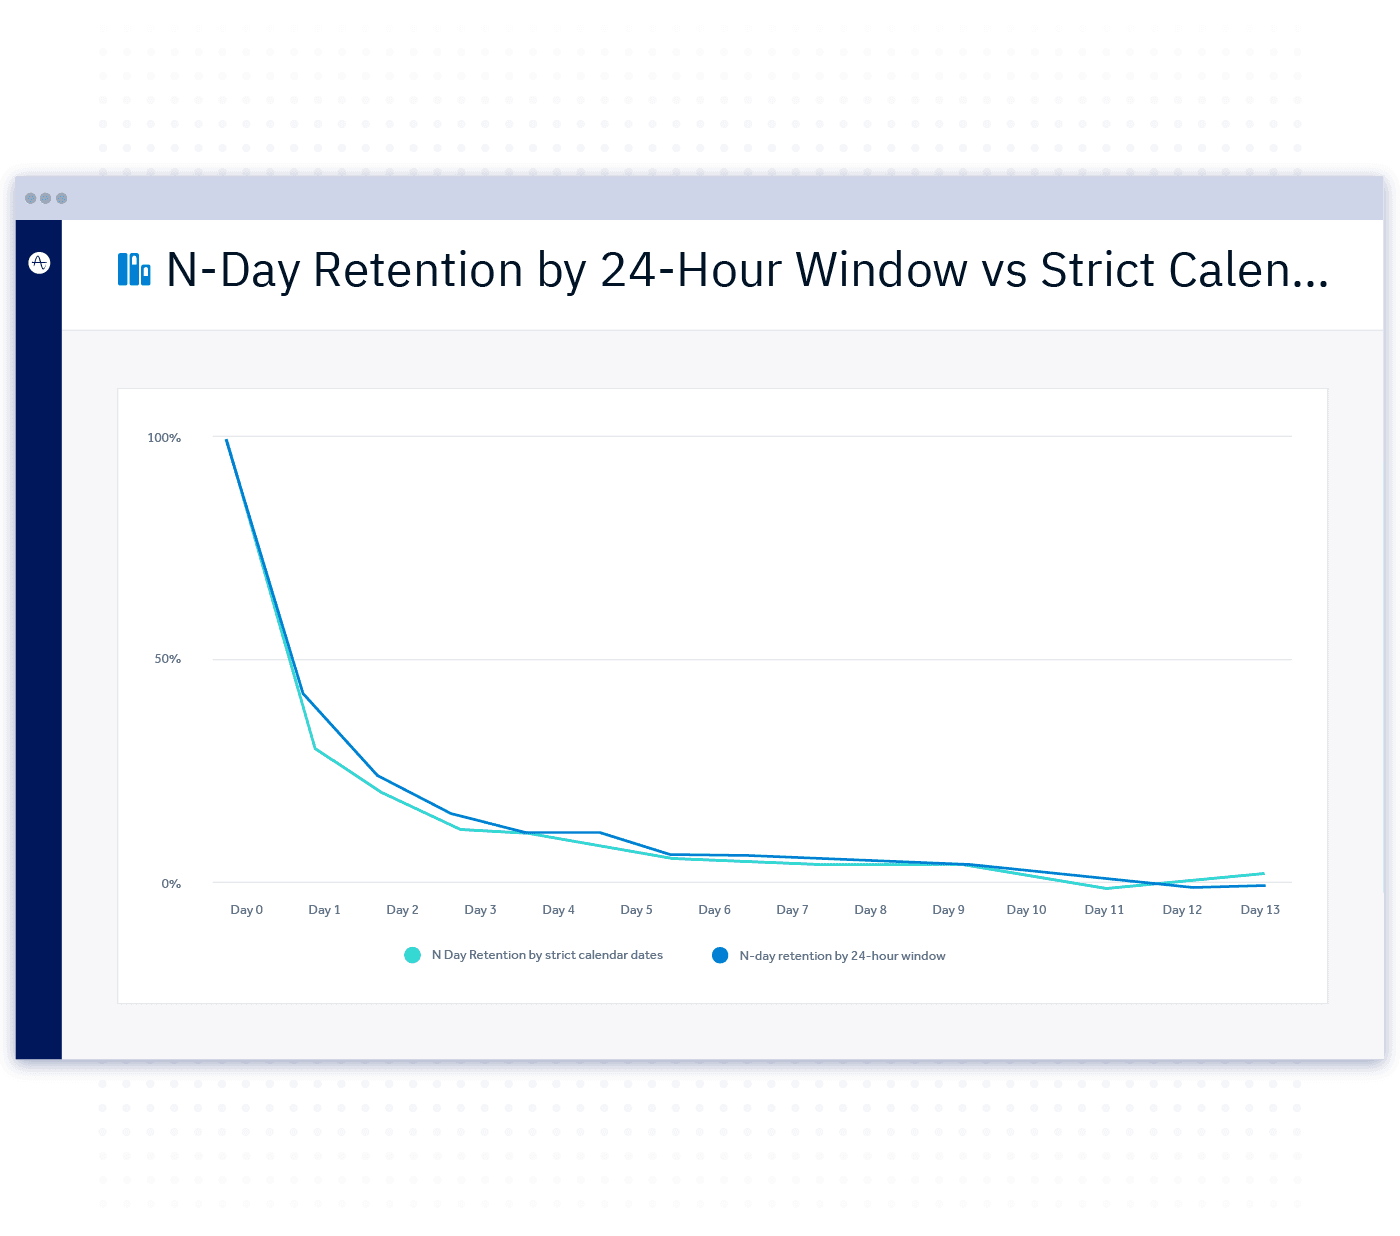
On the graph below, you can see the 24-hour window and strict calendar date retention for the same app that we examined above, when we were comparing classic and rolling retention.

N Day Retention, shown in Amplitude
In this case, the maximum difference between two ways of calculating retention is visible in the first few days. Day 1 retention by calendar dates is 43 percent, while Day 1 retention by 24-hour window is only 32 percent. As we move further, the difference becomes less significant. Further down the timeline, the two lines almost merge.
Here’s why there’s a big difference in the Day 1 retention: Imagine a user launches the app for the first time at 11:50 p.m. on October 1st. The user then launches the app again 20 minutes later, on October 2nd at 12:10 am. The user never returns to the app afterwards.
In this case, if you’re calculating retention based on calendar dates, then the user will be considered as “returned” on Day 1. But if you’re using the 24-hour format, then the user will not be taken into account in the Day 1 retention report. For that, they would have had to open the app between October 2nd at 11:50 pm, and October 3rd at 11:50 pm, the 24-48 hour time window following their first event.
Cases like this, in which users launch an app for the first time before midnight and launch it again the next day before their first 24 hours expire, explain the difference seen between the two ways of calculating N Day retention.
Why is it important to know if the retention is calculated by 24-hour window or by calendar dates?
We often use retention metrics to compare products between each other or to compare our product against benchmarks. That is how we make sense of the numbers we see, and that is how we know if the app’s retention is strong or not.
Let’s say you are working on a casual mobile game, targeted at a wide, mass-market audience. You soft launch an early version of the game. After a few days, you calculate Day 1 retention. It happens to be 32 percent, and you don’t know if it is good or not. While you can find benchmarks online, you must keep in mind that those benchmarks might be reporting retention with strict calendar dates instead of 24-hour windows. If you make decisions based on benchmarks rooted in strict calendar dates, while you calculate retention based on 24-hour windows, you could make a misinformed decision.
Which method of calculating N Day retention works best?
There is no one-size-fits-all solution for calculating N Day retention. I would say that calculating retention based on 24-hour window will give you a more accurate answer to the question, “What percentage of users return on Day N?” However, it takes longer to get this data when you calculate retention by 24-hour window. For users who launched the app for the first time on a specific day, you will get the Day 1 retention only in two days (48 hours). In contrast, when you calculate retention by calendar dates, it will only take 24 hours to get Day 1 retention.
Considering this, I would use retention calculated by calendar dates when I need the data quicker. For example, for marketing analytics, where every day incurs extra ad costs, using the calendar date format will help you avoid spending extra money on a poorly performing campaign. If you can afford to wait another day, I would advise calculating retention by the 24-hour window.
But generally, you can choose what you prefer. As long as you know exactly what is calculated, you will be able to draw accurate conclusions based on the data.

Oleg Yakubenkov
CEO, GoPractice.io
Oleg Yakubenkov is the CEO of GoPractice. Oleg is a seasoned product manager and data analyst with experience in building and growing things at scale. Oleg worked on MSQRD (over 80 million downloads, acquired by Facebook), Dialogflow (acquired by Google), Workplace by Facebook (reached 2 million paid users in less than 2.5 years), King of Thieves (mobile game with over 60 million players, Apple Editor’s Choice), and CATS (best game of 2017 by Google Play, over 100 million players). He is the creator of Simulator, a unique interactive course that teaches how to use data to build and grow products.
More from Oleg


