New Campaign Reporting, Metrics, and Tables Deliver Deeper Insight into Outcomes
A new unified vision for product and marketing teams with visibility into the entire customer journey
Product-led companies want to collaborate around a shared understanding of the digital customer journey—from a customer’s first touchpoint to a user’s recurring interactions with your digital products. This is what drives outcomes for your business. Today product, marketing, engineering, design and analytics teams are coming together to use data to prove impact and tailor experiences. That’s why we’re announcing several new features to Amplitude Analytics— Campaign Reporting, Metrics and Data Tables. These new tools help you quickly turn data into insights and deliver faster outcomes for your business, and with visibility into the full customer journey.
Traditionally, teams may have relied on a marketing analytics solution to surface acquisition insights and top-level conversion metrics, while using a separate product analytics solution to understand product metrics such as retention or churn. However, product and marketing teams need a shared understanding of how every decision and action across the customer journey impacts their most important metrics. And now they can with Campaign Reporting.
Optimize marketing investments with Campaign Reporting
We’re introducing new campaign reporting tools that provide marketers with self-service insights into their digital marketing investments. For the first time, marketing and product teams can work together using Amplitude to understand how their investments drive growth. Marketing and growth teams can now tie campaigns to outcomes driven by the product experiences—like retaining a subscriber base and increasing customer lifetime value. And product teams can understand which channels and campaigns bring in their highest value users.
Unify campaign data with behavioral data
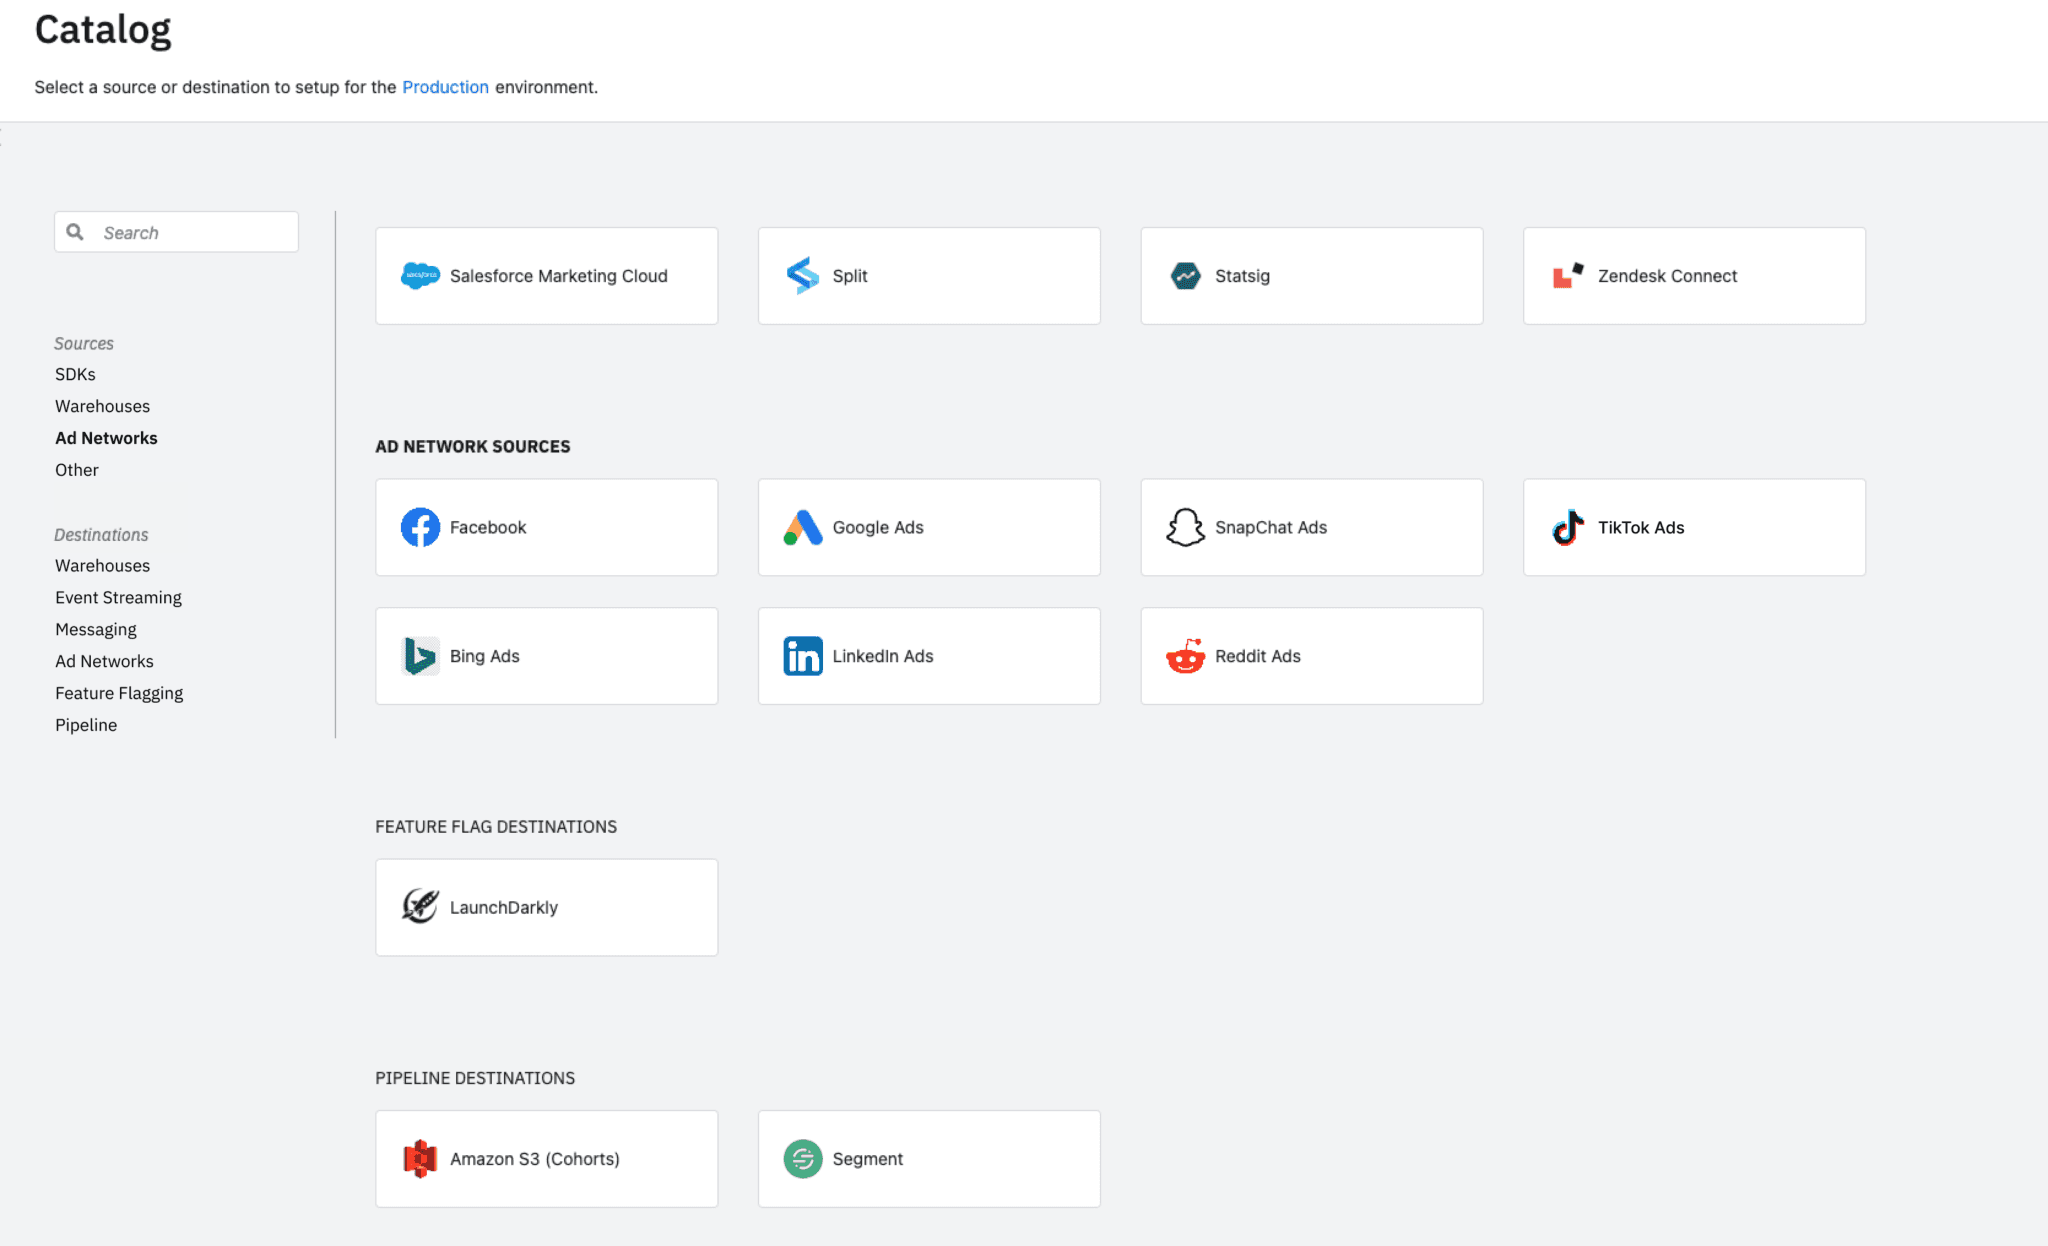
To unlock more insights into your campaigns, we’re bringing campaign data into Amplitude with brand new integrations into your advertising platforms such as Google, Facebook, and LinkedIn. These new data sources deliver an aggregated view of your campaign investments such as ad-spend, impressions and clicks. By combining campaign data along with revenue, we’re making it easy to gauge performance, understand cross-channel return on ad investments, and make investment decisions about marketing programs.

Make channel tracking a breeze
Every marketing team must be able to tie investments back to the right channel. Before, channel-based analysis in Amplitude required hacking together properties. But now, new Acquisition Channels make it easy to group acquisition traffic across organic and paid channels.
With our new channel classifier, you can identify which marketing channels users are coming from, alongside your other performance measurements. You can also create rules that use existing properties and property values to automatically classify the channel used to source respective events in your product.
Attribute performance across the full customer journey
Reporting on channels is a great start. But measuring performance using channel-based conversion or engagement in isolation simply is not enough to understand what moves the needle. That’s the job of attribution reporting. And now Amplitude offers out-of-the-box Attribution Reporting. You can use Amplitude to easily distribute credit for your marketing programs using several attribution models.
Unlike other solutions, the power of the Amplitude Behavioral Graph enables unlimited lookback windows on attribution. This holistic history of every customer interaction is essential for accurate attribution reporting. The Behavioral Graph’s built-in machine learning also applies different attribution models to events using popular algorithms, including first touch, last touch, all touch, and several other models. You can even create your own attribution model on the fly.
Using Amplitude, customers can now see which acquisition channels users are coming from across organic and paid sources, understand how marketing programs impact product KPIs using built-in attribution modeling, and understand cross-channel return on ad investments with brand new integrations into your advertising data platforms.
Standardize KPI reporting with Metrics
Have you ever been part of a team with seven different definitions of KPI? No more! Metrics are foundational building blocks that can help accelerate and align your team’s reporting to your most important outcomes.
Now in Amplitude, you can define and save metrics so they can be standardized and reused across charts, cohorts and tables. Metrics serve as a trusted measure of success for KPIs in your products, campaigns and experiments. There are several standard Metrics available as templates, like Total Revenue, Average Order Value, and Revenue Per User. But customers can also create custom Metrics by creating a formula from any combination of events.
Here are a few examples of what teams can do with Metrics:
- A media company that cares about subscribers can now easily define a metric to track how landing pages lead to subscription outcomes
- An ecommerce business that needs to understand the impact of product behaviors on checkout completion now has a single source of truth
- A mobile gaming company can define key revenue metrics, such as average subscription value or revenue per user, that product, growth, and marketing can use to grow their subscription business
It’s a seemingly small addition, but an impactful change to how teams can build analyses in Amplitude. Before you always started by defining the events you wanted to measure, now you can go right to Metrics.
Unlock insights faster with Data Tables
At the end of the day, so many decisions are made using data created in a table format. Customers have shared the need to compare multiple metrics into a single view with flexibility to customize their analysis. These types of workflows are at the core of how many analysts do their jobs today.
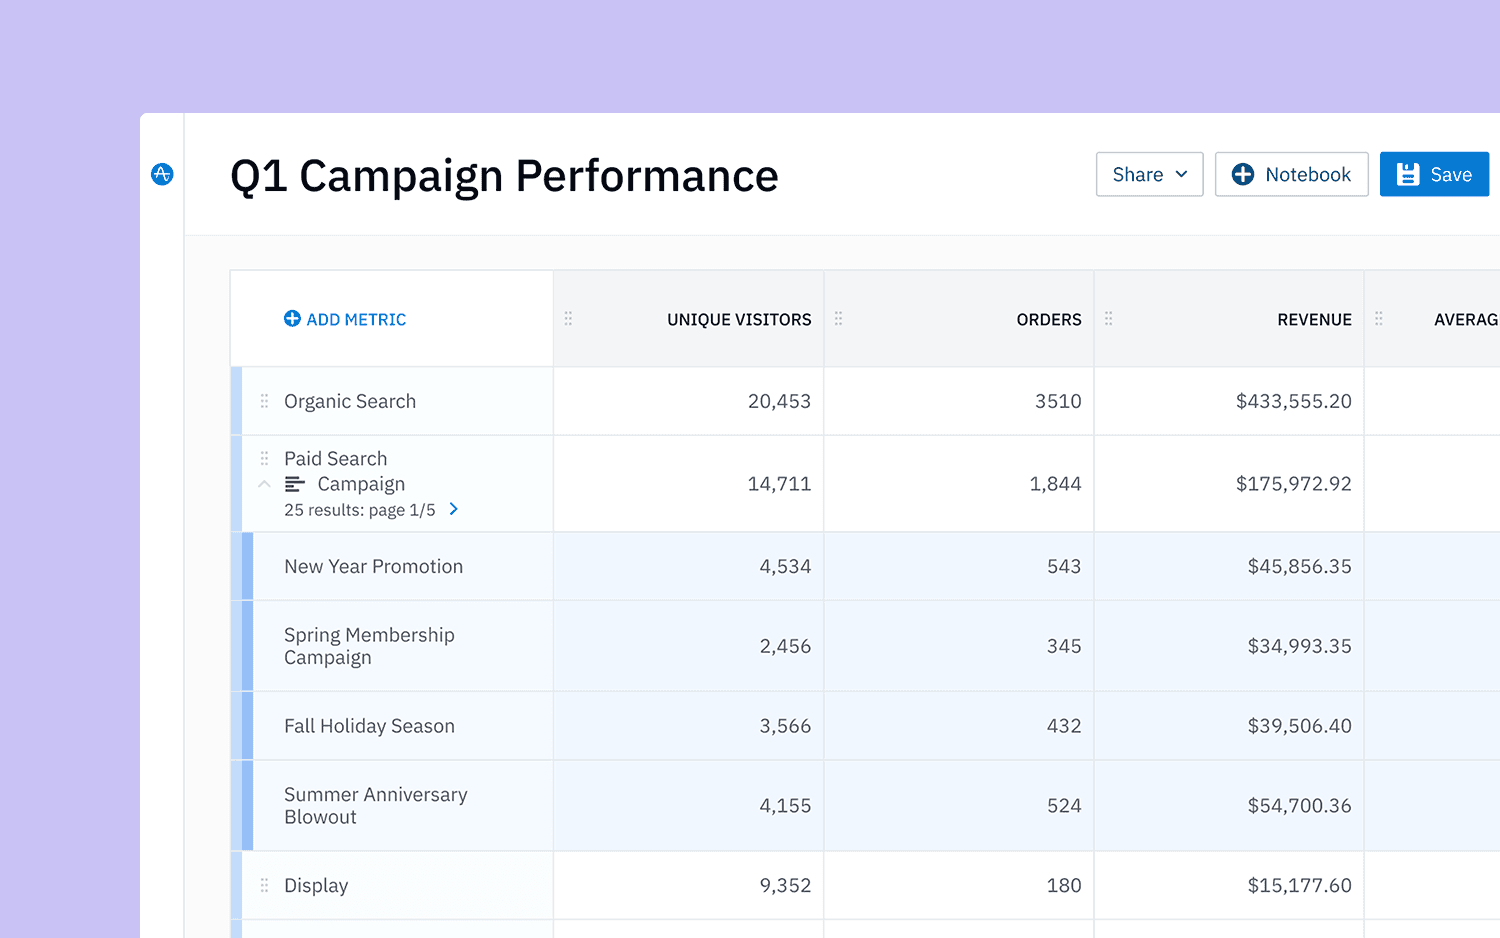
So, we’re introducing new Data Tables that enable multi-dimensional analyses right inside Amplitude. Data Tables are an extremely flexible chart type, allowing our users to quickly analyze any combination of user behavior, user attribute, or Metric. Want to compareTrial Signup Pageview with Revenue from Trial Users? Done. Want to break down those pageviews by device type and location? Easy. How about looking at users that engage with a bug next to users that later deactivate? No problem. Now customers have a new, first-class tool at their disposal to discover insights.
Customers like Mint Mobile are already using these new capabilities to discover how their investments meaningfully affect outcomes and accelerate the insights to action loop with a single source of truth. “Using Amplitude, we’re able to reduce the time needed to answer the most important metrics about our business including how our e-commerce channel drives new customer activations,” said Sheena Green, Director of Digital Insights and Analytics at Mint Mobile. “With new campaign reporting and attribution built into Amplitude, we can now understand the entire customer journey from acquisition to retention to monetization, and gain full visibility into our product growth metrics, including what channels and campaigns are driving important revenue metrics.”
Be part of the digital analytics convergence
The introduction of Campaign Reporting, Metrics, and Data Tables, in addition to Amplitude’s new customer data platform capabilities, make it easier for teams to consolidate their analytics solutions while modernizing the metrics they can track across the end-to-end customer journey. Adding marketing performance measurement capabilities to Amplitude’s #1-rated product analytics solution is indicative of a major movement in the market—the digital analytics convergence.
According to a Gartner® report: “Digital analytics markets are colliding and converging as vendors blur the lines between categories such as product analytics and digital experience analytics (DXA) and branch into adjacent markets such as customer journey analytics.”[1]
Amplitude’s vision for a unified digital analytics suite can help customers like Adidas, Atlassian, and NBC Universal and others gain the holistic visibility they need to be successful. We’re excited to see this movement take shape.
Our new digital analytics features will be available in beta to Amplitude Analytics customers in the coming months. If you’re interested in learning more, contact our sales team to schedule a demo. These are just some of the exciting product announcements we’re making on stage at Amplify 2022. Register to watch the Amplify keynote live or on demand, or catch a round-up of all our product announcements.
Thank you to the team
Lastly a huge shout out to our insanely talented Product, Design and Engineering teams, without whom none of this would be possible:
Michelle Lee, Kate Adams, Weston Clarke, Patrick Hillery, Abbie Kouzmanoff, Ibrahim Bashir, Jocelyn Ye, Will Newton, Fayyaz Mukarram, Kat Cheng, Cally Dai, Wendy Vang, Sophie Lin, Jenny Chang, Devin Otway, Brian Soe, Yizhu Qin, Sam Puth, Kelvin Lu, Janaki Vivrekar, Kent Hu, Aracely Payan, Ashkan Aghdai, Brian Wei, Chiyoko Wong, Dan Jih, Richard Fang, Cindy Rogers, Scott Brooks, Tongbo Huang, Zemei Zeng, Haiyong Zhang, Jeffrey Wang, Sravya Divakarla, Ryan Fitzpatrick, Karan Johar, and Jin Wan.
[1] Gartner, “Market Guide for Web, Product and Digital Experience Analytics”, Melissa Davis, David Norrie, Aapo Markkanen, Adrian Lee, April 26, 2022.
GARTNER is a registered trademark and service mark of Gartner, Inc. and/or its affiliates in the U.S. and internationally and is used herein with permission. All rights reserved.

Nikhil Gangaraju
Director, Product Marketing, Amplitude
Nikhil is a product marketer at Amplitude focusing on Amplitude Analytics and works with teams to advance our mission to help companies build better products.
More from Nikhil


