Sequential Test vs. Fixed Horizon T-Test: When to Use Each?
Learn whether a fixed horizon T-test or sequential testing is right for your next experiment.

Experimentation helps product teams make better decisions based on causality instead of correlations. You are able to make statements like “changing <this part of the product> caused conversion to increase by 5%.” Without experimentation, a more common approach is to make changes based on domain knowledge or select customer requests. Now, data-driven companies use experimentation to make decision-making more objective. A big component of causality is a statistical analysis of experimentation data.
At Amplitude, we have recently released a fixed horizon T-test in addition to sequential testing, which we have had since the beginning of Experiment. We envision several customers asking “How do I know what test to pick?”
In this technical post, we will explain the pros and cons of the sequential test and fixed horizon T-test.
Note: Throughout this post, when we say T-test, we are referring to the fixed horizon T-test.
There are pros and cons for each approach, and it is not a case where one method is always better than the other.
Sequential testing advantages
First, we will explore the advantages of sequential testing.
Peeking several times → end experiment earlier
The advantage of sequential testing is that you can peek several times. The specific version of sequential testing that we use at Amplitude, called mixture Sequential Probability Ratio Test (mSPRT), allows you to peek as many times as you want. Also, you do not have to decide before the test starts how many times you are going to peek like you have to do with a grouped sequential test. The consequence of this is that we can do what all product managers (PM) want to do, which is “run a test until it is statistically significant and then stop.” It is similar to the “set it and forget it” approach with target-date funds. In the fixed horizon framework, this should not be done as you will increase the false positive rate. By peeking often, we can decrease the experiment duration if the effect size is much bigger than the minimum detectable effect (MDE).
Naturally, as humans, we want to keep peeking at the data and roll out features that help our customer base as quickly as possible. Often, a PM will ask a data scientist how an experiment is doing a couple of days after the experiment has started. With fixed horizon testing, the data scientist cannot say anything statistically (confidence intervals or p values) about the experiment and can only say this is the number of exposed users and this is the treatment mean and control mean. With sequential testing, the data scientist can always give valid confidence intervals and p-values to the PM at any time during the experiment.
In some experimentation dashboards, the statistical quantities (confidence intervals and p values) are not hidden from users even for fixed horizon testing. Often, data scientists get asked why we cannot roll out the winning variant since the dashboard is “all green.” Then, the data scientist has to explain that the experiment has not reached the required sample size and that if the experiment is rolled out, it could actually have a negative effect on users. Then, the PM questions why their colleague rolled out an experiment before it reached the required sample size. This creates a lot of inconsistency and people being confused about their experiments not being rolled out. With sequential testing, this is no longer a question the data scientist has to answer. In the fixed horizon case, Amplitude only shows the cumulative exposures, treatment mean, and control mean to help solve this problem. Once the desired sample size is reached, Amplitude will show the statistical results. This helps control the false positive rate by preventing peeking.
Do not need to use a sample size calculator
Another advantage of sequential testing is that you do not have to use a sample size calculator, which you should use for fixed horizon tests. Often, non-technical people have difficulty using a sample size calculator and do not know what all the inputs mean or how to calculate the numbers they need to put in. For example, knowing the standard deviation of a metric is not something most people know off the top of their heads. In addition, you run into issues if you did not enter the correct numbers in the sample size calculator. For example, you entered a baseline conversion rate of 5%, but the true baseline conversion rate was 10%. Are you allowed to recalculate the sample size you need in the middle of the test? Do you need to restart your experiment? One way Amplitude mitigates this problem is by pre-populating the sample size calculator with standard industry defaults (95% confidence level and 80% power) and computes the control mean and standard deviation (if necessary) over the last 7 days. In sample size calculators, there is a field called “power” (1- false negative rate). With sequential testing, this field is essentially replaced with “how many days you are willing to run the test for.” This is a much more interpretable number and an easy number for people to come up with.
Power 1 Test
Another advantage is that sequential testing is a test that has power 1. In non-technical terms, this means that if there is a true difference not created by chance between the treatment mean and control mean, then the test will eventually find it (i.e., become statistically significant). Instead of telling your boss that the test was inconclusive, you can say we can wait longer to see if we get a statistically significant result.
Looking at the first advantage, we break out what can happen in an experiment with the relationship between the true effect size and the Minimum Detectable Effect (MDE). The three cases are when you underestimate the MDE, estimate the MDE exactly, or overestimate the MDE.
| Fixed Horizon Testing | Sequential Testing | Which is better? | |
| Underestimate MDE (e.g., pick 1 as the MDE but 2 is the effect size) | Run the test for longer than necessary. Have larger power than you wanted. | Stop the test early. | Sequential Testing. |
| Estimate MDE exactly (e.g., pick 1 as the MDE before the experiment and 1 is the effect size) | Get a smaller confidence interval. Get the exact power that you wanted pre-experiment. | Larger confidence interval. Have to wait longer to get statistical significance (i.e., run the test longer). | Fixed, but remember that there is still a chance you get a false negative with a fixed horizon test. |
| Overestimate MDE (e.g., pick 1 as MDE but .5 is the effect size) | Underpowered test. Likely will get an inconclusive test and have to stop the test. | Likely will get an inconclusive test. But you can keep the test running longer to get a statistically significant result. The question then is do you care if you get a statistically significant result because the lift is so small? Is it worth the engineering effort to roll it out? | Sequential Testing, but only slightly. |
Generally, you do not know the effect size (if you did, there would be no point in experimenting). Thus, you do not know which of the 3 cases you will be in. You want to try to estimate what is the chance you will be in each of the 3 cases.
Basic Rule: Here we will look into a rule to summarize the above table. If you have experience with fixed horizon testing, then you are comfortable with the concept of a minimum detectable effect. We extend this concept to define a maximum detectable effect, which is the maximum effect size you theoretically think could happen from the experiment. To pick the maximum detectable effect, you could use the maximum of previous experiments’ effect sizes, or if you have domain knowledge, you can use that to pick a reasonable value. For example, if you are changing a button color, you know the click-through rate is not going to increase by more than 20%. Essentially, the minimum detectable effect gives you the worst-case scenario, and the maximum detectable effect gives you the best-case scenario. Then, use the fixed horizon sample size calculator and plug in both the minimum detectable effect and the maximum detectable effect. Take the difference in the number of samples needed between both of the situations. Are you okay with waiting the extra time between those two values? Maybe you only need to wait 3 more days—then it is probably better to use a fixed horizon test because with sequential testing you can only at most save 3 days. Maybe you have the chance of saving 10 days, then you might want to use sequential testing.
To summarize, the advantages of sequential testing are:
- There is a lower barrier to entry from not having to use a sample size calculator and not having to know about peeking.
- Peeking is allowed.
- Experiments finish faster in some cases.
Fixed horizon T-test advantages
Now, we will switch gears and look into some cases where the T-test is advantageous. With t-test you need to ask the question: If sequential testing told me to stop early, would I actually stop early?
Big company
Generally, if you are a big company, you have done lots of experiments and probably know what a good or reasonable minimum detectable effect is. Also, you are probably making 1% or 2% improvements, so it is unlikely that the true effect size is very far from the minimum detectable effect. In other words, the difference between the maximum detectable effect and the minimum detectable effect is small. Thus, you would prefer to use a fixed horizon test.
Already have a data science organization
Fixed horizon T-test is the standard textbook Stats 101 methodology. Most data scientists should be familiar with this methodology, so there would be less friction to use this method.
Small sample sizes
If you have really small sample sizes, then it is not always clear which methodology is better. If you are testing major changes (which you should be doing if your company/customer base is small), then sequential would be advantageous because the difference between maximum detectable effect and minimum detectable effect is large. On the other hand, you want to be very precise and want smaller confidence intervals because of the small sample size, so a fixed horizon test would be good in this case. If you have really small data, then you want to question if you will even reach statistical significance in a reasonable amount of time. If the answer is no, then A/B testing may not be the right methodology in this case. It might be a better use of your time to do a user study or make changes that customers are requesting and assume they will have a positive lift.
Seasonality
By seasonality, we mean variations at regular intervals. Seasonality does not have to be over a very long interval like a month. It could be even at the day of the week level. Depending on the product, the users who use the product on the weekend may be different from the people who use the product on weekdays. An example is for a maps engine, where on the weekdays, people may be searching more for addresses versus on the weekend, people may be searching more for restaurants. It is possible that the users that get treated on the weekday have a positive lift and users that get treated on a weekend have a negative lift or vice versa.
The question you need to ask here is if the T-test says to run for 1 week and the sequential test reaches statistical significance after 4 days, would you really stop at 4 days? Here it would be better to run a T-test if you believe there is a day of week effect. If you stopped after 4 days, you are making the assumption that the date you got in those 4 days is representative of the data you would have seen if you ran the experiment for a week or two weeks.
Generally, you want to run experiments for an integer number of business cycles. If you do not, then you may be overweighting on certain days. For example, if you start an experiment on Monday and run it for 10 days, then you are giving data on a Monday a weight of 2/10, but a weight of 1/10 for data on Sunday. As you run the experiment for longer, the day of the week effect decreases. This is one of the reasons you may see the general rule of thumb at your company of running an experiment for 2 weeks.
Here is an example of a chart with seasonality.
Studying a long-term metric
Sometimes you may be interested in a long-term metric like 30-day retention or 60-day revenue. These metrics sometimes arise when you are studying monthly subscriptions and giving out free trials or discounts. One thing to think about is how much gain are you getting by stopping early? For example, if you are studying 30-day retention, then you need to wait 30 days to get 1 day of data. Because of this, these kinds of experiments generally run for a couple of months. If you can end an experiment a couple of days early, that is not a big win. Also, when you are picking a long-term metric, you may be interested in both 30-day retention and 60-day retention because if you increase 30-day retention but decrease 60-day retention, then maybe that is not a success. You may pick 30-day retention instead of 60-day so that you can iterate faster on your experiments. One method you could use is to test for statistical significance for 30-day retention and then check for directionality for 60-day retention.
With long-term metrics, you cannot stop early because you need to wait to observe the metric. Sequential testing generally works better when you get a response back immediately after treating the user.
There are two ways you can run your experiments with long-term metrics:
- Get to the sample size you need and then turn off the experiment. Wait until all the users have been in the experiment for 30 days.
- Let the experiment run until you get the sample size you need for users who have been in the experiment for 30 days.
Generally, you do not want to do Option #1 if you are running a sequential test because the whole point of sequential testing is that you do not know what sample size you need. You may consider doing option #1 if you want to be conservative and not expose too many users to your experiment if you believe the treatment may not be positive.
Another thing to think about is how many times you are treating the user. If you are only treating a user a couple of times, you need to think about whether you would really see a very big lift from only a couple of differences between treatment and control. This leads to smaller effect sizes.
Novelty effects
A novelty effect is when you give users a new feature and they interact with it a lot but then may stop interacting with it. For example, you have a big button and people click on it a lot the first time they see it, but stop clicking on it later. The metric does not always have to increase and then decrease—it can go the other direction, too. For example, users are change-averse and do not interact with the feature initially, but then after some time will start interacting with it and see its usefulness. The solution to novelty effects is to run experiments for longer and possibly remove data from the first few days users are exposed to the experiment. This is similar to using a long-term metric.
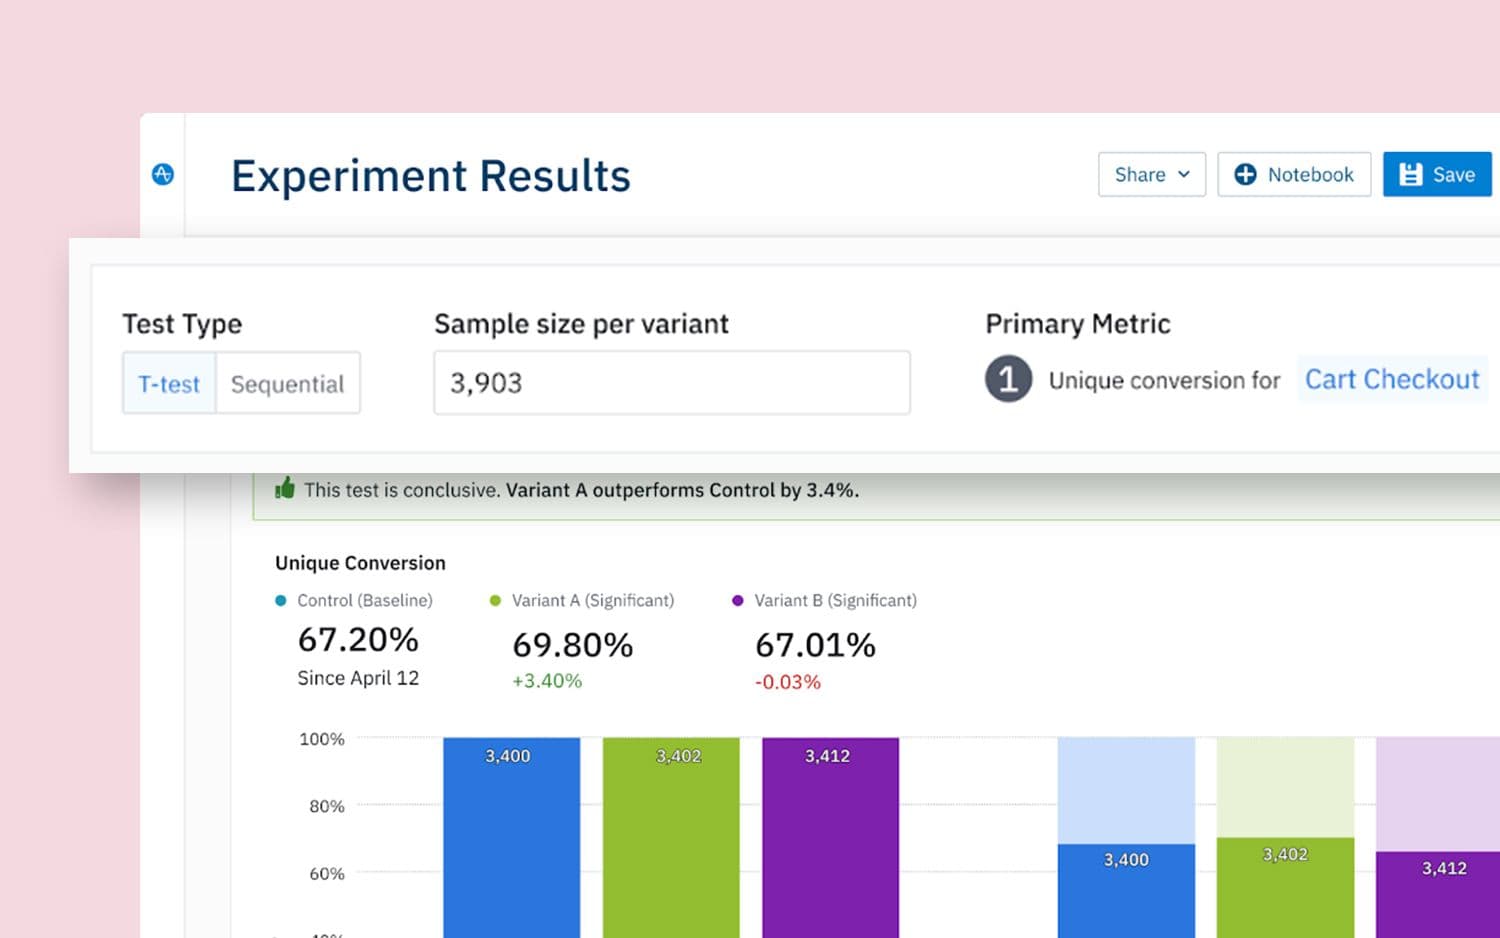
Experiment results
This year we released Experiment Results, a new capability within Experiment that allows you to upload A/B data directly to Amplitude and start analyzing your experiment. You can upload data as your experiment is running and analyze the data with sequential testing. Or another use case is to wait for the experiment to finish, then upload your data to Amplitude to analyze it. If you do this, it does not make sense to use sequential testing since the experiment is already over and there is no early stopping you can do, so you should use a T-test.
Not every experiment will have these non-standard issues. The questions to think about are if you are already committing to a long-running experiment, are you really going to save that much time by ending the experiment early, what kinds of analyses can you not do because you stopped early and if you do stop early, what kinds of assumptions are you making and are you okay with making those assumptions. Not every experiment is the same and business experts within your company can help determine which test would be appropriate and how best to interpret the results.
Not sure where to start? Request a demo and we’ll walk you through the options that work best for your business!

Akhil Prakash
Senior Machine Learning Scientist, Amplitude
Akhil is a senior ML scientist at Amplitude. He focuses on using statistics and machine learning to bring product insights to the Experiment product.
More from Akhil


