Calculate Customer Churn Rate in 6 Clicks
Learn how to calculate customer churn rate—and even drill down across regions and quarters—with just a few clicks in Amplitude. No formula needed.
Browse by category
One of the biggest problems we all face is dealing with a leaky bucket. You know how important it is to understand customer churn, but do you know how to improve it? In this video, I’ll be walking you through how to calculate customer churn using Amplitude and how to further analyze it using your data.
N Day Retention
To start off, we’re going to perform a retention analysis within Amplitude. In the chart below, we see how many new users joined our platform and then returned within 30 days.
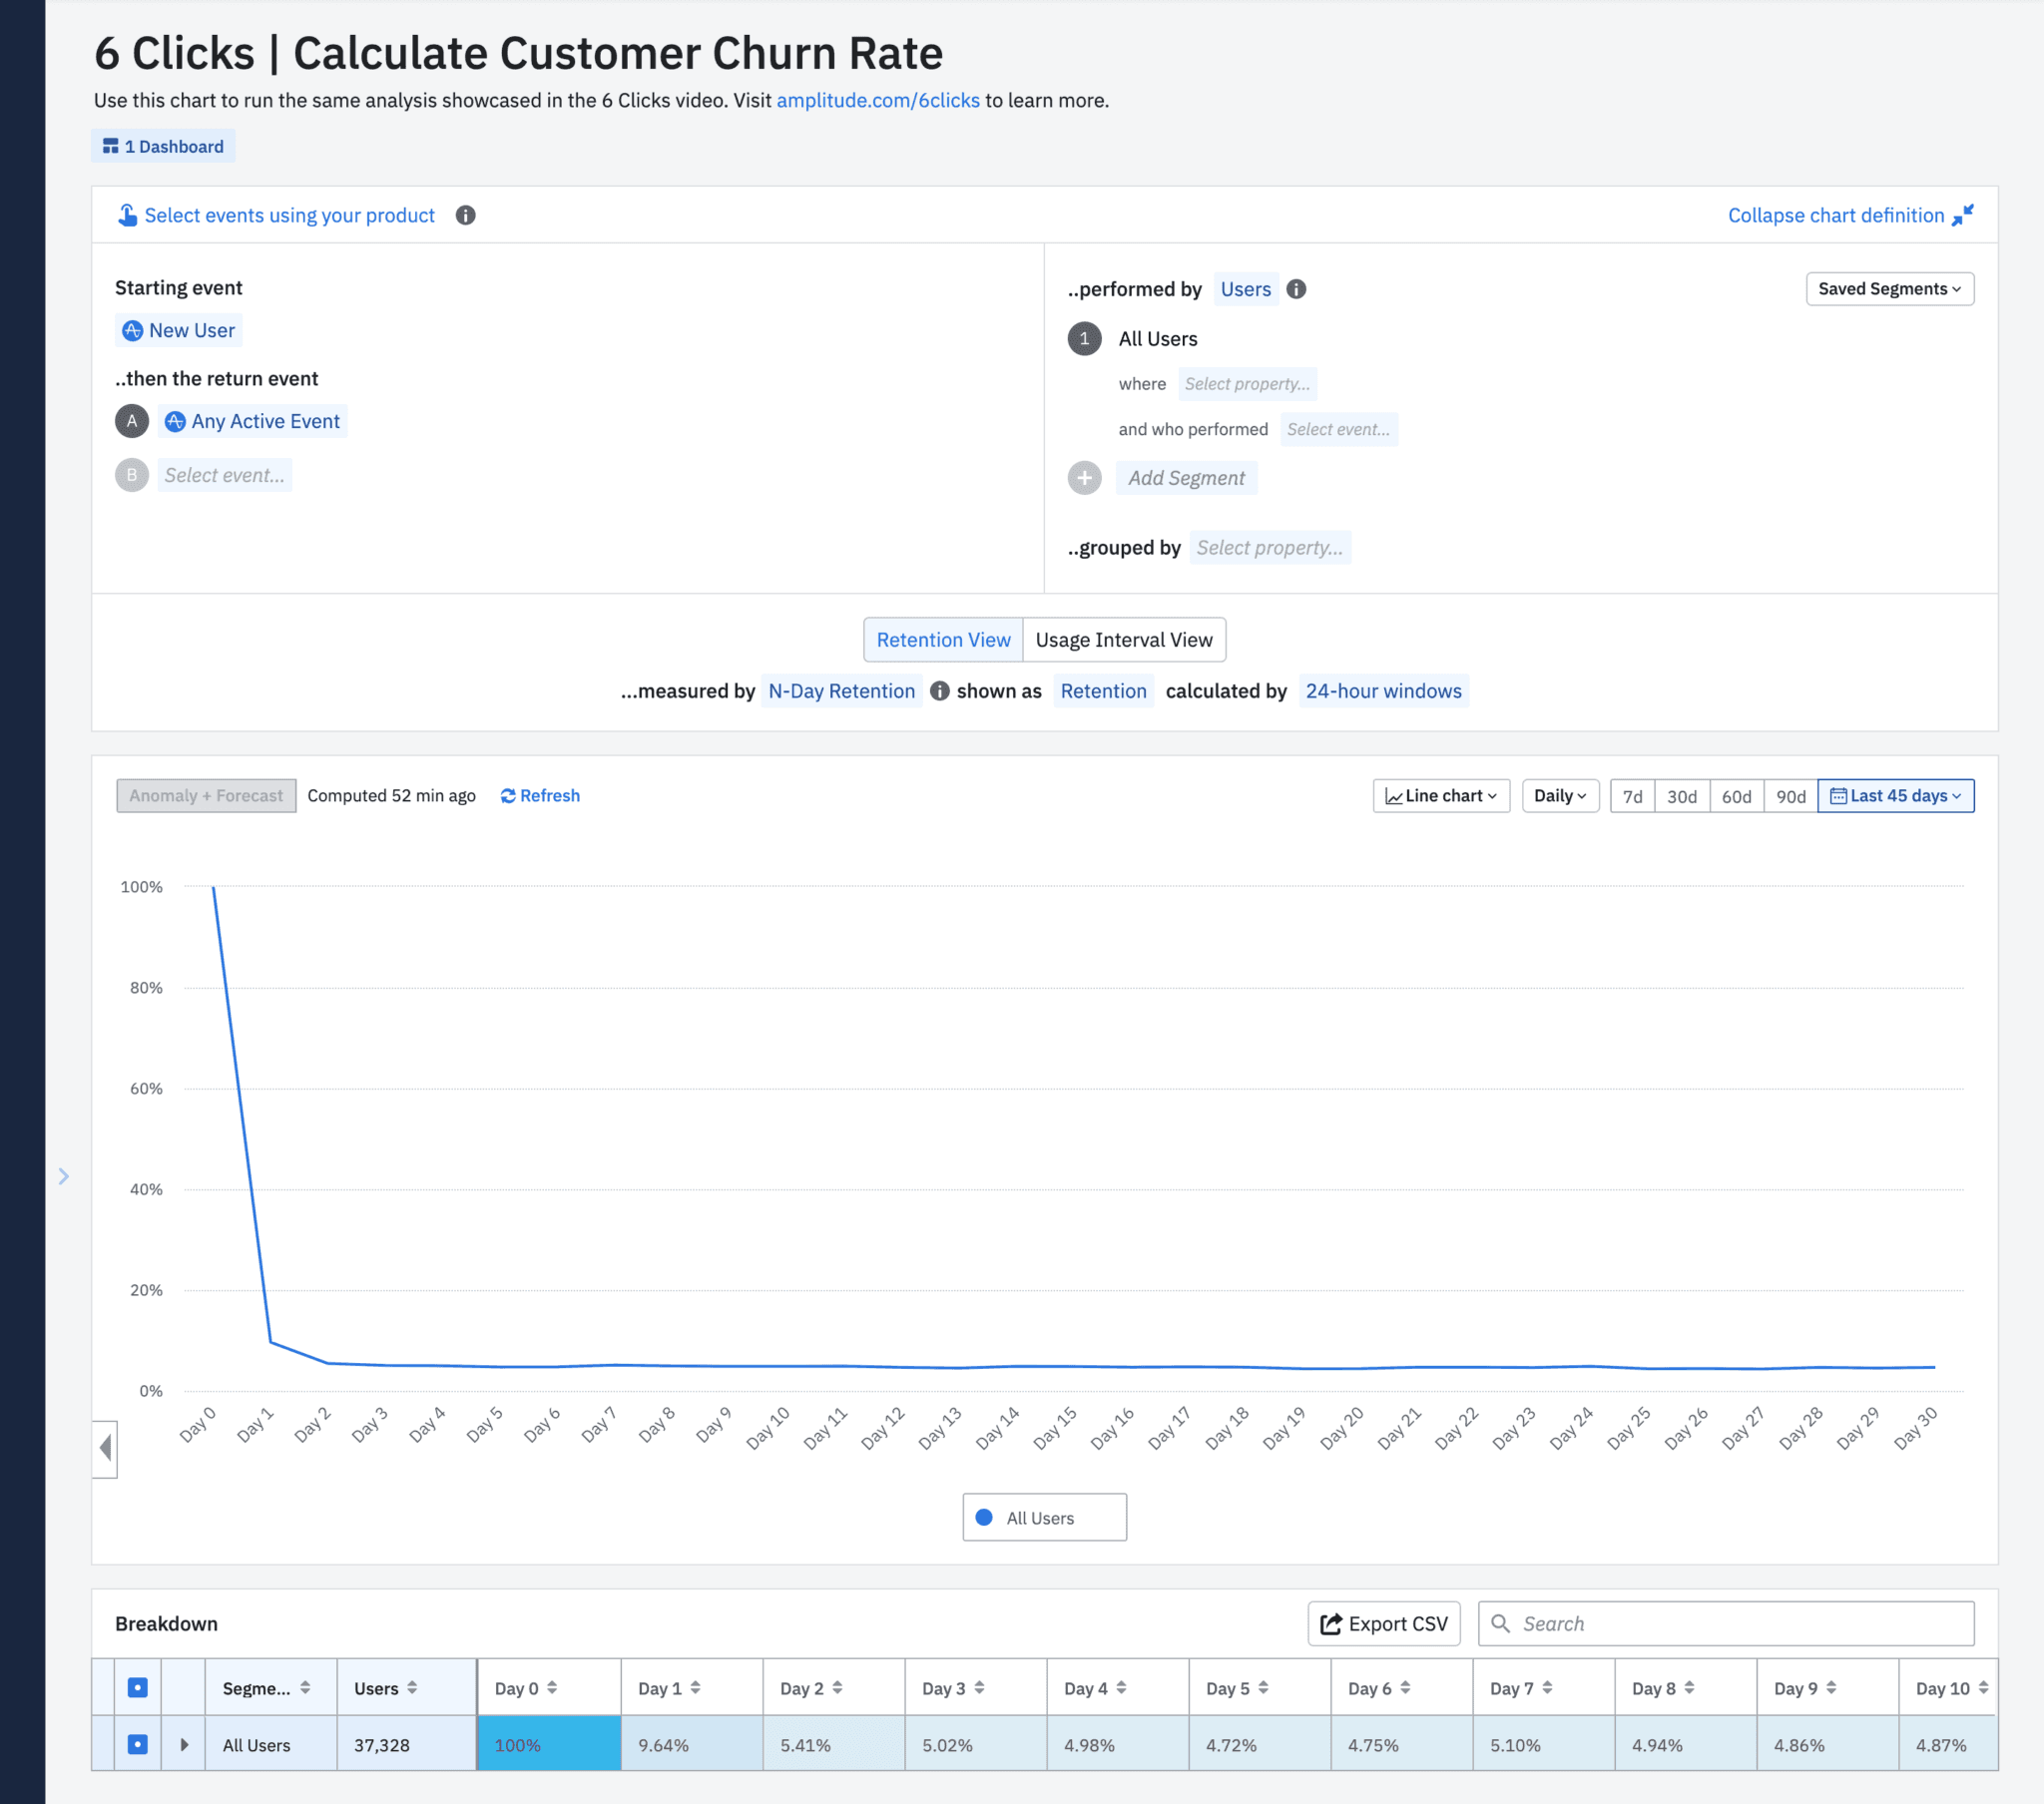
By default, this chart is looking at the N Day retention. N Day retention means that if a user was new on Day 0 and they returned on Day 5, they’re considered Day 5 retained.
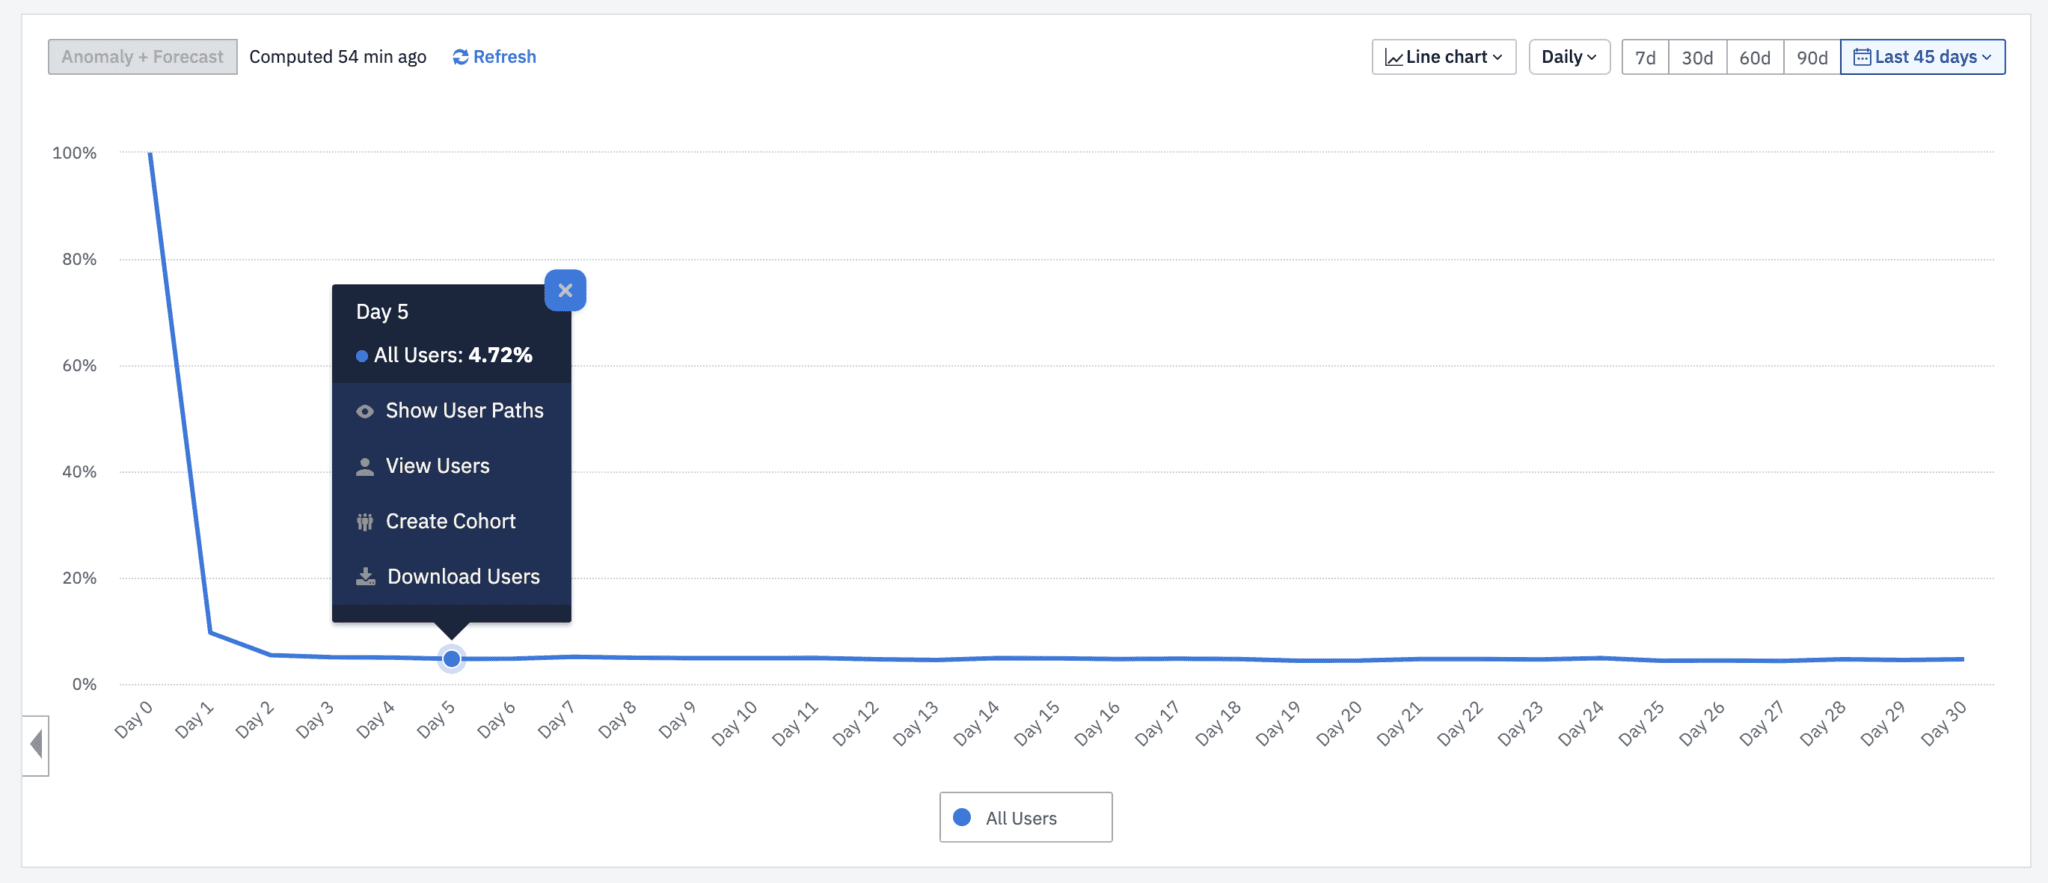
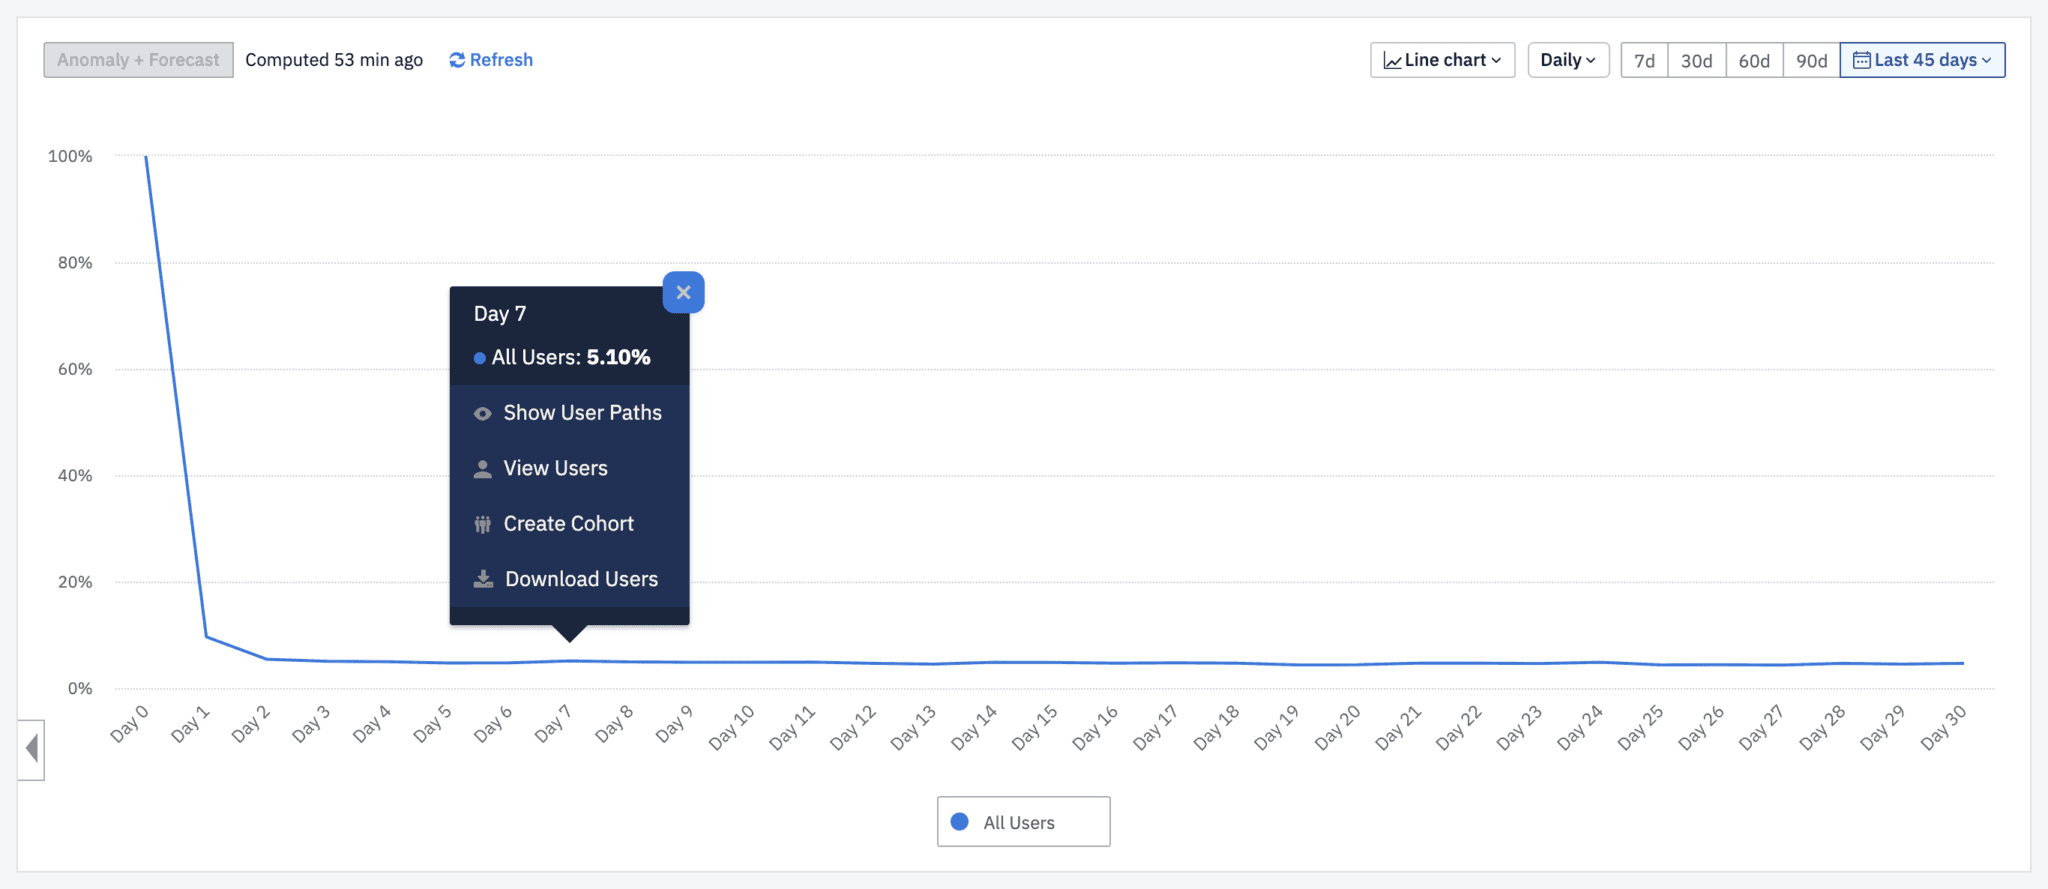
Notice that our Day 7 retention rate is higher though. This means that more users came back on the seventh day after being new, rather than the fifth day. That’s just one way to measure retention.
Unbounded Retention
You can also calculate retention by looking at unbounded retention, shown below. This calculates your customer retention by looking at users who returned on or after a specific date.
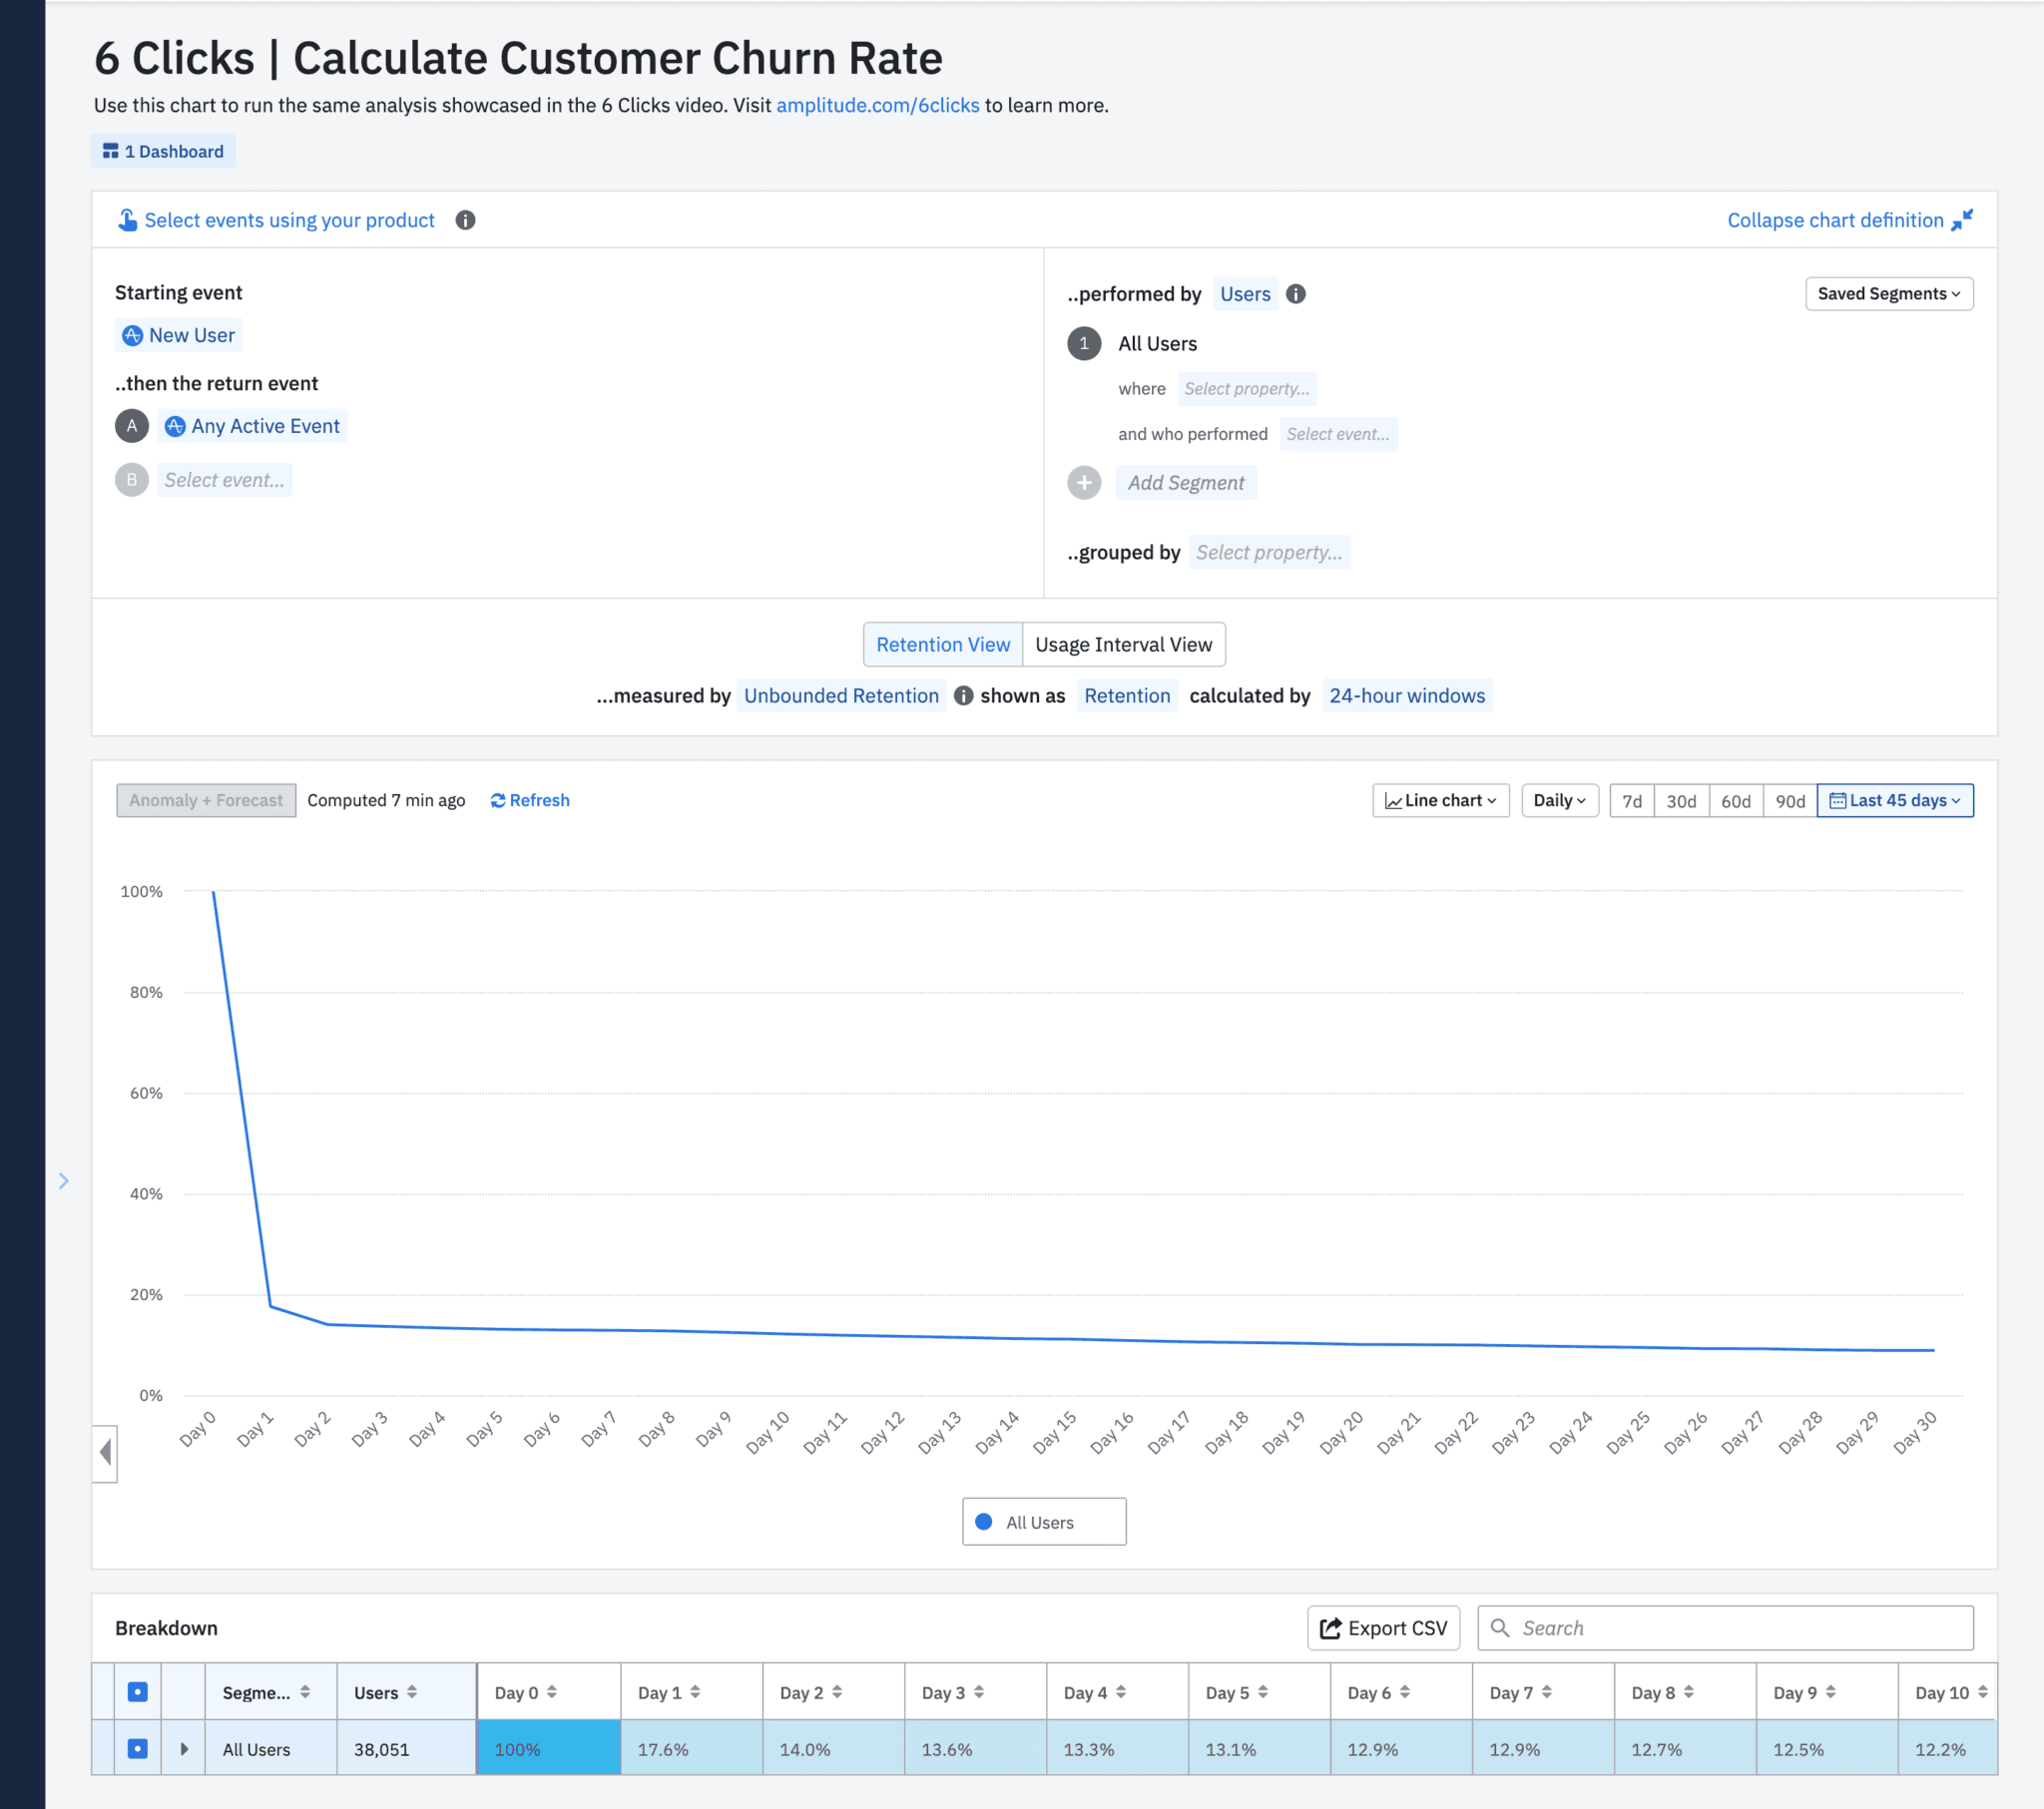
Think about it like this: If someone came back on Day 5, they would also be counted as retained in Day 1 to Day 4.
Customer Churn Across a 30-Day Window
While the unbounded retention chart is a helpful visual, in this example we’re more interested in summary numbers. I’m going to go ahead and change the chart back to N Day retention and use a bar chart view.
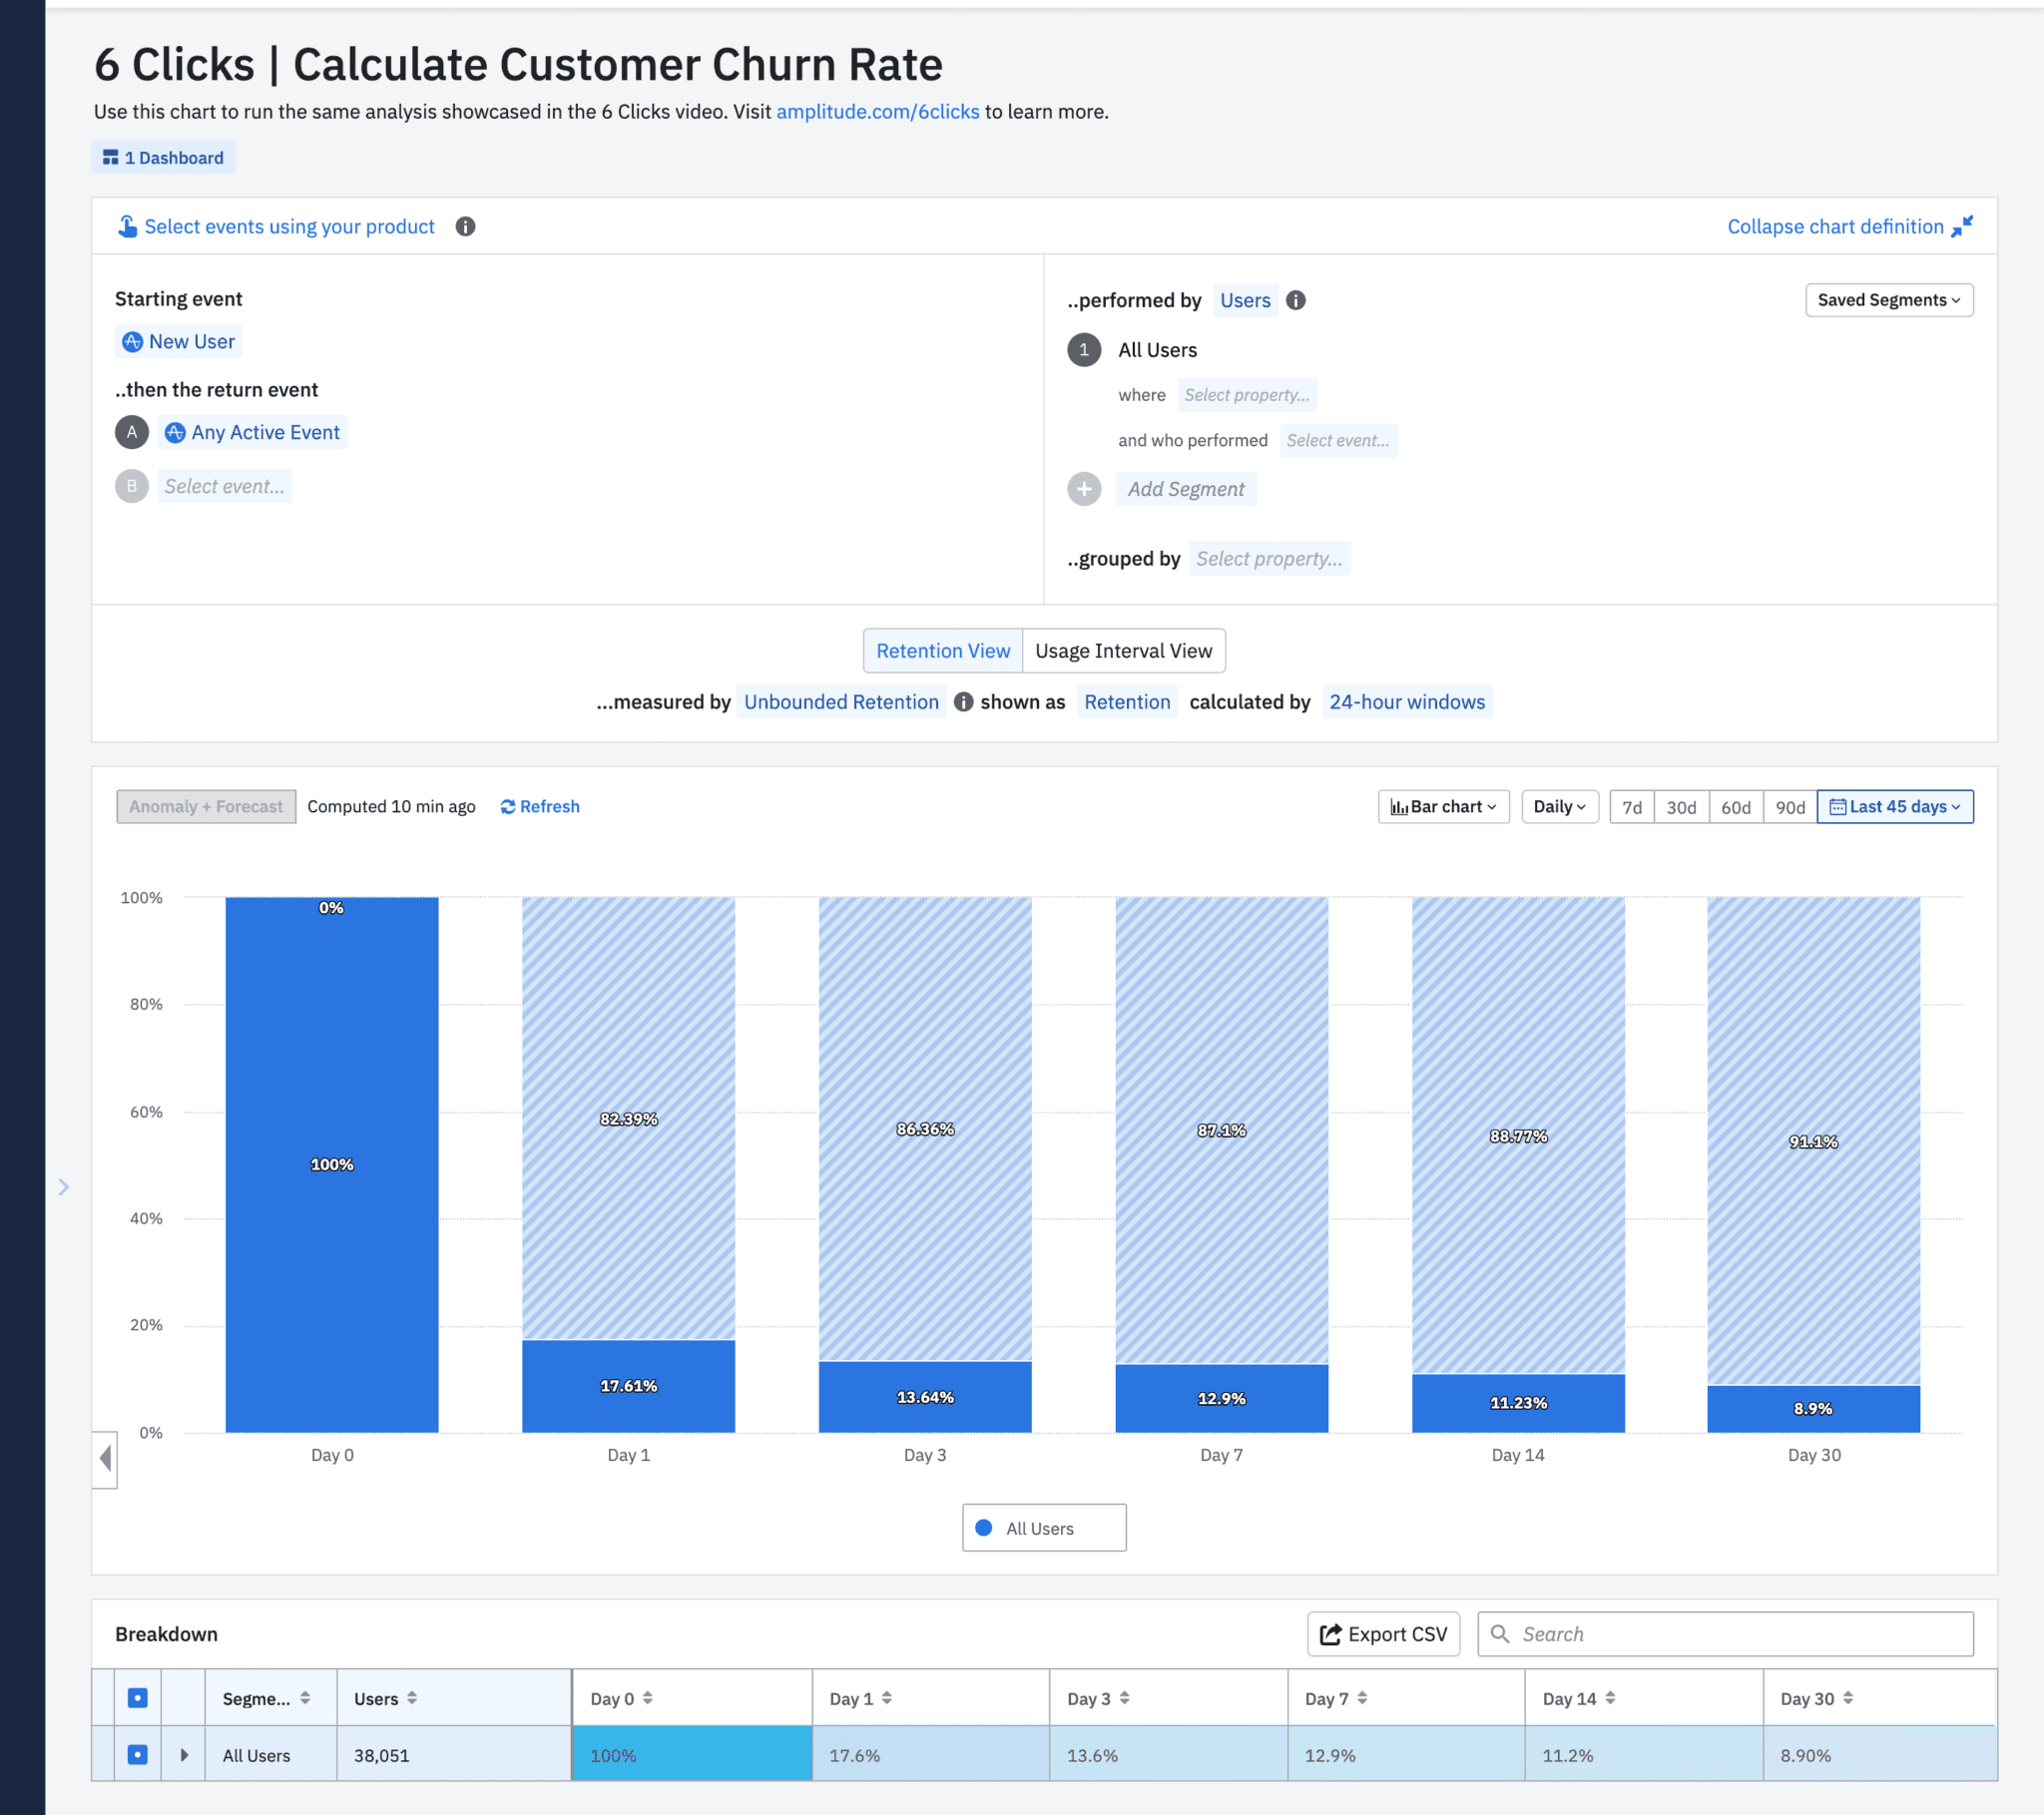
Now, I can easily visualize how customer churn breaks down across the 30-day window. And on day 30, I can see my retention rate is a bit under 10%. The shaded bar represents churn and I can see that about 90% of my new users have churned in 30 days since signing up. This is the calculated customer churn rate.
Customer Churn by Platform
Now that we know what our churn rate is, we can dive deeper and try to find if certain factors are affecting that churn. So I’m going to go up next to “group buy,” and select “platform.”
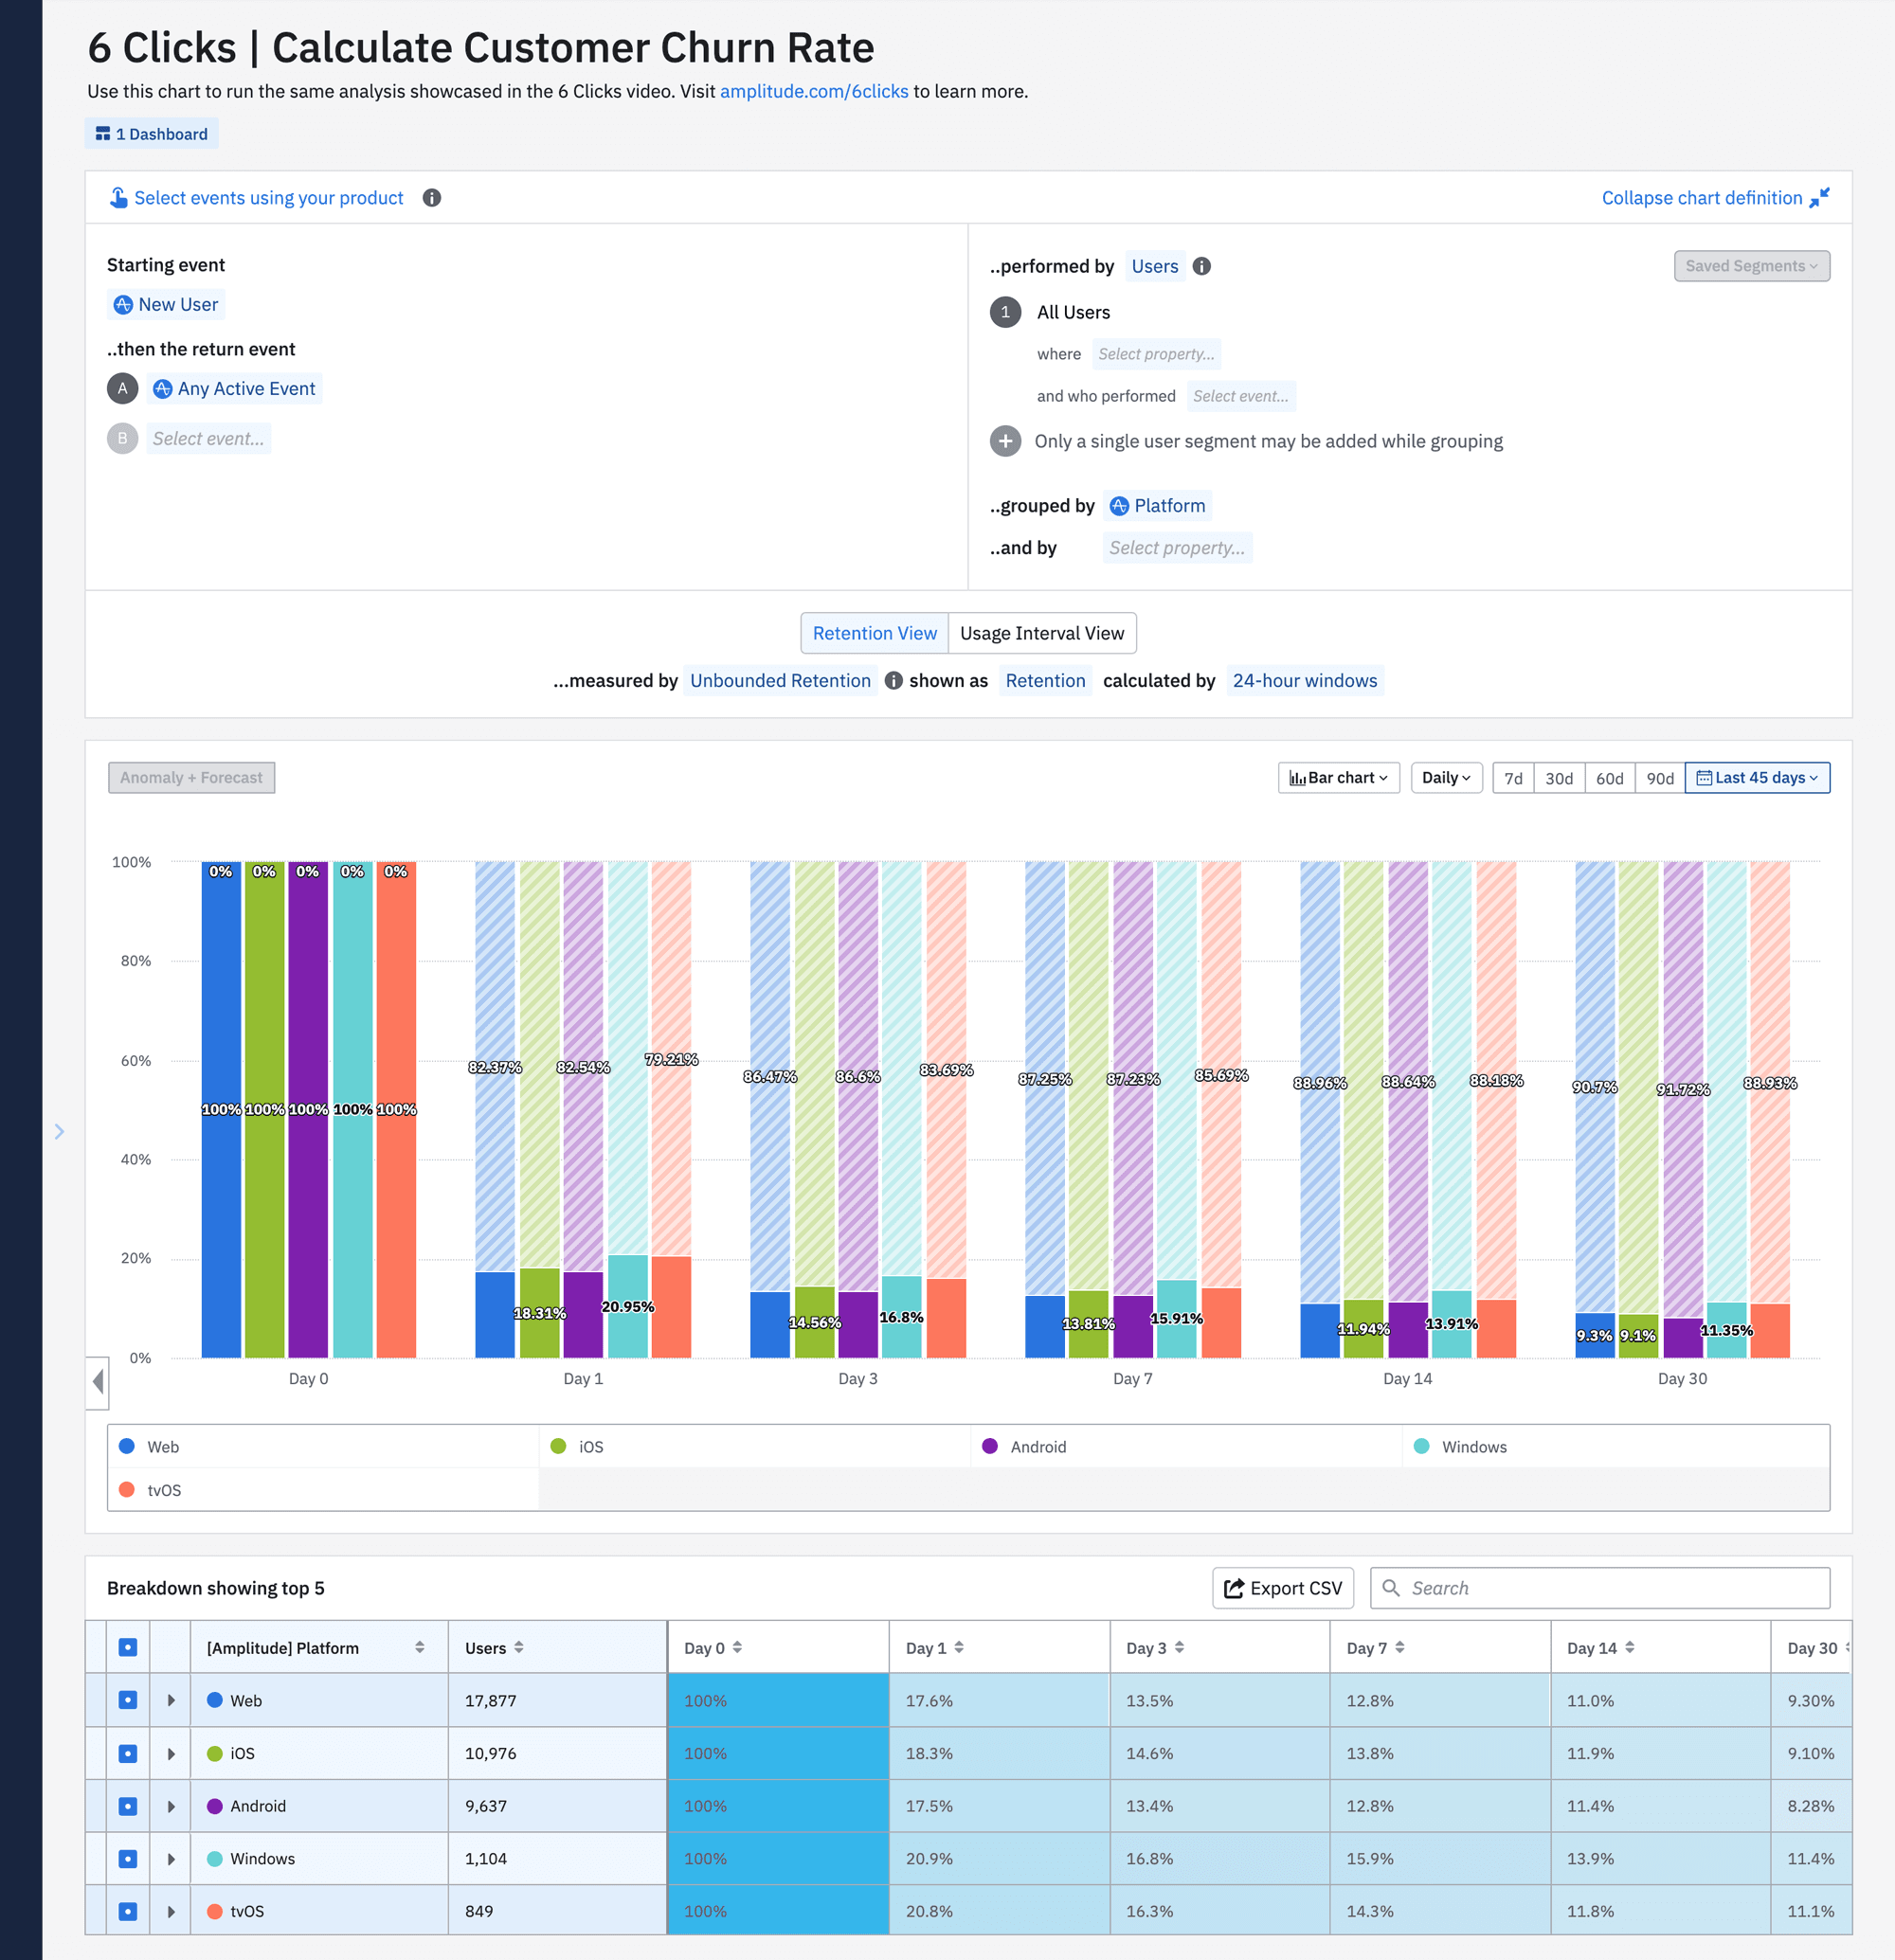
Here, I can see how churn breaks down across the platform my users were on, and therefore which particular platform has the lowest 30-day churn. The different user experiences across platforms might perhaps be contributing to making users more or less likely to churn.
B2B Customer Churn
So we could always expand this out and create cohorts of these users to investigate more. But for the purposes of this video, let’s switch gears and think more about this example from a B2B use case perspective.
So in B2B, we care more about the retention of accounts than individual users at those accounts. So I can go up to the user panel and change the calculation mode from “users” to “accounts.”
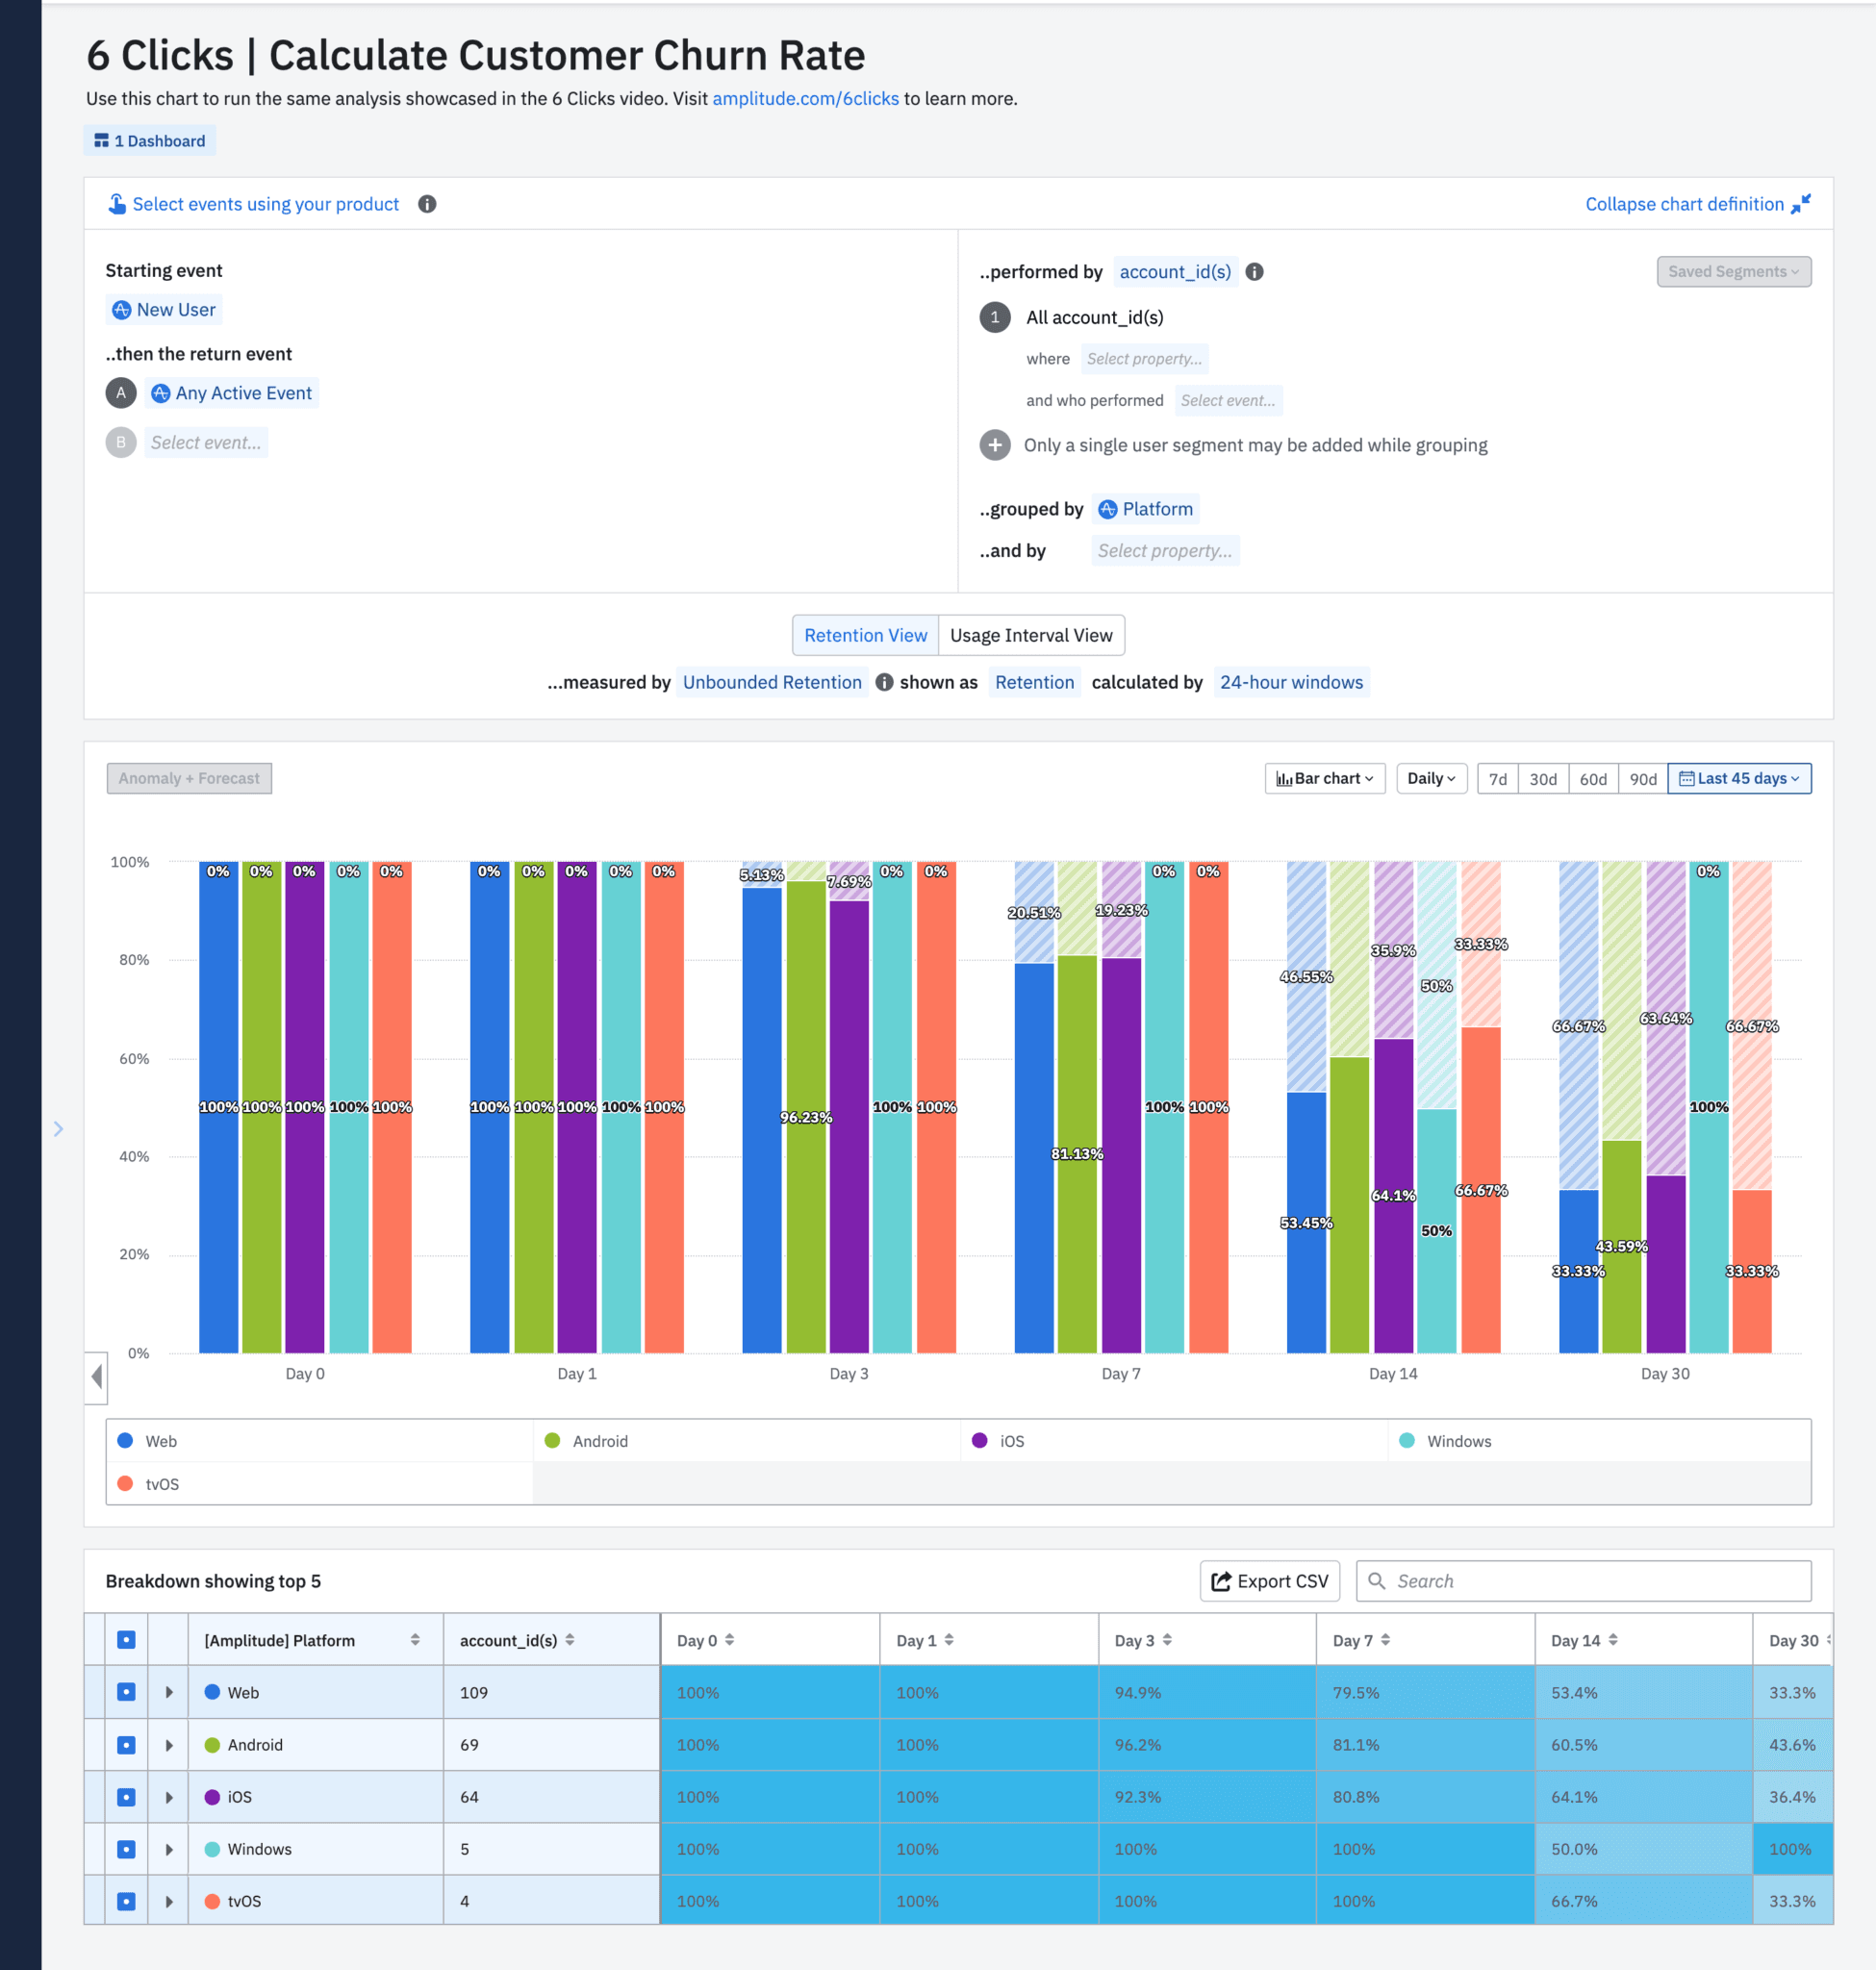
In this B2B chart, the churn rate for customer accounts is much healthier. It’s still not as low as we’d like it to be, but a 58% churn is always better than a 90% churn.
B2B Churn by Sales Region
All right, next, let’s break this down by account-specific metrics. I can group this by the sales region these accounts were in to get a sense of which regions are performing well and which ones are in need of help.
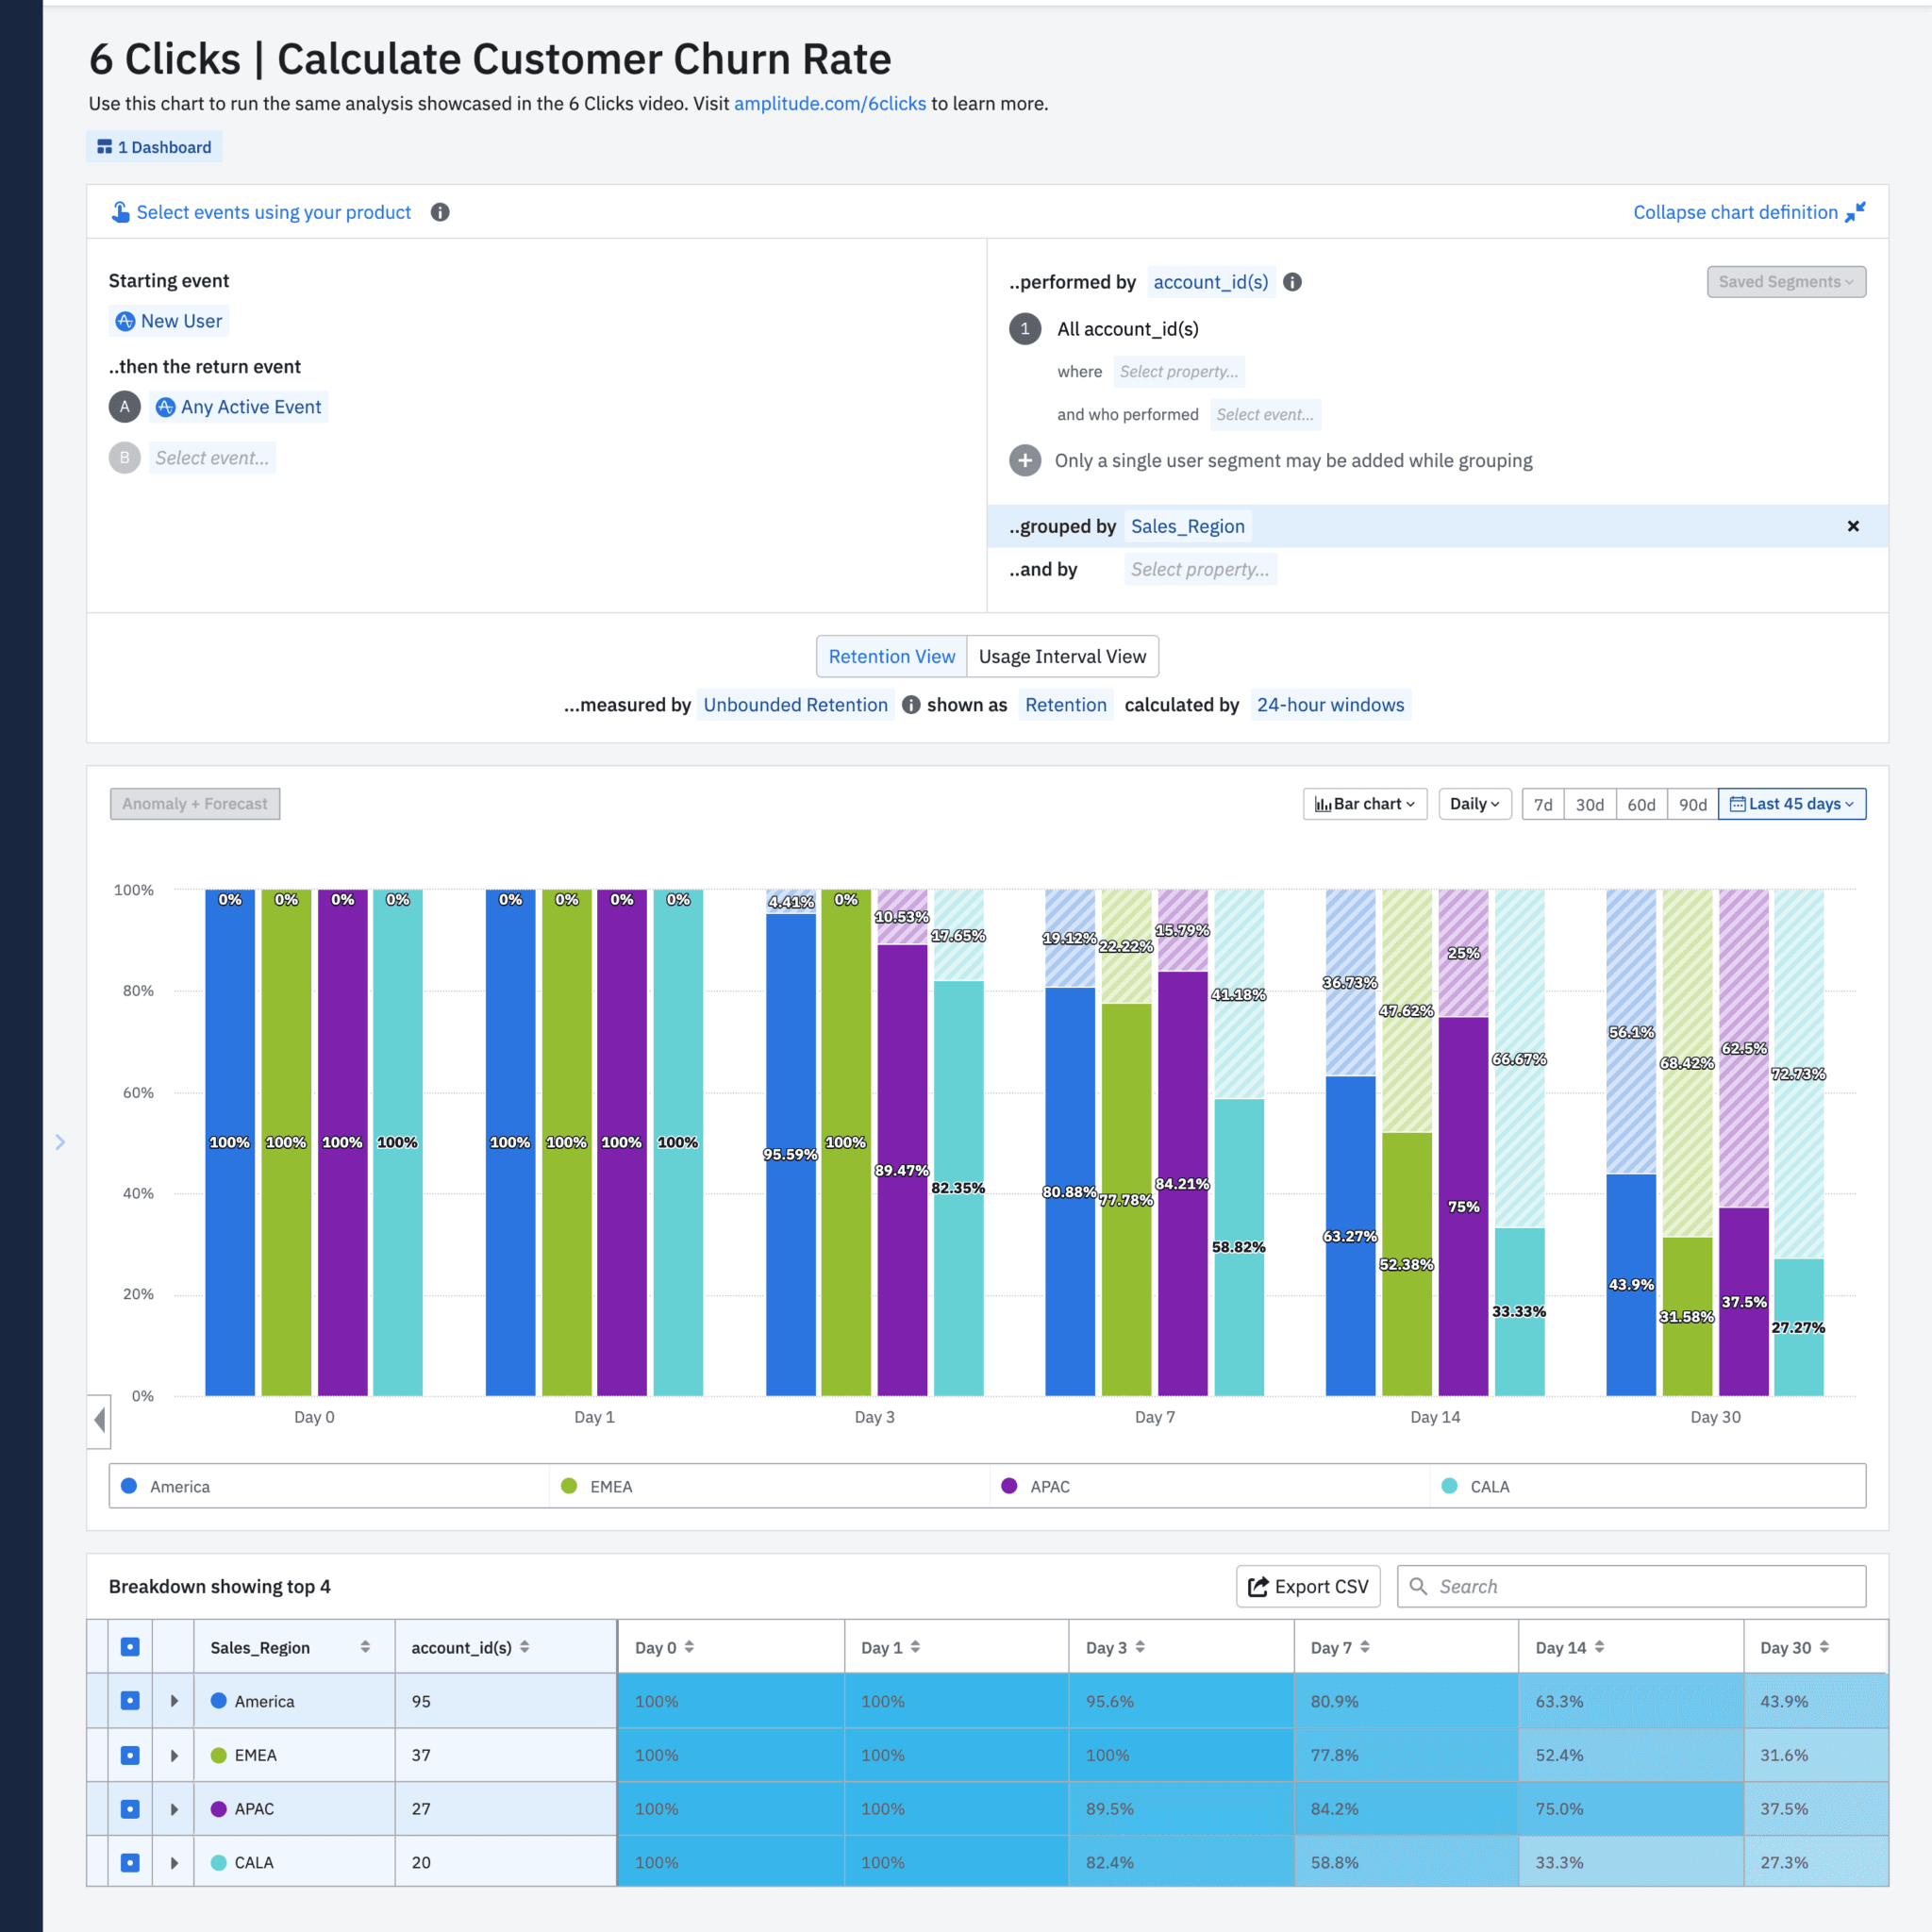
This breakdown brings up interesting trends. I notice a region where the churn rate is relatively okay until Day 14, but by Day 30, it actually doubles. This, to me, is a key finding. Something’s happening in this region between Day 14 and Day 30 that is causing so many customer accounts to churn.
Improving B2B Customer Churn Rate
This brings up ideas that we as a team can take. We can interview our customers or put in place stronger sales and marketing tactics to help retain our customers, specifically between Days 14 and Day 30 in this region.
B2B Churn by Quarter
And lastly, in B2B sales, it makes more sense sometimes to analyze this over a longer time period. Think: quarterly, instead of daily.
In Amplitude, I can simply go up to the top of the chart and change our time bounds to quarterly.
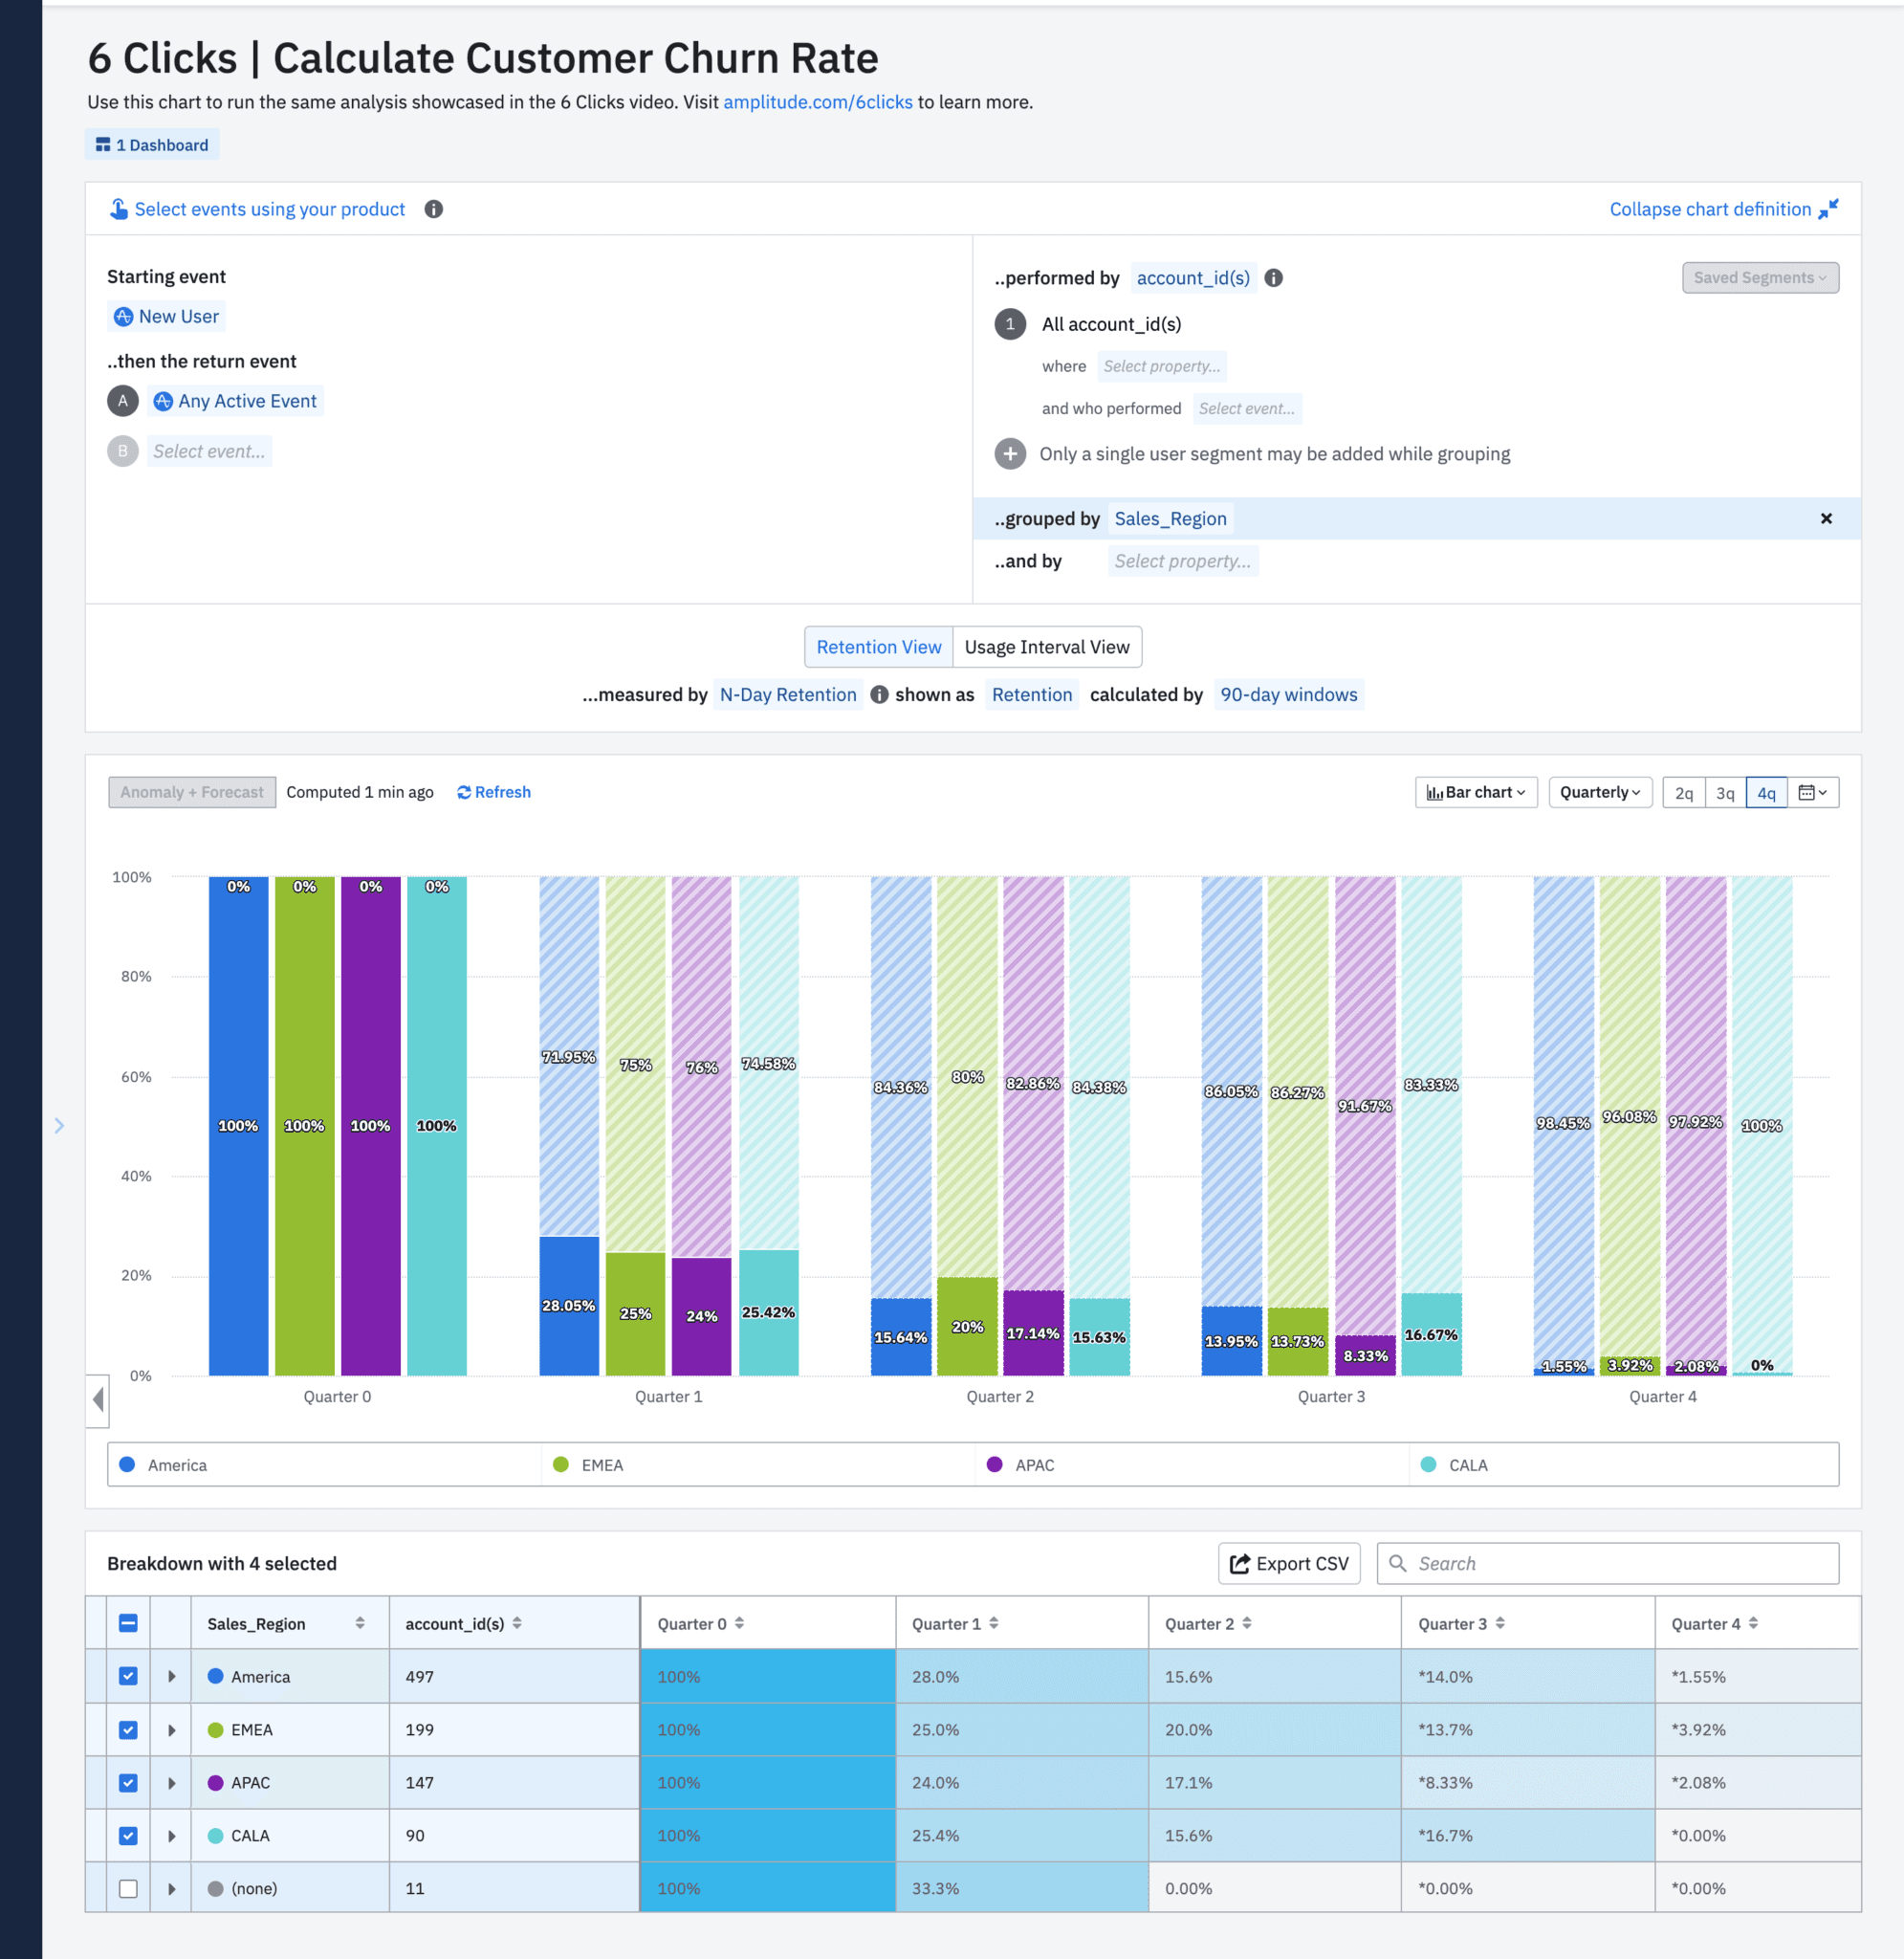
And now I can see customer churn by region per quarter.
Calculate Customer Churn Rate in Amplitude
All right, so there you have it. In six clicks and just a few minutes, I was able to calculate customer churn rate and further break it down by users and accounts. This video only scratches the surface. Amplitude has several workspaces where you can ask and answer the what, how and why behind your customer data.
To learn more tips, visit amplitude.com/6clicks. You can also try this analysis yourself in the Amplitude demo.

Darshil Gandhi
Director, Product Marketing, Amplitude
Darshil Gandhi is a Director of Product Marketing at Amplitude. He leads global technical and partner product marketing, collaborates with product and go-to-market teams on strategy, positioning, messaging, campaigns, and enablement. He was previously a solutions consulting team principal at Amplitude, and has helped dozens of Amplitude customers turn their data into actionable insights. Darshil graduated from Dartmouth College with a Masters in Engineering Management.
More from Darshil


