How Amplitude Uses Amplitude to Drive Website Engagement
Explore how Amplitude's growth team uses Amplitude to enhance user experience and drive impactful customer engagement on the website.
This post is part four of a four-part Amplitude on Amplitude for Growth Marketers blog series.
As a growth marketer at Amplitude, part of my job is getting more people to sign up for our platform via the Amplitude website. The growth team approaches our website the same way we approach our digital product: We focus on removing friction so our audience experiences value as soon as possible.
To do that, we need access to the right data. In this post, I’ll share how we use Amplitude to learn what our audience needs and how we run experiments to ensure our site delivers on those needs.
Key takeaways
- The Amplitude growth team uses Amplitude to track user behavior on our site and guide changes to meet audience needs.
- Aiming to maximize value, not just clicks, we avoid superficial enhancements and focus on changes that impact the user experience.
- We track high-level metrics and delve into user-level behavior, like pages per session and journey paths, for deeper insights.
- We use A/B testing to make decisions guided by data, helping us create an engaging website experience that builds trust and encourages return visits.
Gaining a holistic understanding of on-site behavior
Amplitude’s Digital Analytics Platform enables our team to track top-level website metrics and dig into user-level behavior so we can better understand what changes we need to make to the site.
A common misstep I see growth marketers make is only optimizing for a visitor’s first click. If you put a big red button on every page, you’ll likely get more clicks. However, you’re not necessarily making your website better or improving your customer experience. That’s why it’s important to take a more holistic approach.
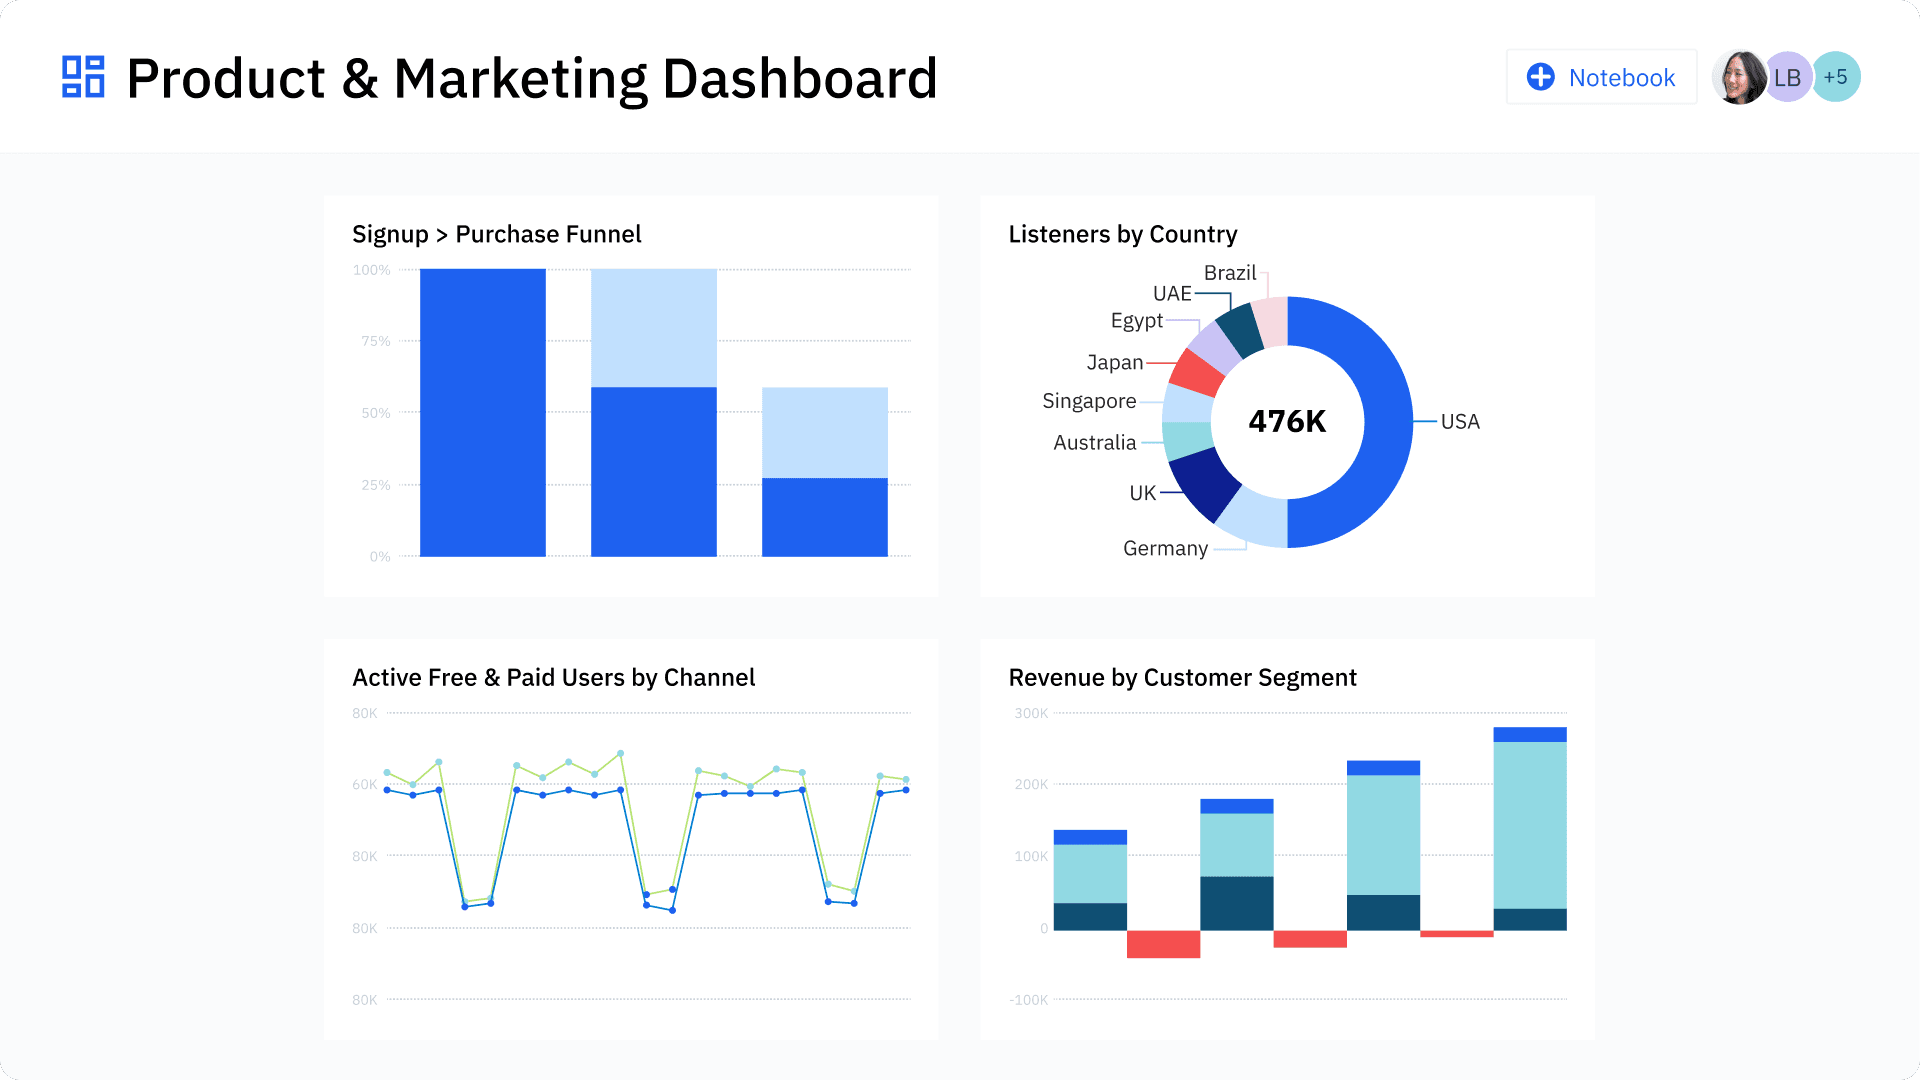
At a high level, my main metrics include total sign-ups for free accounts and total traffic. Though we want to drive those metrics, we also want our sign-ups to be scalable and the accounts we gain to be meaningful to Amplitude. We analyze other lower-level metrics—like owned vs. paid traffic and total number of sessions by channel—to give us a more complete picture.

An example dashboard to monitor key metrics in Amplitude
Our team also prioritizes looking into user behavior. For example, I don’t assume everyone landing on our website is ready to buy immediately. Instead, my goal is to ensure that every visitor finds something interesting or educational, making them want to come back a second or third time and start trusting Amplitude as a valuable resource.
With the Amplitude platform, growth marketers can identify trends in how users behave and the journeys they take through the site. By analyzing pages per session and time on site, we can determine how much time and energy we should invest in website journeys.
Initially, some folks on our team proposed a journey that was several pages long. However, once we discovered that people spend less time on our site and look at fewer pages than we expected, we knew we should focus on improving the experience for the most important two or three pages rather than putting effort into a long journey.
The growth marketing team also uses funnel analysis and event segmentation to learn more about what visitors look for when they land on the site. Recent findings led us to revamp our global navigation to help customers get where they want to go with less friction. Since that change, we’ve seen a lift in pages per session overall—suggesting that people are engaging more deeply with the site.
Testing to make decisions based on data, not opinion
Sometimes, a lack of data can force you to make decisions based on the opinion of the highest-paid person in the room—which isn’t necessarily what delivers the best results.
During our site redesign, we had two options for our homepage background: a darker blue or a lighter blue. Some folks favored the darker color because they felt it was more professional—so we went with the darker color.
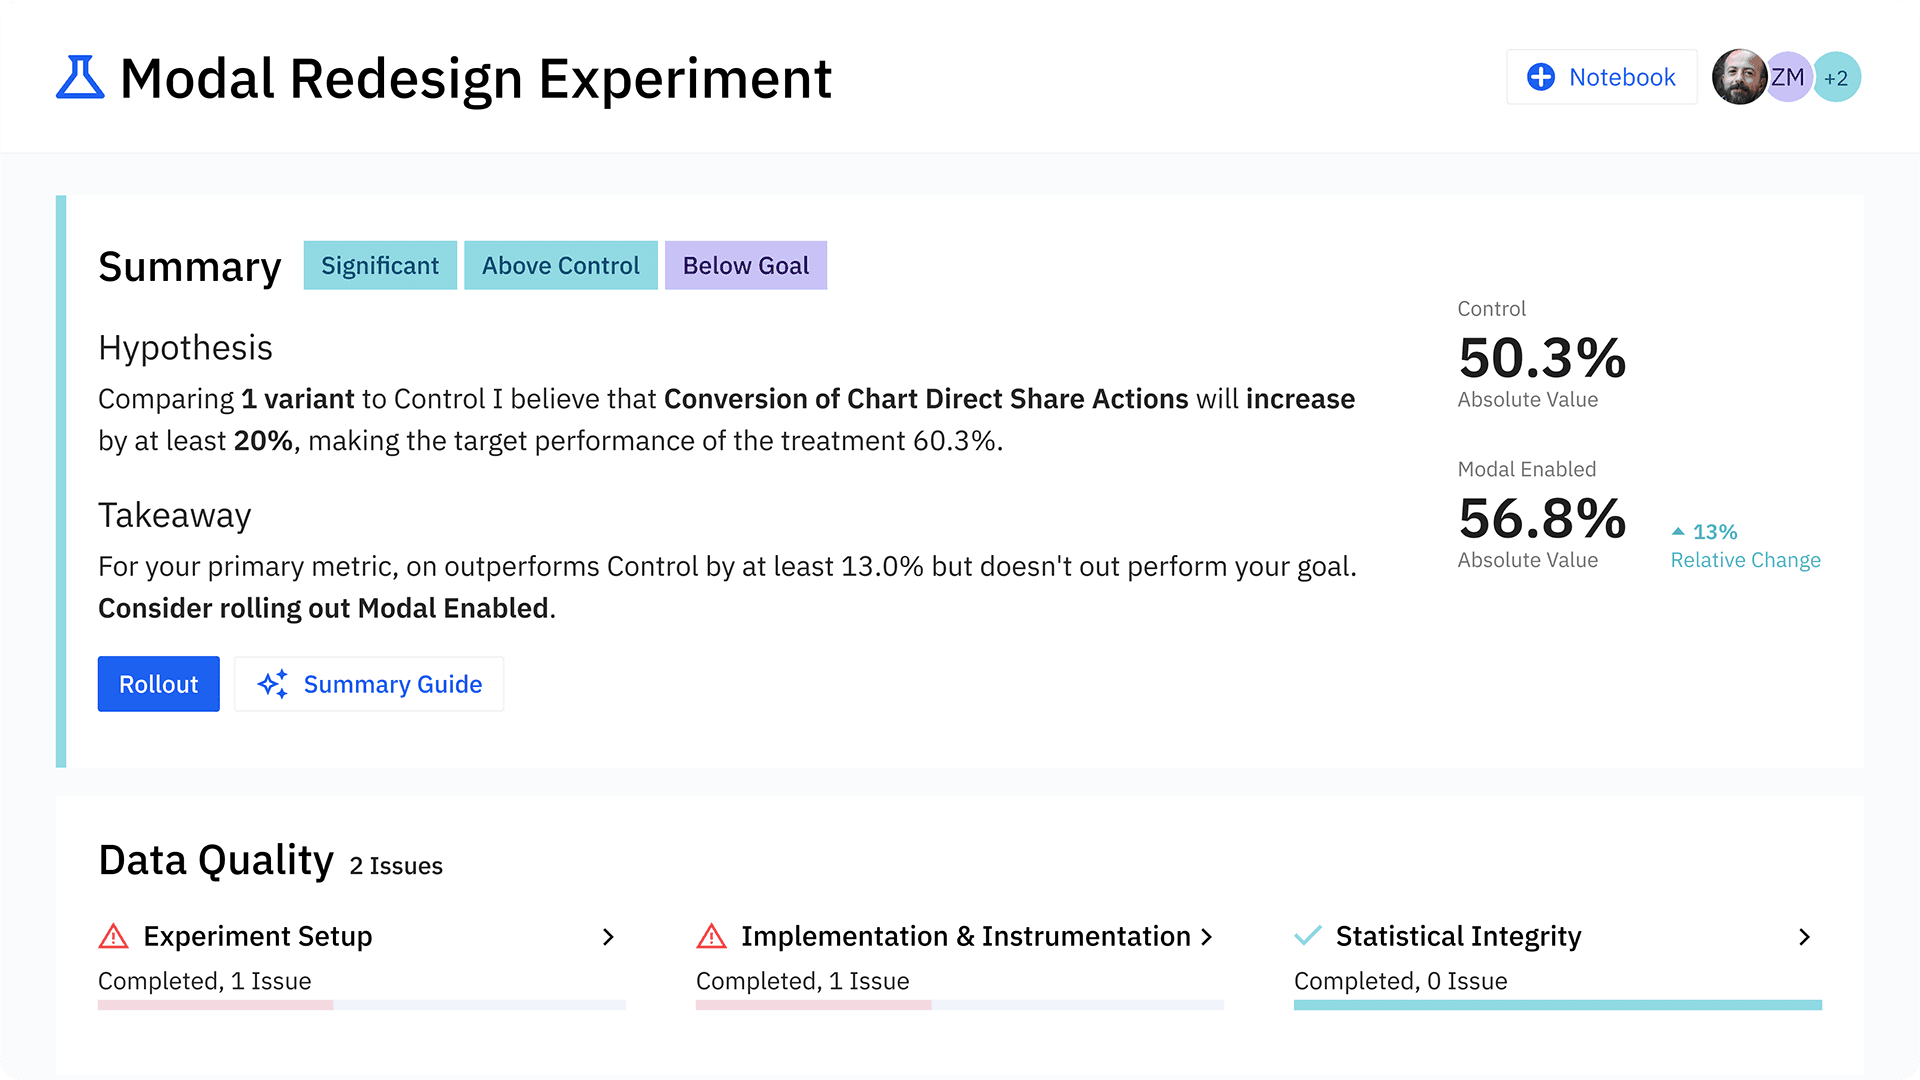
However, I hypothesized that the lighter color would make our main sign-up button more prominent and encourage more conversions. We used A/B testing on the homepage to test those two colors and found that the lighter color saw a 25% lift in clicks—so we switched to the light blue.

Building an A/B test in Amplitude
This scenario exemplifies a big win for our website engagement and demonstrates how A/B tests can increase your efficiency and save you unnecessary headaches. Instead of spending time in heated discussions based on opinions, your marketing team can say, “We want to move in this direction, and here’s the data that shows this is the best option.”
Though we use A/B testing to justify different changes, it’s not sustainable to A/B test everything. We use clear criteria to decide whether or not to run a test.
Building a clear user-driven hypothesis
It’s easy for A/B testing to become a crutch for a lack of internal conviction. So we only run an A/B test with a clear user-driven hypothesis.
I’ve seen teams considering several options for something like a page layout. However, they don't have strong feelings about any of the options, so they decide to A/B test. In those moments, I personally try not to run a test. Why? Having a thesis going into A/B tests is important so you can learn something from them.
For example, our team was working to reduce friction in our sign-up flow and hypothesized that a video would be distracting and stop people from passing to the next step. Our test results proved that hypothesis true, and we learned something about our user behavior. We won’t test a video again if and when we improve the sign-up flow in the future because we already know that it distracts users.
Finding an acceptable level of statistical significance
Ninety-five percent statistical significance is the gold standard for experimentation. In some cases, if the decision doesn’t have a major business impact, you can drop that to 85%. Let’s say you’re testing messaging on a page, and the result will inform a million-dollar brand campaign. In that situation, you’d want to get to a high level of statistical significance to be confident about the decision.
If a page has low traffic, it will typically take months to reach even the lowest level of statistical significance. We focus our optimization efforts on Amplitude’s highest-traffic pages since customers care about these pages the most.
Reaching statistical significance can be challenging even on your most popular pages, depending on your website’s traffic. Sometimes, teams wait months to reach 99% statistical significance for a 2% lift in a metric—wasting time on one test when they could have been learning other lessons.
But as they say, practice makes perfect—and this applies to getting better at testing. That way, you learn how sensitive your main metrics are and how long it usually takes them to move after a change.
Optimize your website with Amplitude
The Amplitude growth marketing team has the unique opportunity to use our own platform every day to drive our business goals—like improving website engagement and user sign-ups. I face many of the same challenges as you as a growth marketer—and I’m confident Amplitude can help.
Using the Amplitude platform, I can gather trusted data and insights, run experiments on the Amplitude site, and make data-driven decisions that improve user experience and boost conversions.
Are you a growth marketer looking to create a data-driven website strategy? Learn how Amplitude supports marketers, or get started with a free account.

Katie Geer
Former Growth Marketing Manager, Amplitude
Katie is a former growth marketing and product manager at Amplitude focused on acquisition. Previously she was in product at Redfin where she focused on experimentation and data instrumentation.
More from Katie


