3 Ways To Measure User Retention
Retention is critical for growth, but how you measure it matters.
Originally Published on December 28, 2023
Browse by category
The three main ways to measure user retention are Return On retention, Return On or After retention, and Return On (Custom) retention. How you measure retention depends on your product, business goals, and customers’ usage patterns.
Understanding your customer retention is critical to understanding the health of your business. It’s fundamental to every important metric you and your investors care about—active user count, engagement, customer lifetime value (CLV), payback period, monthly recurring revenue (MRR), and more.
You can’t improve what you can’t measure, so you should quantify your users’ engagement through analytics. But like most metrics, there are different ways to measure user and customer retention.
Understanding and measuring key retention metrics will help you assess the actions that drive customer retention. Having loyal, active users who consistently engage with your product leads to a more extensive customer base.
Key takeaways
- Measuring your retention rate is critical to understanding how your experiments improve or diminish customer retention.
- The three main ways to measure retention include Return On retention, Return On or After retention, and Return On (Custom) retention.
- The way you measure retention matters. Return On retention metrics are well-suited to companies with daily-use products, whereas Return On (Custom) or Return On or After retention metrics work better for products with different usage patterns.
- Ultimately, the retention metric most applicable to your company will depend on your customers’ usage patterns and business goals.
What is customer retention?
Customer retention measures how many customers stay with your business long-term and helps a company predict profits and growth. A company with a higher rate of retention gains users and, therefore, revenue.
A business that retains its existing customers increases its revenue and becomes profitable faster than one that does not. And yet, keeping customers engrossed in your app is no small task.
It’s especially daunting when you realize that you’re not just competing with other apps in your space—you’re competing with apathy. You’re competing with inattention. Too many apps exist for new customers to wait patiently for yours to deliver a valuable customer experience.
Why customer retention metrics matter
The acquisition cost for new customers is getting more expensive, and the competition for customer attention is getting stiffer. A Liftoff.io report that analyzed more than 400 casual mobile gaming apps found that the cost per install rate rose from $1.36 in 2020 to $3.19 in 2021.
Focusing on new customers is essential, especially for brand-new companies—if you don't have new customers, you can't turn them into existing customers. However, growing your current customer base will drive sustainable growth, given that only 23% of mobile app customers return between days 15 and 30. Loyal customers who make repeat purchases and subscribers who provide reliable monthly recurring revenue have a higher customer lifetime value for your bottom line than one-off users.
To cut through the static and distractions, you should quickly deliver a customer experience that turns new customers into repeat customers. There’s no better tool for doing so than analytics.
Three ways to measure customer retention rate
There are a few ways to calculate customer loyalty, and it’s not always clear how your analytics platform defines customer retention rate.
The most common and widely known retention metric is Return On retention. Still, at Amplitude, we also make it easy for customers to calculate and measure Return On or After retention and Return On (Custom) retention, formerly known as unbounded and custom bracket retention, respectively.
To determine your company's most suitable customer retention metrics, you should understand what you want to learn and how your customers naturally behave. It’s unlikely you’ll know this from the onset, so most organizations start with Return On retention.
1. Return On retention is best for loyal customers who return daily
Return On retention measures how many customers return to your app on a particular day. It’s well-suited for apps trying to develop a daily habit amongst customers, such as gaming apps.
You start counting from “Day 0,” or the day of customer acquisition. Day 0 could be when a customer downloaded, registered, or performed any action within your app—played their first song, added their first friend, etc. Then, you can study that cohort over the following days, looking at how many returned or performed another kind of action on Day 1, Day 2, Day 7, and so on.
When you first start measuring customer retention, Return On retention helps you understand basic usage patterns. During this stage, progress entails making educated guesses about how existing customers gain value from your app and how well you meet customer expectations.
Looking at the number of customers who return to your app after one, two, or three days isn’t the most elegant approach, but it will help you begin to test assumptions about how people use your app.
This retention curve shows the weighted averages of all the Return On retention numbers in a Day 0 to Day 30 timeframe.
Research shows that bending that line upwards between Day 0 and Day 1 is one of the most significant opportunities to retain customers.
Retaining customers within the first 24-48 hours of the customer lifecycle is a critical customer retention strategy. This is when first impressions are made and solidified. No amount of “We miss you” emails will bring back a churned customer who had a lousy first engagement with your app.
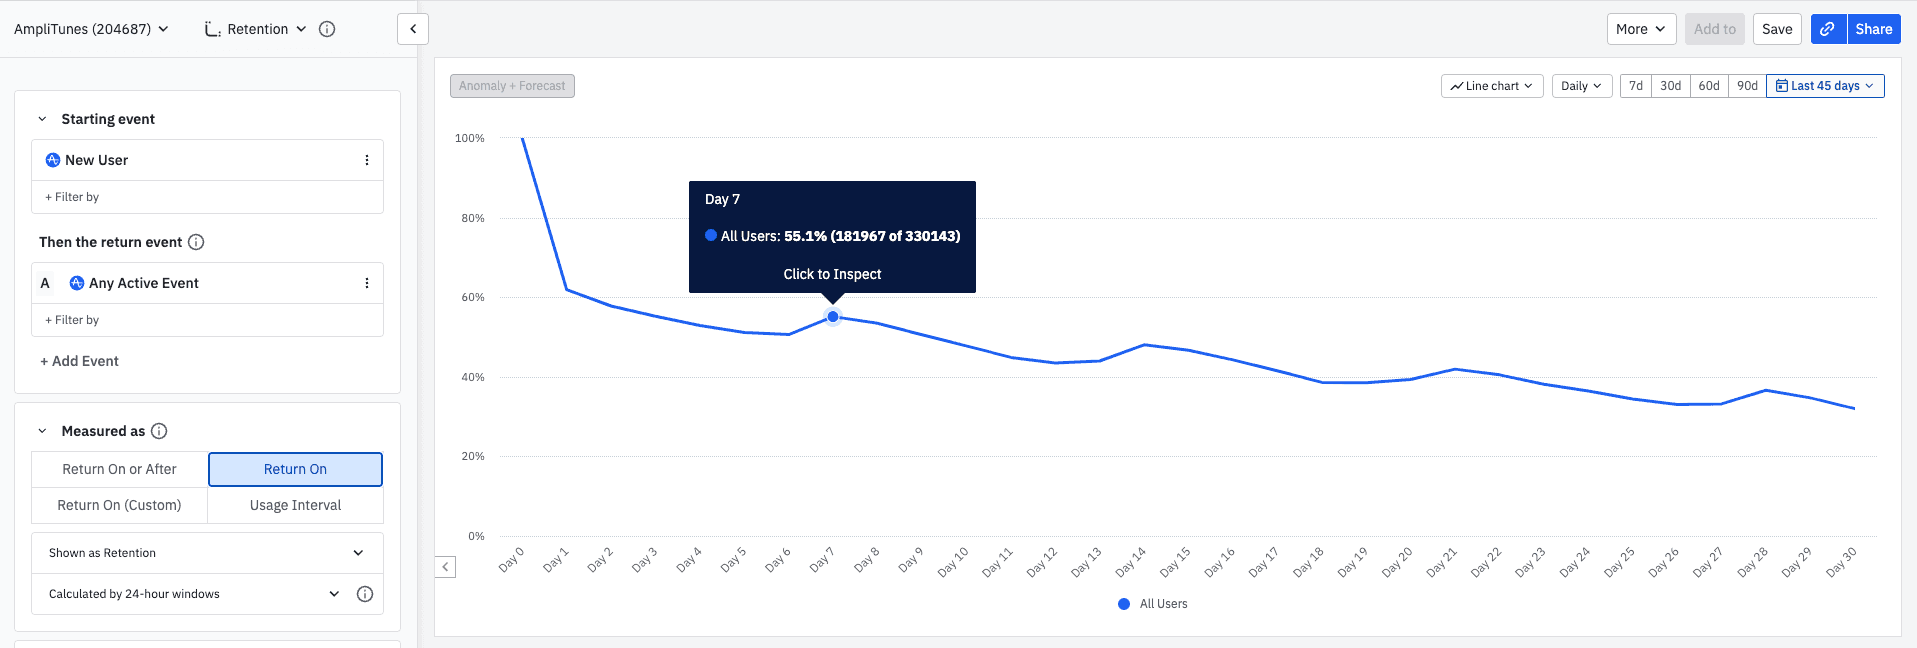
This Amplitude product demo page screenshot demonstrates how to measure Return On retention.
Return On retention gives you a solid basis for experimenting with different onboarding flows.After each experiment, you can see whether new customers become loyal customers.
2. Return On or After retention is the inverse of the customer churn rate
Return On or After retention, formerly known as unbounded retention, is a more meaningful way to measure customer retention rate if your product doesn’t rely on daily engagement. Return On or After retention shows the percentage of customers who returned on a specific day or any given time after that day.
Put another way, Return On or After retention is the inverse of your churn rate. By measuring the inverse of Return On or After retention, you can see precisely the total number of customers who used your app on Day 0 and never continued their customer journey:
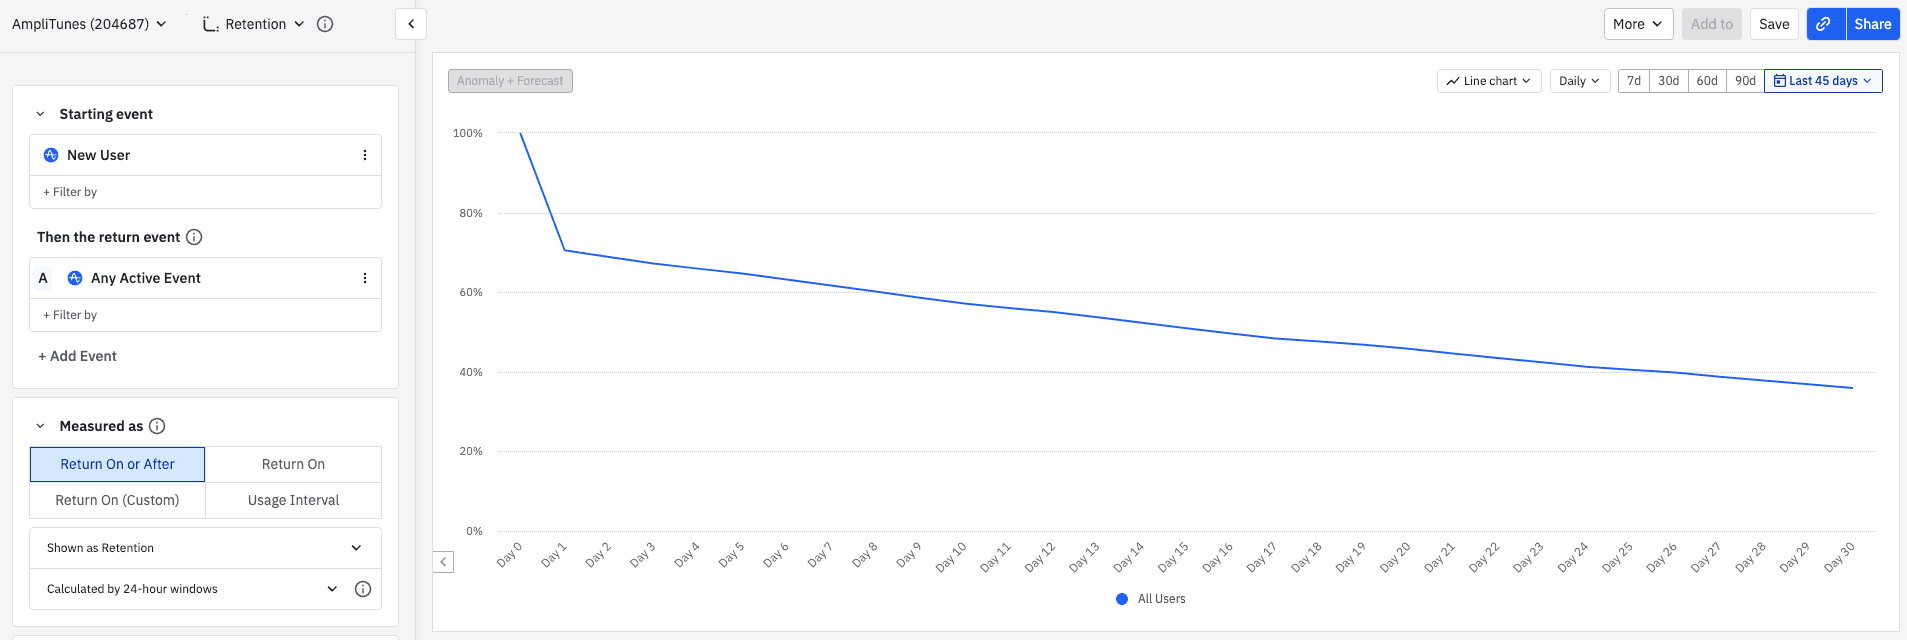
This Amplitude product demo page screenshot demonstrates how to measure Return On or After retention.
This is the same set of data points that we looked at in the Return On customer retention graph above. Notice our Return On or After Day 1 retention rate is around 70%, compared to about 60% for Return On—that’s because roughly 70% of all new customers who signed up on Day 0 returned at some point during the following month.
Return On or After retention analysis is a better fit than Return On retention for many types of businesses. For example, a grocery delivery service like Instacart doesn’t expect people to use the app daily. If someone doesn't come back exactly on Day 7 or Day 30, it doesn't mean they are churning, which is what your Return On retention would say.
Instead, looking at your Return On or After Day 7 retention would provide better insight into how many new customers return to your app after the first week.
3. Return On (Custom) retention is a more nuanced metric
Return On (Custom) retention is a catch-all since you can define custom retention over any period. Once you understand your average customer and their expected usage patterns, you can begin to use Return On (Custom) retention. Return On (Custom) retention is more nuanced as it lets you split up your measurements into custom intervals of multiple days, weeks, or months. The image shows the setup of four brackets:
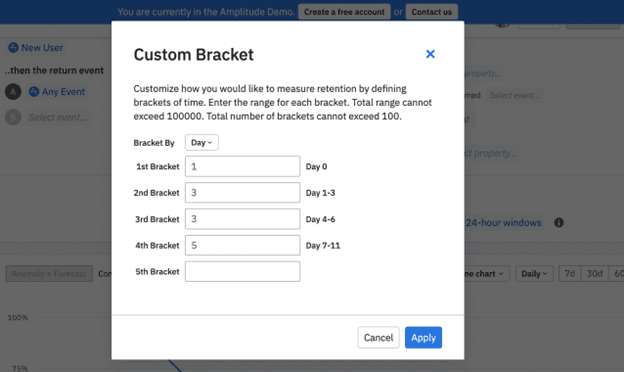
This Amplitude product demo page screenshot demonstrates how to set up brackets to measure Return On (Custom) retention.
- Day 0 (one day)
- Day 1-3 (three days)
- Day 4-6 (three days)
- Day 7-11 (five days)
If any activity in the app qualified a current customer as “active,” then someone would be counted as fully “retained” by:
- Registering for the app on Day 0.
- Coming back on Day 1, Day 2, or Day 3.
- Coming back on Day 4, Day 5, or Day 6.
- Coming back on Day 7, Day 8, Day 9, Day 10, or Day 11.
Here’s what a retention curve might look like with these brackets:
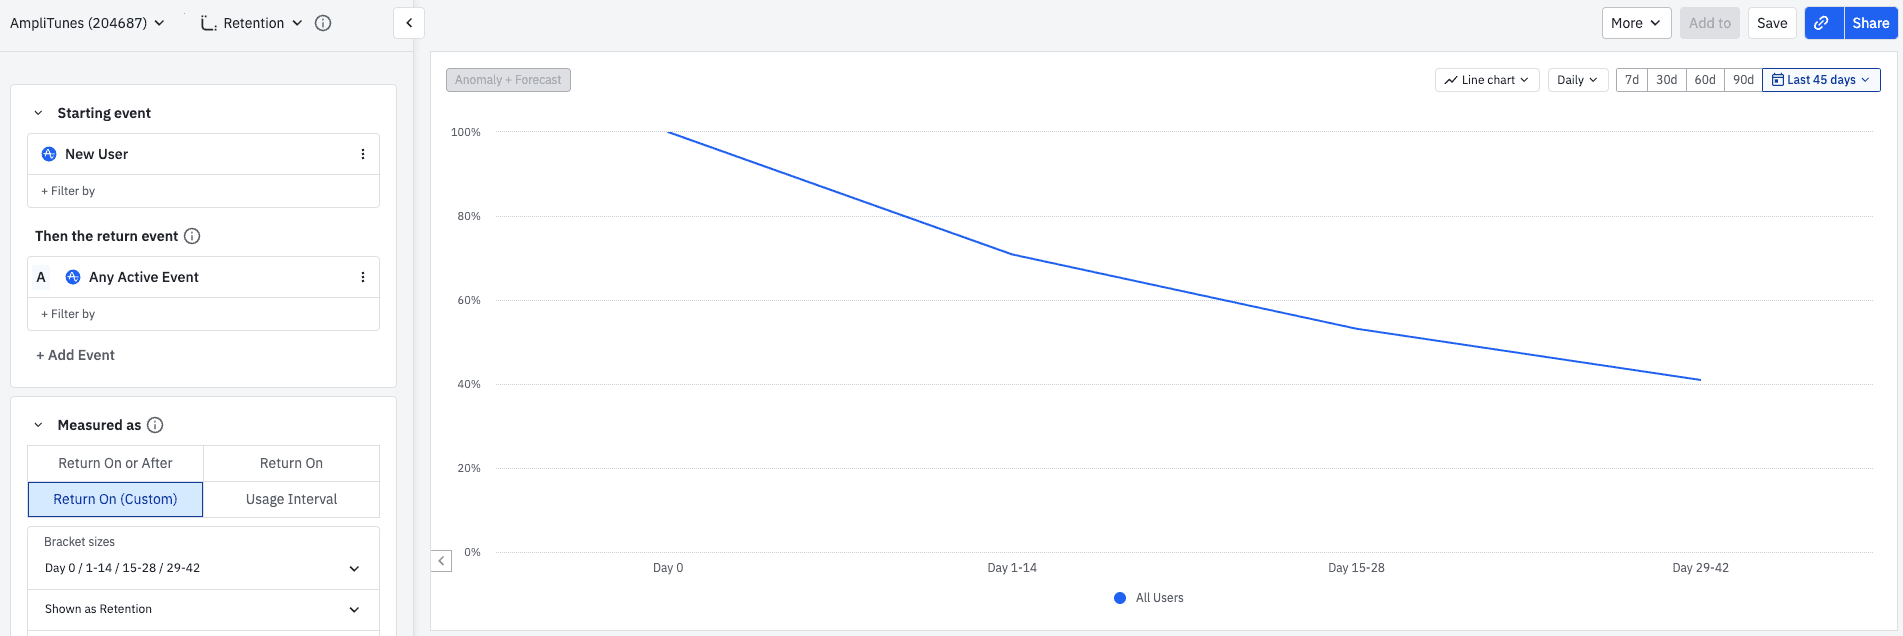
This Amplitude product demo page screenshot demonstrates how to measure Return On (Custom) retention.
Determining the type of retention to use depends heavily on how often you expect users to engage with your app. Return On retention is the best fit if you expect people to return regularly, like daily for a mobile game or weekly for an exercise app. If your users don’t have a steady usage pattern—for example, a food delivery app where people place orders sporadically—then Return On or After retention may provide a more accurate measure of business health.
First, use several methods to measure your retention to see which provides the most meaningful information. The right customer retention metrics should show you where to deliver customer success, improve customer satisfaction, and give an accurate view of your business health.
Examples of measuring customer retention rate to improve growth
Companies testing different growth strategies must measure their customer retention rate to understand how each approach or change in the customer experience encourages or discourages retention.
Below are three companies that use Amplitude’s retention analysis tools to improve their bottom line and retain customers.
Rappi
Columbian delivery SaaS company Rappi had a big idea for driving new revenue and delivering a better customer experience. It wanted to test upselling a new customer tier called Prime, allowing customers to order unlimited monthly deliveries.
Using Amplitude’s retention analysis tools, the test outcomes noted a 2.5x increase in user retention.
The company also ran an experiment to identify the customer behaviors correlated with better customer retention. It divided its customers into cohorts, and A/B tested different behaviors and measured those behaviors with a retention analysis.
Rappi discovered customers who placed more orders in the first 20 days would likely be retained longer. Using that information, it now has a North Star metric to increase how many users order in the first 20 days of using the app.
Le Monde
After French news publisher Le Monde launched its new website, it leveraged Amplitude’s retention capabilities to understand why customers subscribe and what makes them stay year after year.
Le Monde created cohorts to measure behaviors, like whether a customer subscribed to the newspaper after reading specific article types and the role of pricing in a subscriber’s decision. It used retention analysis to determine whether a particular writing style or topic attracted more loyal subscribers. Their findings now inform the newspaper’s voice and help dictate the reporting beats it invests in.
Calm
Mindfulness meditation app Calm wanted to understand how it could improve retention against existing benchmarks.
It looked at customer behaviors associated with using different features and found a promising lead with the “daily reminder” feature. The reminder was buried deep in the menu, and only 1% of users had it activated. However, those users had 3x the retention rate of other users not using reminders.
They then tested whether this eye-popping increase in customer retention applied to a broader cohort. Calm made the feature more prominent for some of its new users and discovered the retention behavior was true.
Start measuring user retention with Amplitude
Increasing user retention and minimizing churn is the key to building a base of loyal, engaged users and driving sustainable growth. But like any metric, you can’t improve retention without the ability to measure and track it easily.
Return On, Return On or After, and Return On (Custom) are three effective ways to measure retention. To summarize the key differences between Return On, Return On or After, and Return On (Custom) retention:
- Return On retention: The percentage of users that return on a specific day.
- Return On or After retention: The percentage of users who return on a specific day or after.
- Return On (Custom) retention: A flexible version of Return On retention using custom timeframes.
Your retention method heavily depends on how frequently you expect people to use your product.
With a leading product analytics platform like Amplitude, you can start measuring retention using different methods to see which gives you the most meaningful improvement and accurate view of your business health.
Learn how to supercharge customer retention with Amplitude’s Mastering Retention Product Analytics Playbook.

Pragnya Paramita
Former Group Product Marketing Manager, Amplitude
Pragnya is a former Group Product Marketing Manager at Amplitude. She led the go-to-market efforts for data management products. A graduate of Duke University's Fuqua School of Business, she is passionate about working at the intersection of business and technology and when time allows, cooking up a storm with cuisines from all over the world.
More from Pragnya
