Frequentist vs. Bayesian: Comparing Statistics Methods for A/B Testing
Learn more about the Frequentist and Bayesian statistics methods in the context of web experimentation and a/b testing calculations. See how testing is approached with both.
Originally published on October 10, 2023
Browse by category
Flip a coin. Before you look at the result, pause and ask: What’s the probability the coin landed on heads?
Depending on your answer, you’re either a Frequentist or a Bayesian—statistically speaking, at least.
According to a Frequentist statistical approach, there’s a single correct answer. If the coin is heads, the probability that the coin landed on heads is 100%. If it’s tails, the probability is 0%.
With Bayesian statistics, probabilities are more subjective. In the coin toss example, a Bayesian approach states that the probability of it landing on heads or tails boils down to your beliefs. You might believe there’s a 50% chance for each outcome, or your confidence in the coin’s fairness could also influence your answer. According to this statistical approach, once you’ve seen the result, you’d update your beliefs based on that new information.
The main difference between the two methodologies is how they handle uncertainty. Frequentists rely on long-term frequencies and assume that probabilities are objective and fixed. Bayesians embrace subjectivity and the idea that probabilities change based on new information.
Product marketers can use both statistical philosophies to enhance their A/B testing.
Key takeaways
- Frequentist and Bayesian statistics differ in how they interpret probabilities, approach prior beliefs, and update probabilities based on new data.
- These are advanced statistical methodologies, but you can use them in your A/B tests without being a data scientist.
- The best statistical methodology for your next A/B test will depend on context, sample size, and whether you want to incorporate prior knowledge or beliefs into your experiments.
How do Frequentists and Bayesians approach statistical analysis in A/B testing?
No matter how long you've been running experiments, A/B testing and statistical analysis can be confusing. There’s so much to understand about these deep and complex topics, but you can use these principles in your work without being an expert statistician.
At their core, Frequentist and Bayesian statistics primarily differ in how each methodology approaches:
| Frequentists | Bayesians | |
| Hypothesis testing | Set null and alternative hypotheses and use statistical tests to assess evidence against the null. | Consider prior beliefs when forming hypotheses. |
| Probability interpretation | Frame probability in terms of objective, long-term frequencies. | Interpret probabilities subjectively and update them as new data is collected. |
| Sampling | Emphasize random sampling and often require fixed sample sizes. | Can adapt well to varying sample sizes since Bayesians update their beliefs as more data comes in. |

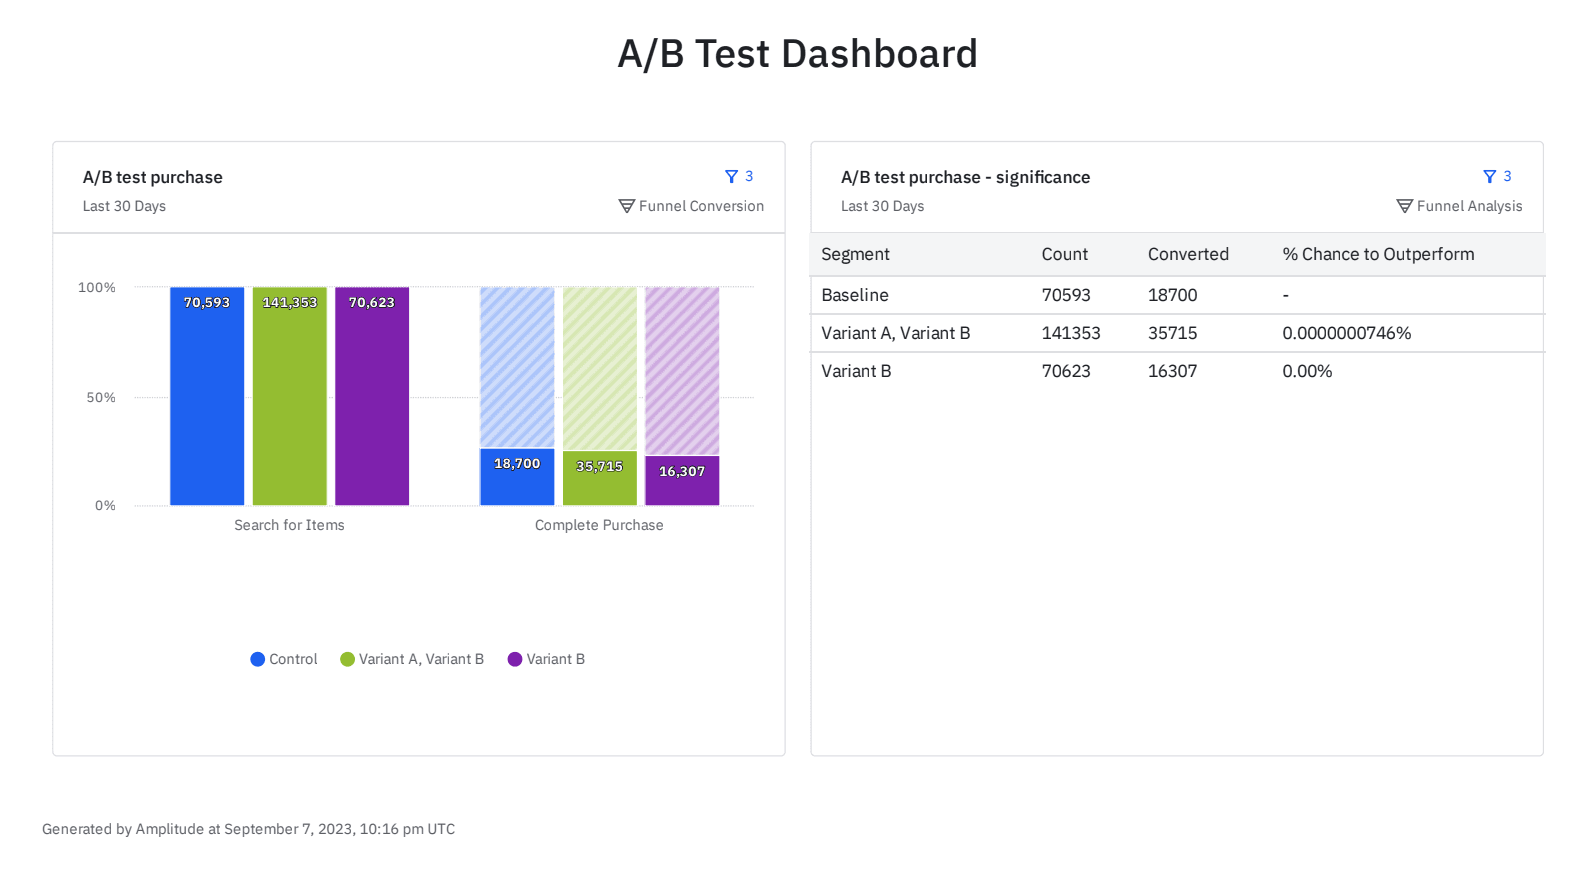
An example of an A/B Test Dashboard in Amplitude Experiment summarizing variant performance. Try this chart yourself in our self-service demo.
What are Frequentist statistics?
Frequentist statistics view probability as the long-term frequency of an event occurring.
For example, if you roll a fair, six-sided die hundreds of times, you might roll a five four times in a row. But, over the course of hundreds of rolls, you’ll get a five one out of every six times. Frequentists would use this logic to say that you have a one-in-six probability of getting a five on the next roll.
With a Frequentist approach to A/B testing, tests begin with the assumption that there isn’t a difference between the two variations. Your goal is to determine whether the results are meaningful enough to disprove your initial assumption.
You’ll frequently hear references to p-values when talking about Frequentist statistics. The p-value measures how strong the evidence against the null hypothesis is. Suppose the p-value is below a certain significance level, usually 0.05 or lower. You’d reject the null hypothesis—meaning there’s a significant difference in performance between the variations.
Imagine you're testing landing page variations to see which earns more sign-ups. Your null hypothesis is that neither will earn significantly more sign-ups than the other.
You collect data on user sign-ups for both A and B versions and calculate p-values to see if there's a significant difference between the performance of each version. If the p-value your test generates is less than 0.05, it means one version is statistically better at getting sign-ups.
What are Bayesian statistics?
With a Bayesian statistical methodology, your prior knowledge forms your initial hypothesis, and you update your beliefs as new data surfaces.
Unlike the Frequentist approach to A/B testing, which sets strict boundaries on whether something is 100% true or false, a Bayesian approach gives you probabilities of whether your hypothesis is true or false. For example, there could be an 80% chance your hypothesis is true and a 20% chance it’s false.
Here’s how to use a Bayesian methodology for an A/B test:
- Form a hypothesis: Imagine you hypothesize that a simpler sign-up form will increase new user sign-ups for free product trials. You believe that reducing the form’s required fields will reduce friction and streamline the process.
- Determine the probability your hypothesis is true: You’ve experienced good results when you’ve used shorter lead capture forms in the past for similar efforts, like product demo requests. Based on that information, you estimate a 70% chance of success for condensing the new user sign-up form.
- Collect data and calculate posterior probabilities: Collect data on sign-up rates as users interact with the new form. Update your hypothesis and assumptions as data comes in. This updated value is your posterior probability.
- Iterate, collect more data, and repeat: Now, your new posterior probability becomes your prior probability for the next round of testing. In this example, sign-up rates increased by 20% with the new form, so this information becomes your new prior probability for the next round of A/B testing. Repeat the cycle to continue refining and optimizing.
Should you use Frequentist or Bayesian statistics?
Which approach is best for your A/B tests? It depends on the context, available data, sample size, and whether you want to incorporate prior beliefs.
Suppose you want to determine whether a new product feature significantly increases user engagement. It's a totally new feature, and you don’t yet have historical knowledge of how it might impact user behavior. A Frequentist approach would give you a straightforward look at the statistical significance of the new feature’s impact by comparing it to the product version without the new feature.
Alternatively, you may want to optimize a customer onboarding flow, and you already have some prior user behavior and preference data. Bayesian methods would allow you to integrate this prior information and continuously update your understanding as you collect new user data.

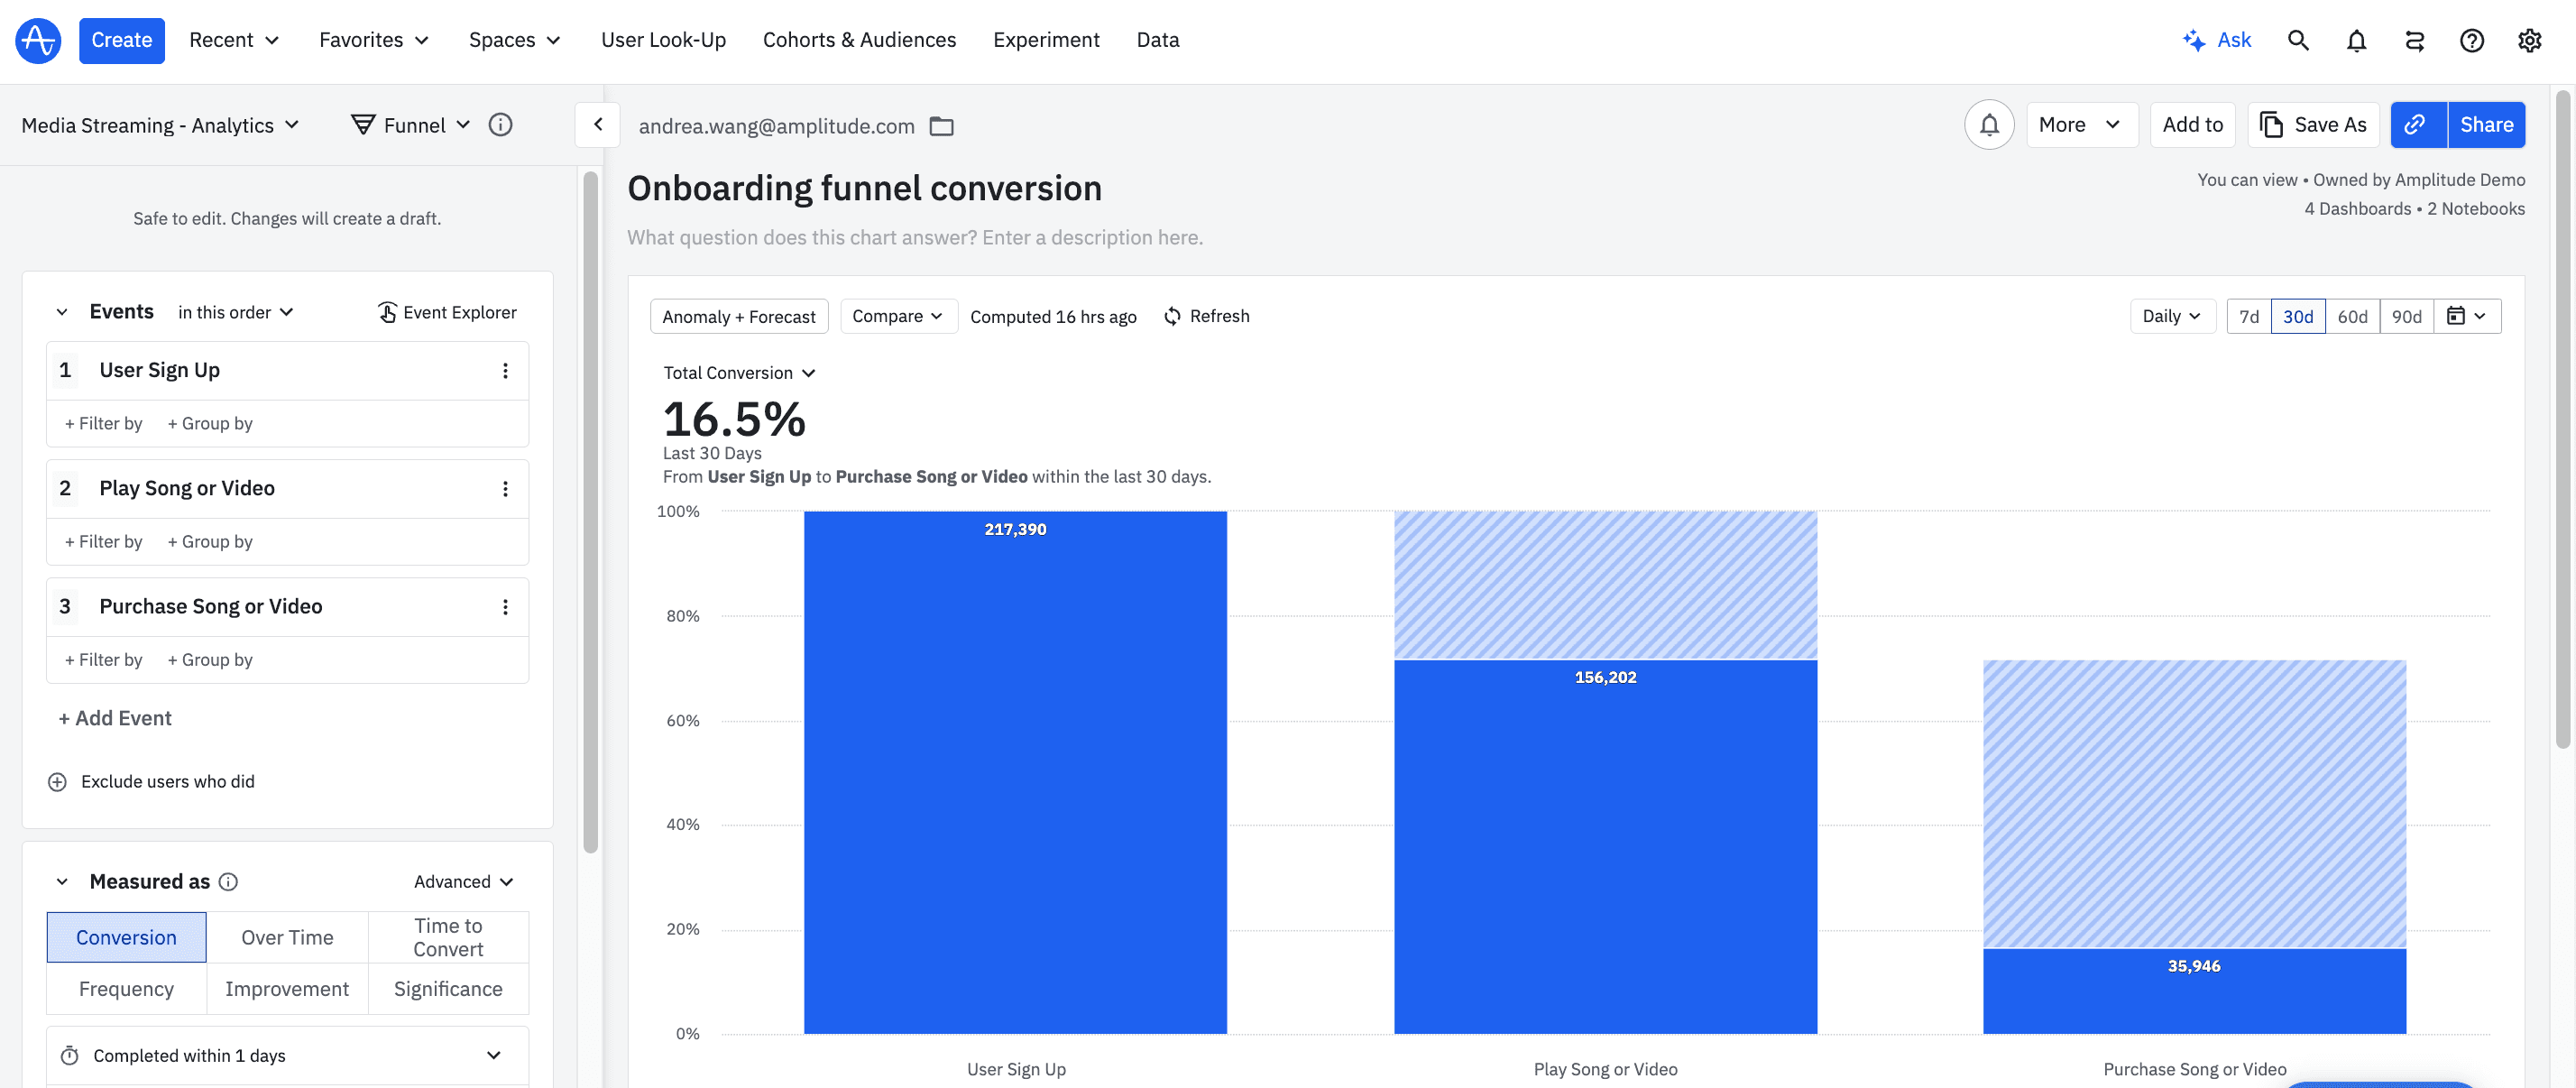
An example of an onboarding funnel conversion graph in Amplitude summarizing the total conversions for various onboarding milestones. Try this chart yourself in our self-service demo.
Your sample size also plays a role in the statistical approach you choose. In Frequentist statistics, you often need a larger sample size because larger samples tend to generate more precise data with stronger statistical power. Since Bayesian statistics consider prior and ongoing information, they’re more adaptable to varying data availability levels, and you’ll get valuable insights even with smaller sample sizes.
Amplitude simplifies A/B testing for product teams
There isn’t a one-size-fits-all or “better” approach to A/B testing. The best framework for you depends on how you like to make decisions, your available data, and how much flexibility you want as new data comes in.
Regardless of methodology, one thing is true for all product teams: Experimentation drives product growth. And Amplitude can help you make sense of those experiments. Amplitude makes it easy to identify what your customers love about your product, where they’re getting stuck, and what keeps them coming back. With Amplitude Experiment, you can easily:
- Analyze A/B test results.
- Segment users into cohorts and determine which are most likely to convert.
- Learn what drives user behavior—and, ultimately, revenue growth.
Sign up for free today to unlock the power of your product.

Phil Burch
Former Group Product Marketing Manager, Amplitude
Phil Burch is a former Group Product Marketing Manager for Amplitude Experiment. Phil previously held roles across the customer lifecycle including account management, solutions consulting, and product onboarding before moving into product marketing roles at Sysomos, Hearsay Systems, and Tray.io.
More from Phil


