The Pathfinder Users chart: see the paths your users take through your product
Note
This chart will be merged into the new Journeys experience. This article will remain live for as long as legacy Pathfinder Users charts remain accessible. Learn about the new Journeys experience with support for top user paths here.
Amplitude's Pathfinder Users chart shows you the "paths" your users are taking through your product. Just specify an event you're interested in, and Amplitude will tell you the steps your users took to get there, or the events they fired afterwards. It's a handy way to identify the natural pathways in your product, and can help generate strategies for guiding the user experience in a new or more effective direction.
Note
Custom events are not supported in Pathfinder Users for Amplitude 2.0.
Before you begin
- Event's don't appear in Amplitude charts until instrumentation is complete.
- Read the article about building charts in Amplitude.
- Learn the difference between active and inactive events, as Pathfinder Users' charts hide inactive events by default.
You should also keep in mind that all paths in Pathfinder Users are tracked in individual sessions. This means that if you're sending Amplitude events via the HTTP API or through another pipeline, you must send a session_id with the event. If you don't, your product's path views won't be accurate.
Set up a Pathfinder Users chart
To build your own pathfinder user analysis, follow these steps:
-
In the Events Module, decide whether you want your path to start with a specific event, or end with one:
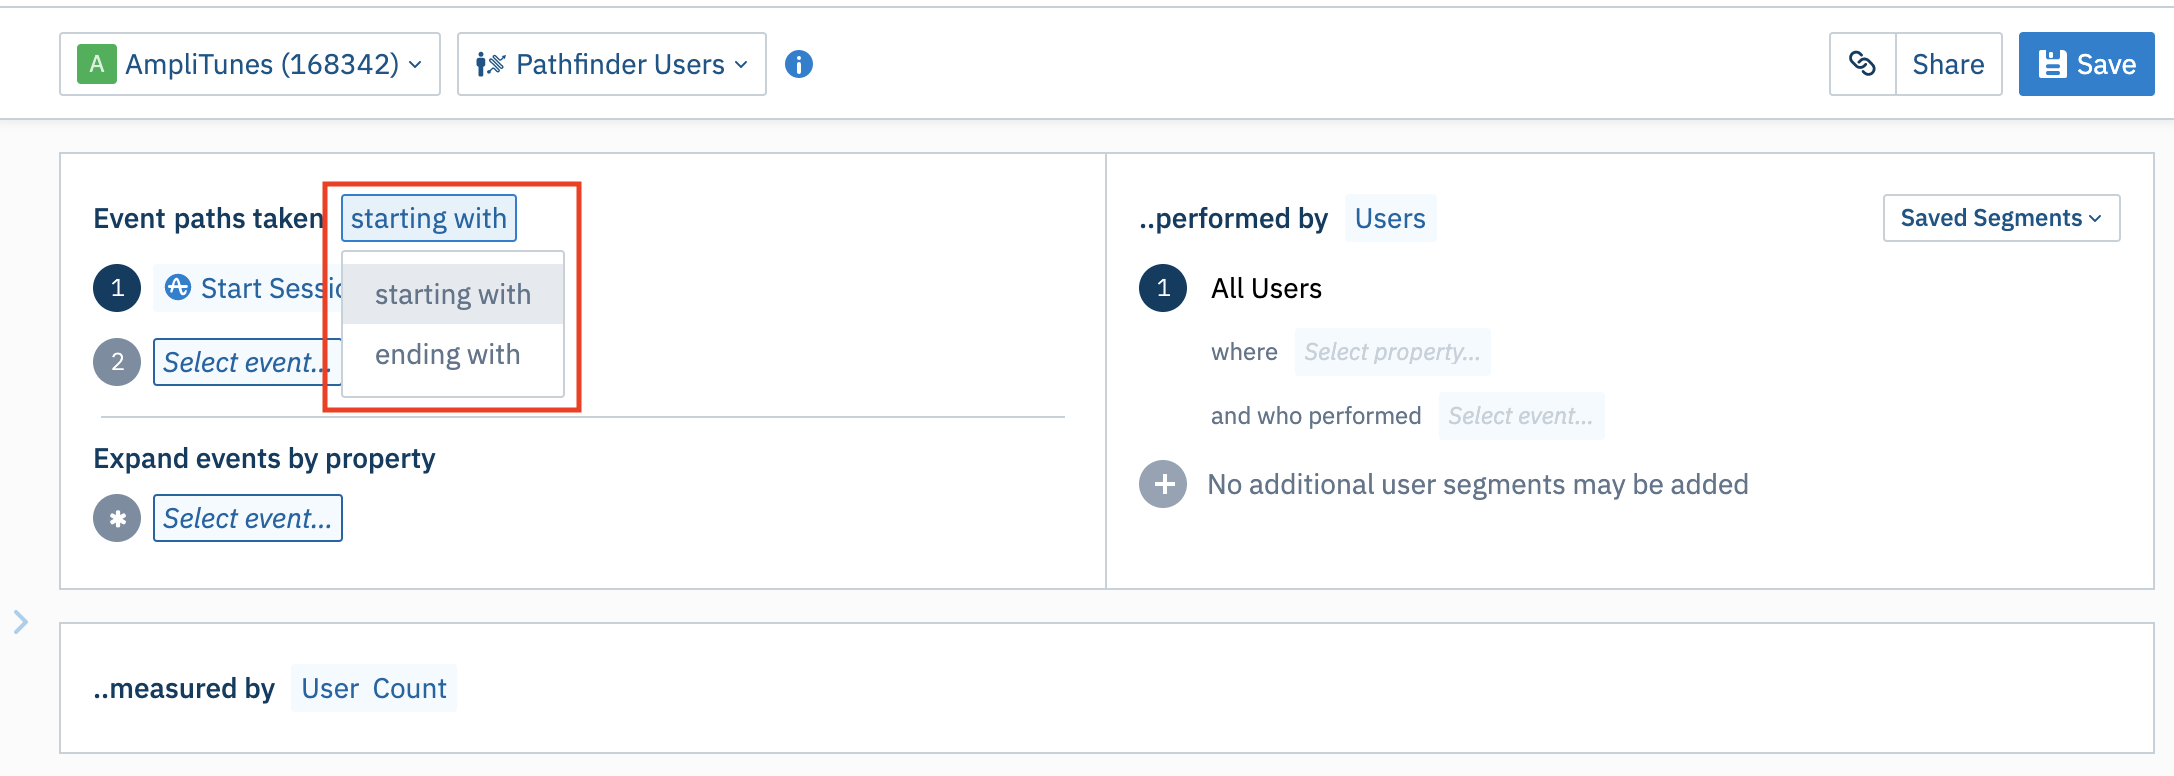
- To view the actions or events users take after a given event, select starting with from the Event paths taken dropdown menu.
- To view the events users take before a given event, select ending with from the Event paths taken dropdown menu.
-
Select the starting (or ending) event. Unlike many other Amplitude charts, Pathfinder Users requires you to choose a specific event that is instrumented in Amplitude; choosing Any Eventis not supported.
-
If desired, add properties to your starting event by clicking on + where, selecting the property name, and specifying the property value you’re interested in.
-
You can also add up to four other events to your path, if you wish. The effect of adding more steps to your path will be to narrow the focus of the analysis to users whose path matches the order of events you select.
-
In the Segmentation Module, identify the user segment you want to include in this analysis. You can import a previously-saved segment by clicking Saved Segments and selecting the one you want from the list. Otherwise, Amplitude begins from the assumption that your analysis will target all users.
-
If you do not want to import a previously-saved user segment, you can start building your own by adding properties. To do so, click + where, choose the property you want to include, and specify the property value you’re interested in.
-
You can narrow your focus even further by telling Amplitude you only want to include users who have already performed certain actions. To do so, click + perform, then choose the event you’re interested in.
-
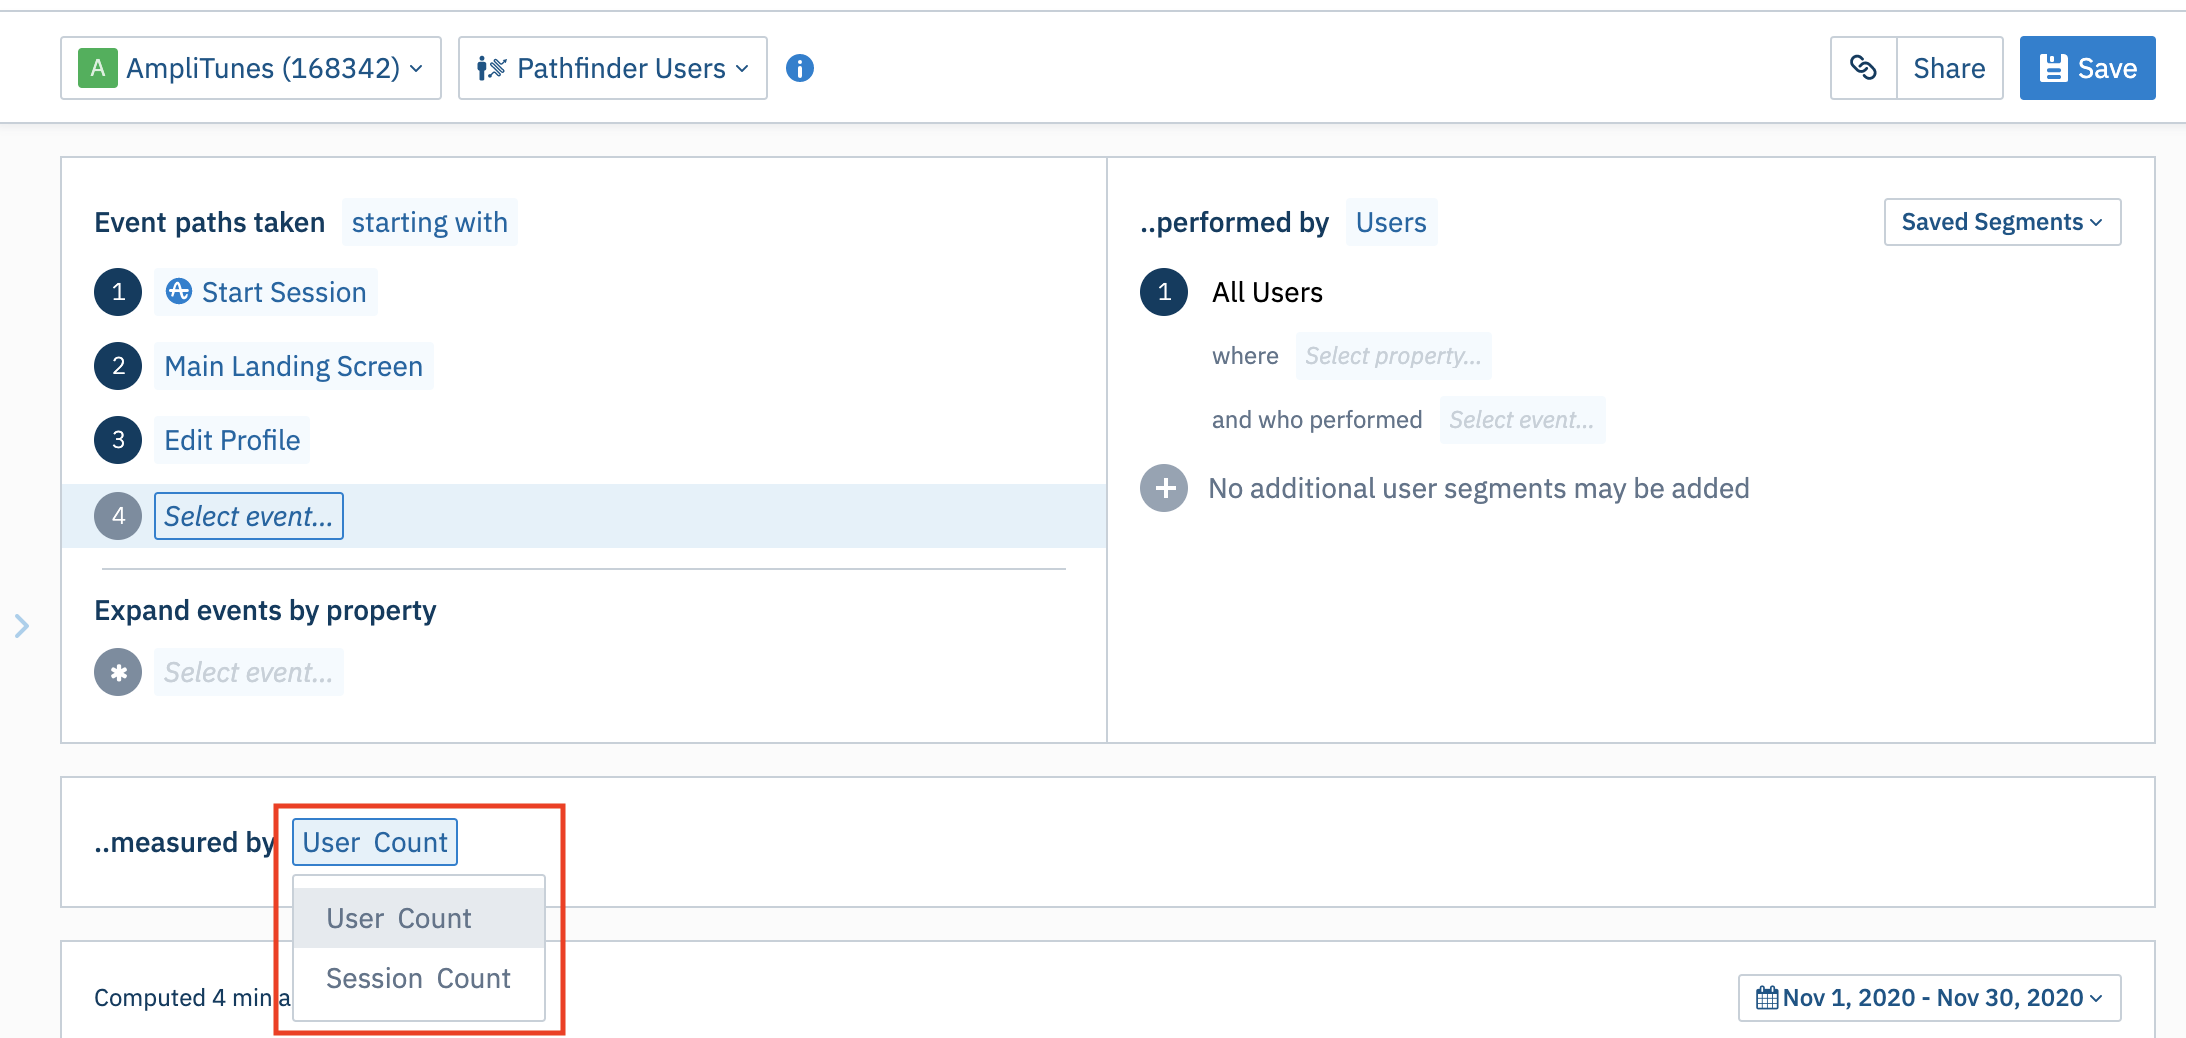
In the Metrics Module, decide whether you'd prefer to see your results measured in terms of users or sessions.
Note
When measuring by session count, the results will generally be larger than user count. This is because user count measures unique users, while session count tracks every session a specific user has. A session is defined as the period of time a user has your app in the foreground.
 9. Use the date picker to specify the timezone and set the timeframe for your analysis. Your analysis can span a maximum of 30 days.
10. You can name and save Pathfinder Users reports by clicking Save. Note that you cannot pin Pathfinder Users reports to dashboards, but you can search for them in the Search tab.
9. Use the date picker to specify the timezone and set the timeframe for your analysis. Your analysis can span a maximum of 30 days.
10. You can name and save Pathfinder Users reports by clicking Save. Note that you cannot pin Pathfinder Users reports to dashboards, but you can search for them in the Search tab.
Interpret your Pathfinder Users chart
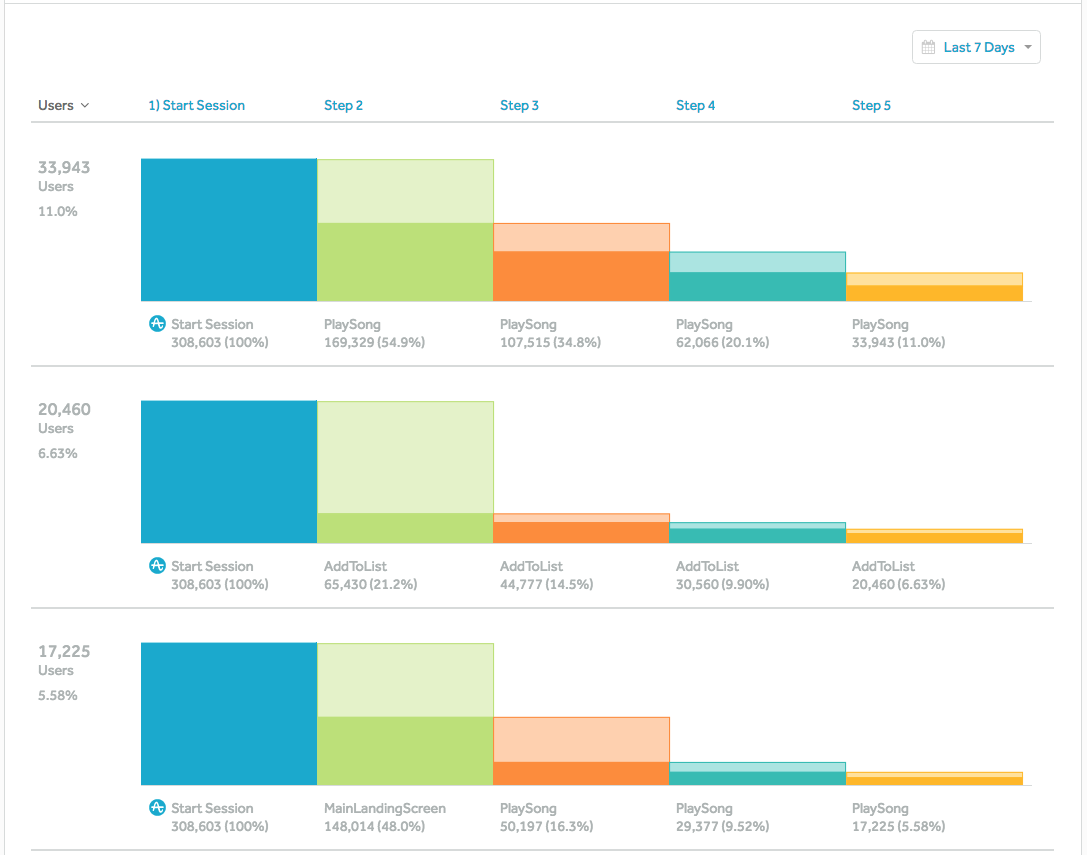
The chart displays paths in descending order of use—the most commonly-taken path will be at the top, followed by the second-most common, etc. You can alter the lengths of the path by selecting more events in the left module of the chart control panel.
In the chart shown below, the starting event is '[Amplitude] Start Session'. The top row shows us that , 11.0% (33,943) of all active users in the last seven days fired the '[Amplitude] Start Session' event, and followed immediately with four 'PlaySong' events.
If you're using Amplitude's default session_id to group events into sessions, events in a given session will be ordered by event_time instead.
Expand events by property
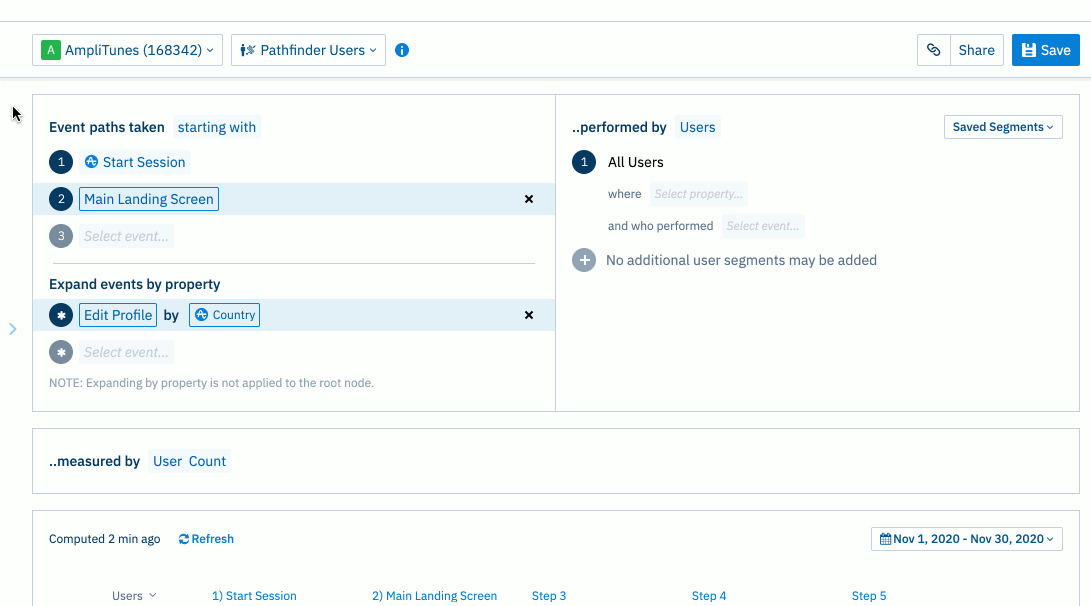
You can group your results by the properties of a specific event. By adding an event and property pairing to Expand events by property, you can tell Amplitude to take that event and apply a 'group by' condition, based on the values of the property you selected.
In this example, the Pathfinder Users chart displays results broken out by values for the country property of the Edit Profile event—but not for the Main Landing Screen event.
You can expand multiple events by property in this way.
Thanks for your feedback!
October 22nd, 2024
Need help? Contact Support
Visit Amplitude.com
Have a look at the Amplitude Blog
Learn more at Amplitude Academy
© 2024 Amplitude, Inc. All rights reserved. Amplitude is a registered trademark of Amplitude, Inc.