Amplitude SQL: Getting started with Query
This article helps you:
Query your Snowflake database using custom SQL
The Amplitude Query product lets you query your raw data through your Amplitude-managed Snowflake database. Query also includes a powerful new chart type called Amplitude SQL that lets you write custom SQL against your Amplitude data directly inside the Amplitude platform.
Note
Amplitude loads data into Snowflake every 30 minutes.
Feature availability
This feature is available to users on Growth and Enterprise plans only, and requires the Query add-on. It's no longer available for purchase.
See our pricing page for more details.
This feature is also not available in the EU.
Getting started
Find Amplitude SQL through Create > Chart > View additional chart types. You can save it, share it, and add it to a dashboard just like any other chart.
Note
This feature doesn't support queuing data for Portfolio Views.
You can also connect directly to your Snowflake database through a terminal or 3rd-party application, like SQL Workbench or the Snowflake connector for Python. Contact Amplitude Support or your Success Manager for your Snowflake credentials.
Set up and syntax
The Query package uses a simplified table schema for Snowflake and Amplitude SQL. The schema includes a single table you can reference using the shorthand $events.
If you want to access other tables, use the full name, which you can find under Show Schema.
Query tables support unlimited data fields. Query stores custom user properties and event properties as variants, which you can query as individual columns. Custom user properties have the prefix user_properties:, and all event properties have the prefix event_properties:.
Note
If your user or event properties contain a period or a space, wrap the name of the property in quotes: user_properties:"first name".
If you're searching for a certain value, wrap the value of the property in single quotes: user_properties:"plan type"='enterprise'.
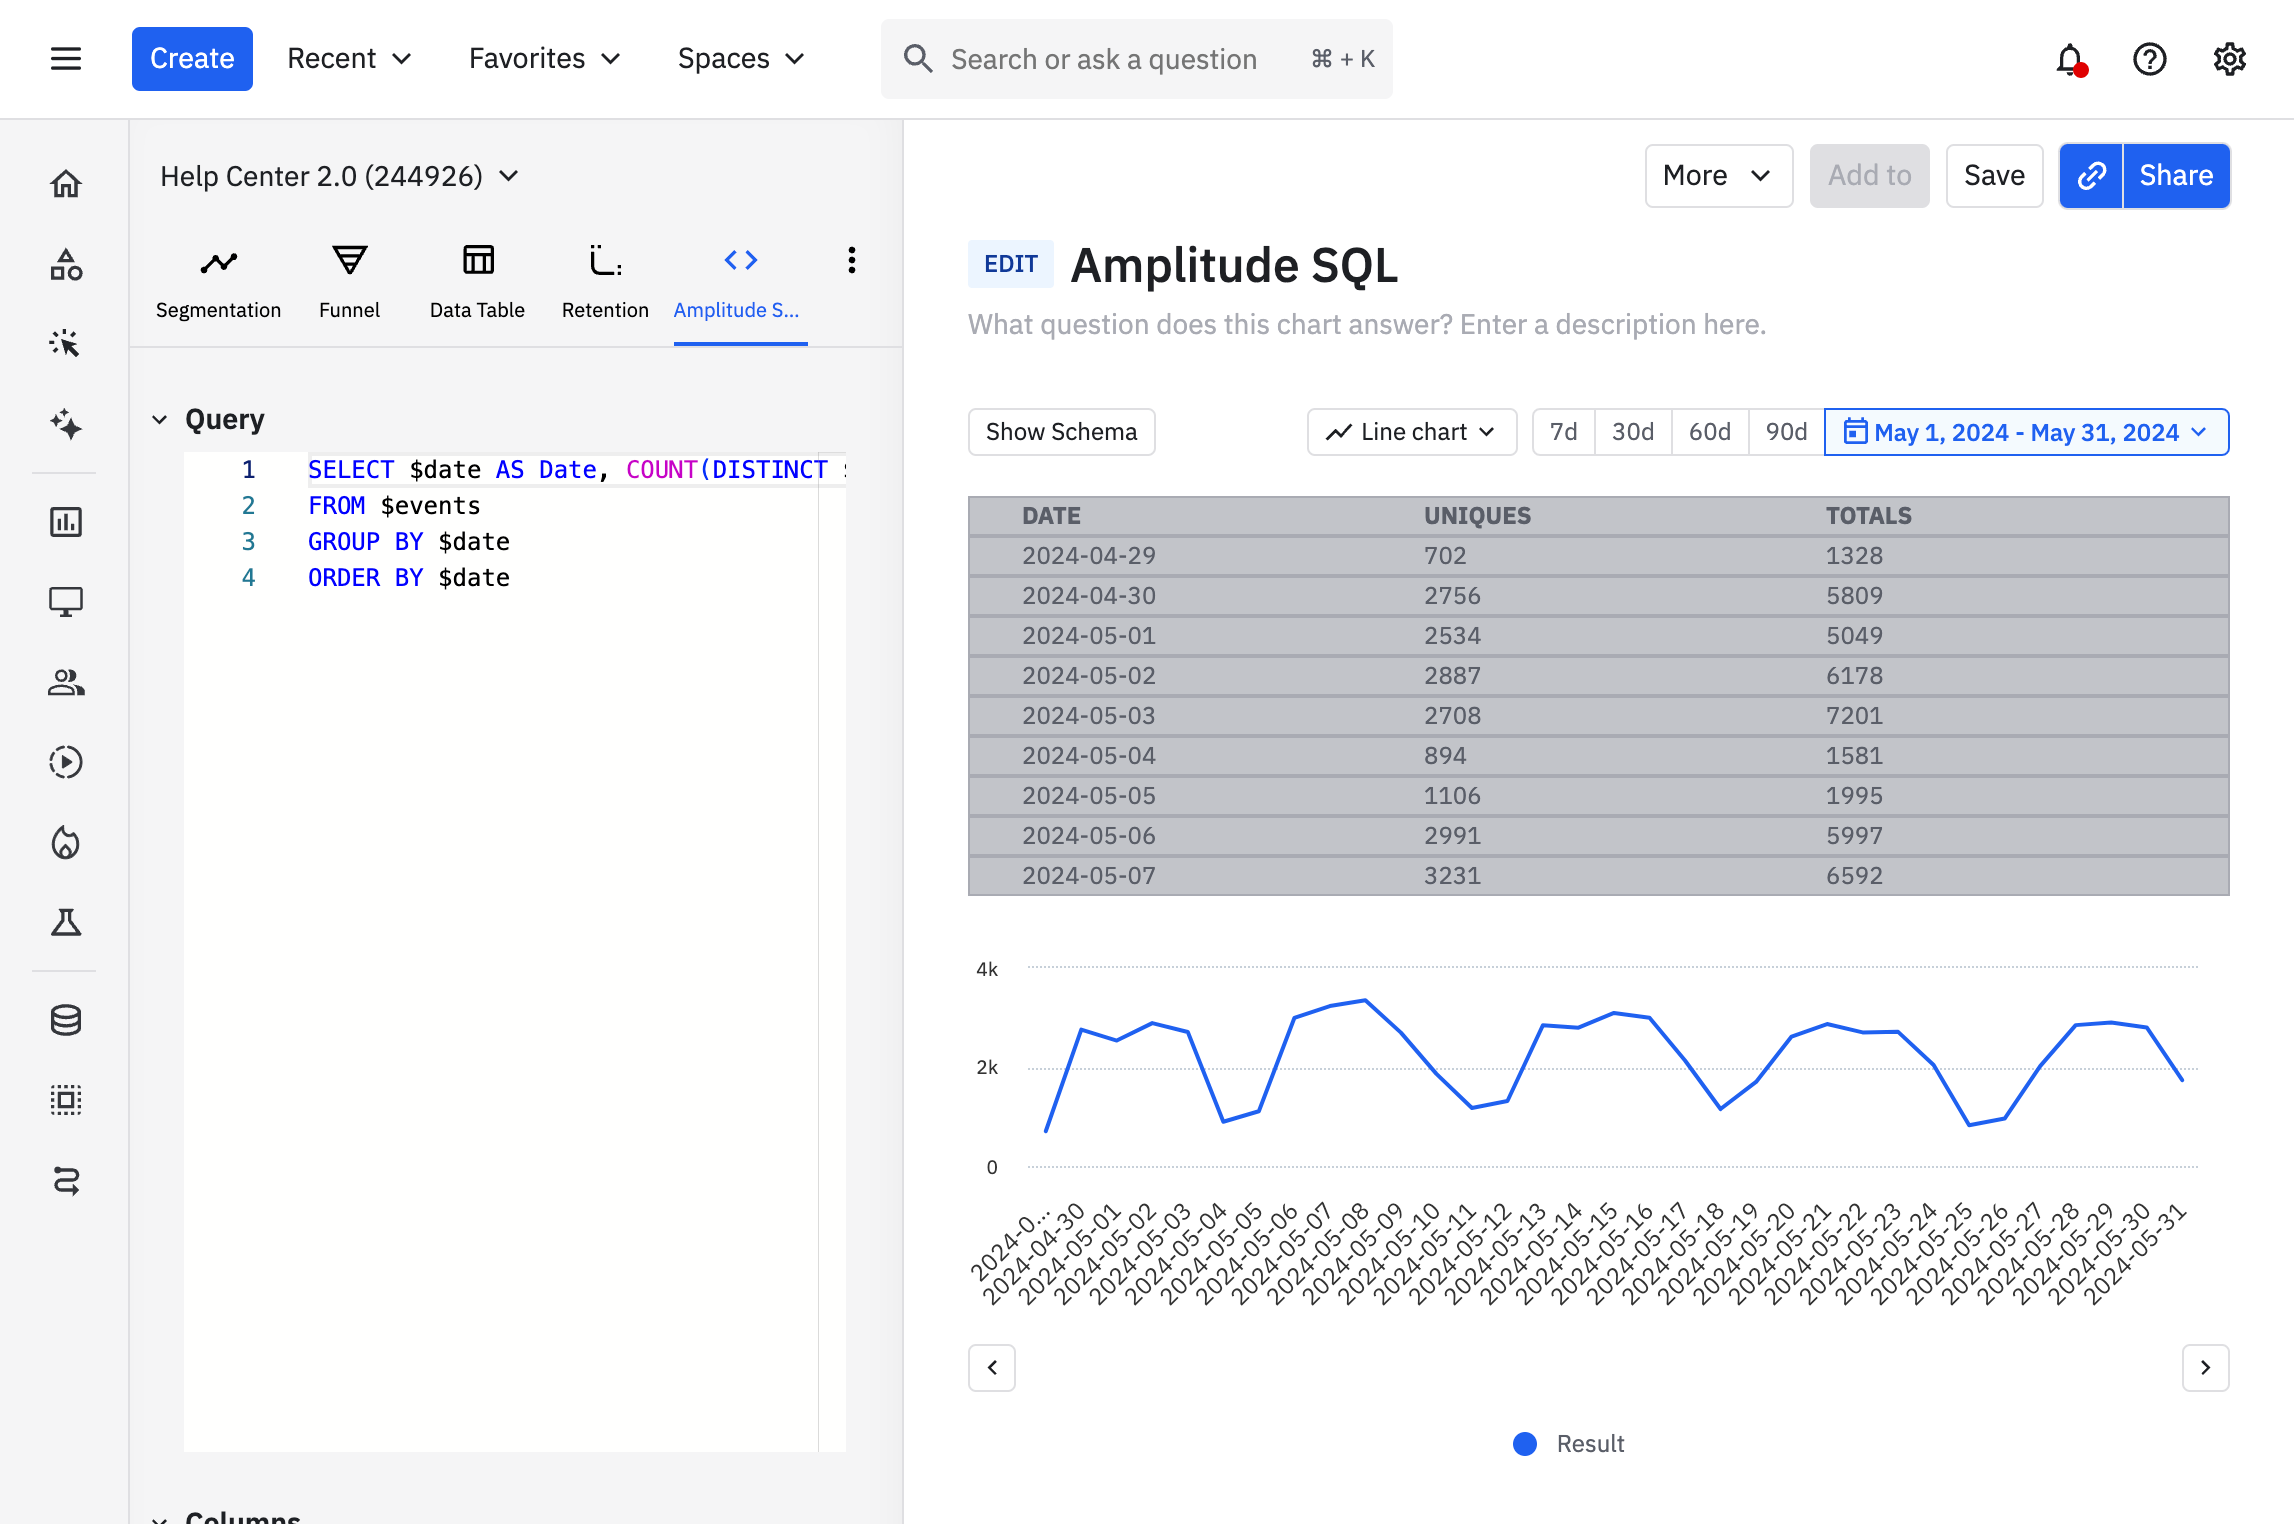
By default, Amplitude SQL shows a simple SQL query for events your users have performed in the past 30 days. The SQL syntax includes the following fields:
$dateas Date (the date of the events)COUNT(DISTINCT $amplitude_id)with the alias Uniques (count of unique users)COUNT($amplitude_id)as Totals (total count of users)
The highlighting of the SQL syntax should help you distinguish SQL commands from the rest of your query.

Amplitude SQL also supports autocomplete of columns in the table.
Query results
Once you're finished building your SQL query, click Compute to run it. When your query has finished running:
- Query results appear in a data table.
- A time series chart of the results appears below the table.

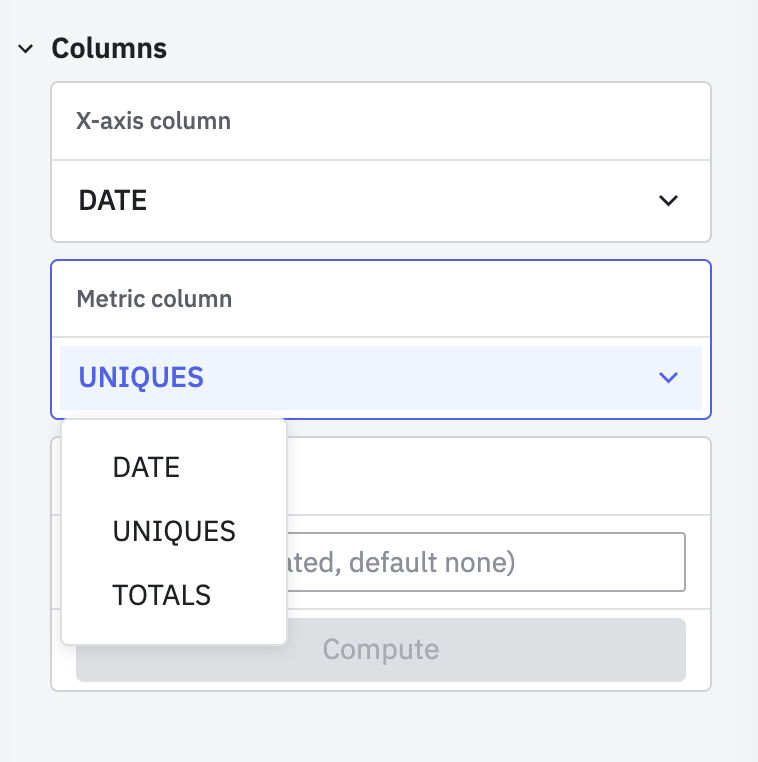
Use the set of controls below the query editor to customize the time series visualization. Your options include all the fields you return in your SQL SELECT statement. For example, in the query above, these are DATE, UNIQUES, and TOTALS.
- X-axis column: Select what you'd like to use for the X-axis. This must be a time series.
- Metric column: Select a field returned by your SQL
SELECTstatement to plot it on the Y-axis.
Applying group-bys
To group the chart by a column, enter the name of the column in the Label columns field. Then click Compute.
Sharing and saving queries
Export the results as a PNG, PDF, or CSV file by navigating to More > Export. You can also save your analysis and share it with your team, or even add the visualizations you create to a dashboard in Amplitude.
Note
Data table results and .CSV exports have a limit of 1,000 rows.
Next, learn about special field shortcuts to query your Snowflake data more quickly .
November 25th, 2024
Need help? Contact Support
Visit Amplitude.com
Have a look at the Amplitude Blog
Learn more at Amplitude Academy
© 2025 Amplitude, Inc. All rights reserved. Amplitude is a registered trademark of Amplitude, Inc.