Pathfinder: Find the paths your users take on their way to conversion
Note
Amplitude's Pathfinder chart lets you explore aggregated user flows within your product.
Pathfinder shows all the events (also called nodes) users fire in your product, and the sequences of those events (also called paths) that users take during a specified time, measured by event totals. You can view both outgoing and incoming paths to a specified event, and Pathfinder will show you paths of up to fifty steps in depth.
We recommend using Pathfinder to see the top common paths users can take to conversion, then use this information to build out your funnel chart.
Before you begin
Be sure to read our article on building charts in Amplitude.
You'll also want to read up on session IDs and how Amplitude tracks sessions,.
You should also keep in mind that all paths in Pathfinder are tracked in individual sessions. This means that if you're sending Amplitude events via the HTTP API or through another pipeline, you must send a session_id with the event. If you don't, your product's path views won't be accurate.
Set up your Pathfinder chart
To build your own Pathfinder chart, follow these steps:
- In the Events Module, decide whether you want your path to start with a specific event, or end with one:
-
-
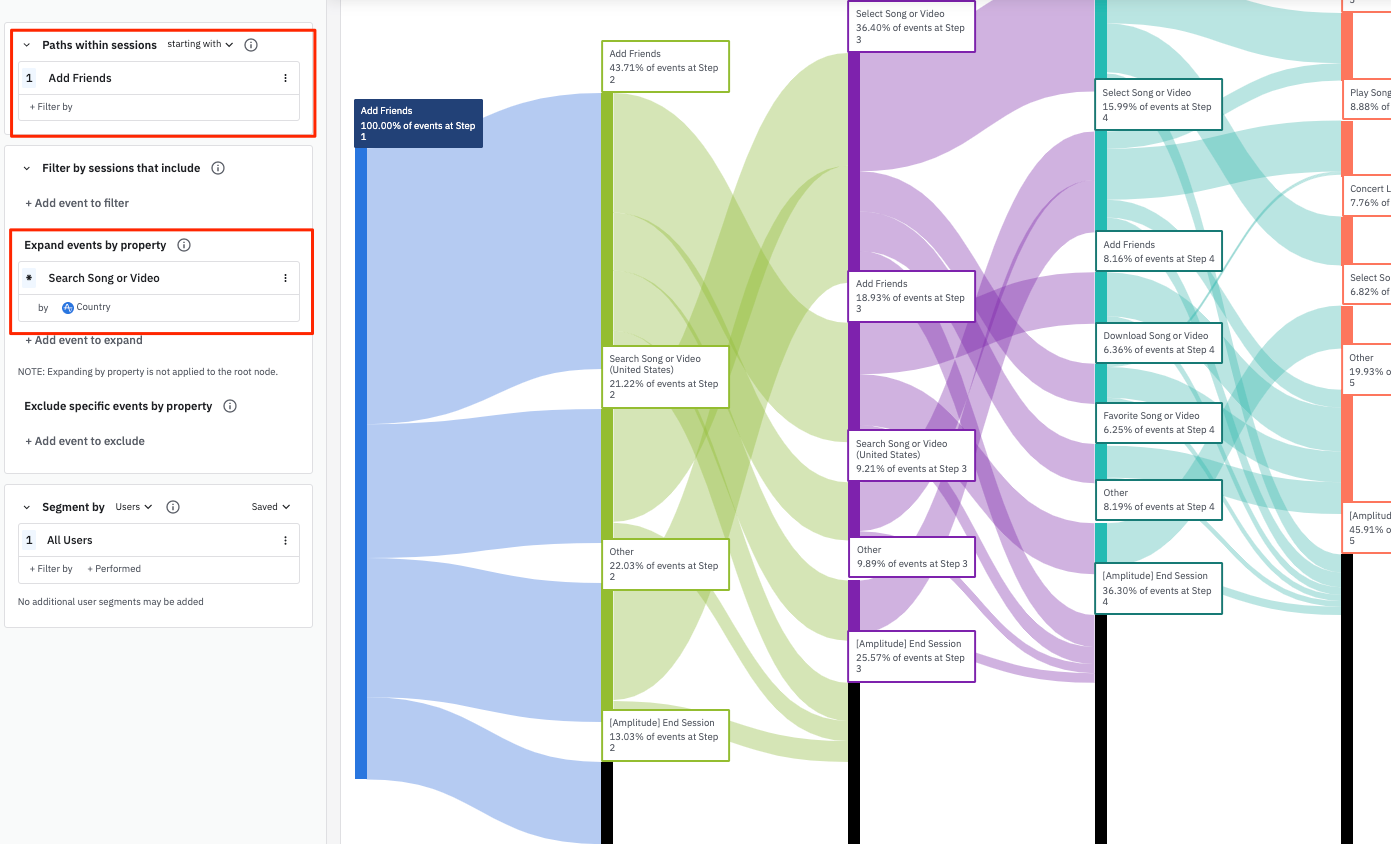
- To view the actions or events users take after a given event, select starting with from the Paths within sessions dropdown menu.
- To view the events users take before a given event, select ending with from the Paths within sessions dropdown menu.
- To view the actions or events users take after a given event, select starting with from the Paths within sessions dropdown menu.
-
- Select the starting (or ending) event. Unlike many other Amplitude charts, Pathfinder requires you to choose a specific event that is instrumented in Amplitude; choosing Any Eventis not supported.
- If desired, add properties to your starting event by clicking on + Filter by, selecting the property name, and specifying the property value you’re interested in.
- If desired, narrow the focus of your Pathfinder chart results by:
-
-
- Filtering by sessions that include a specific event, or a specific event / property pairing;
- Breaking out your results by the properties of a specific event; or
- Excluding certain events by specific property values (for example, exclude
page viewedwherepage = [x], [y], or [z])
- Filtering by sessions that include a specific event, or a specific event / property pairing;
-
With each of these options, you are telling Amplitude to take that event and apply a group-by condition, based on the values of the property you selected. In this example, the Pathfinder chart displays results broken out by values for the country property of the Search Song or Video event.

-
In the Segment By Module, identify the user segment you want to include in this analysis. You can import a previously-saved segment by clicking Saved and selecting the one you want from the list. Otherwise, Amplitude begins from the assumption that your analysis will target all users.
-
If you do not want to import a previously-saved user segment, you can start building your own by adding properties. To do so, click + Filter by, choose the property you want to include, and specify the property value you’re interested in.
-
You can narrow your focus even further by telling Amplitude you only want to include users who have already performed certain actions. To do so, click + Performed, then choose the event you’re interested in.
-
In the chart module, set your preferred Bucket below threshold. This threshold sets a lower boundary for node visibility in your chart. In other words, if the percentage of users who took a particular path is lower than the bucket below threshold, Amplitude will not display that path. Amplitude will collapse any nodes that fall below your bucket below threshold into a single node, labeled Other.
-
To exclude specific active events from appearing in your Pathfinder chart, select Hide Noisy Events from the Filter Events drop-down. You can either tell Amplitude to remove specific noisy events from the chart entirely, or you can tell Amplitude to collapse repeated, consecutive steps into a single node.
You can also un-hide inactive events—which are hidden by default—from within Hide Noisy Events. You can also include specific events, by selecting Only Show Specific Events from the same drop-down menu.
-
If desired, adjust the number of steps displayed in your Pathfinder chart by clicking the + button next to Steps. Your chart can include from five to fifty steps.
-
Use the date picker to specify the timezone and set the timeframe of your analysis. Your analysis can span a maximum of 45 days.
-
To save the Pathfinder chart, click Save. The Save modal will appear. Fill in all the necessary information and click Save.
Interpret your Pathfinder chart
Pathfinder is a great tool to show you how users are using your product by showing all the paths that start with, or end with a specific event during a time period. Events displayed in the Pathfinder chart are ordered based on the event_time timestamp with millisecond resolution.
Your Pathfinder chart will consist of two separate visualizations: the flowing sankey diagram towards the bottom, and the funnel towards the top.
The flow diagram
Once you've selected an event to begin or end your paths with, Amplitude will generate all event node paths (up to 15) that meet the following conditions:
- Either the event node is an [Amplitude] Start Session, or
- The percentage of users in the node is greater than or equal to the zoom threshold
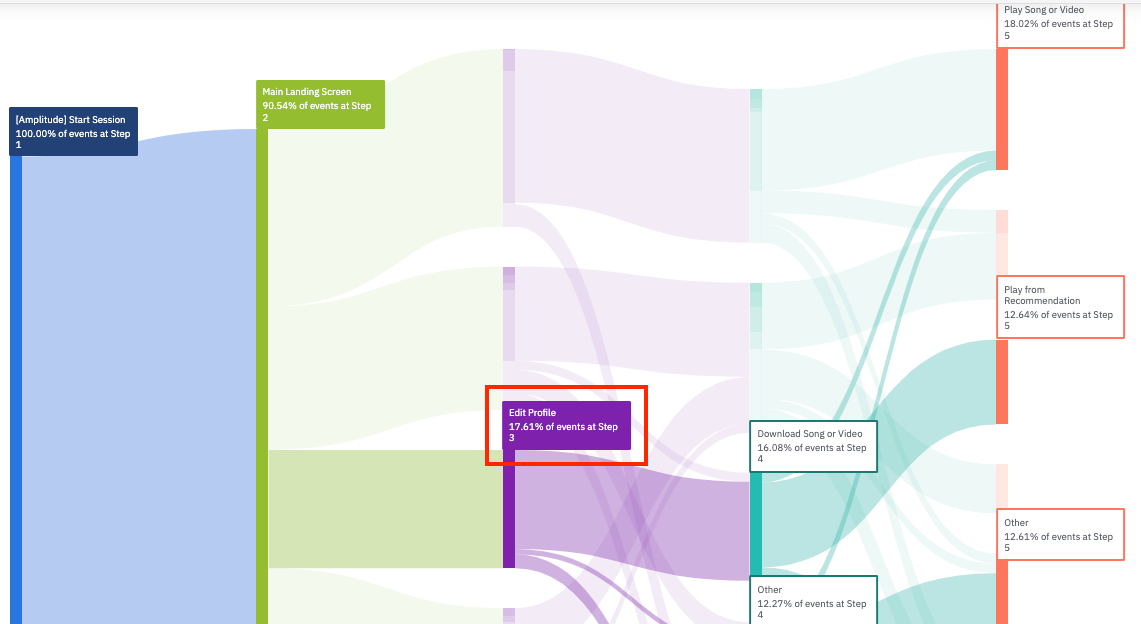
The sankey diagram (the flow diagram) shows all the paths starting or ending with a specific event. Each step is labeled. The label tells you the event fired at that step in the sequence, as well as the frequency the event was fired at that stage in the sequence.
For example, in the sequence shown below (Start Session --> Main Landing Screen --> Step 3), 17.61% of events at Step 3 in the sequence were 'Edit Profile.'

Each step in the sequence is uniquely colored. The colored pathways show you the flow of events between two nodes. To measure the total number of conversions through a selected sequence, use the funnel visualization at the top.
If you click on a node, Pathfinder will highlight paths leading into and out of that particular node. The black section of a node denotes all paths where the next event was [Amplitude] End Session. The Other node is the aggregate of nodes that fall below the threshold you've set. If you want to see more nodes, lower the threshold.
Note
client_event_time. The funnel diagram
Above the flow diagram, you'll find a funnel measuring the total number of times a selected sequence of events has been completed. Unlike a traditional Funnels chart, this funnel measures total sequences, rather than unique users.
To construct a sequence, simply select events from the flow diagram. As you do so, Amplitude will calculate the conversion rate for the funnel.

The conversion rate shows you the percentage of all sequences mirroring that specific path. In the example above, 17.6% of all sequences were Start Session → Main Landing Screen → Edit Profile.
You can use the Microscope to create a behavioral cohort, or download the list of users as a .CSV.
Note
View custom events
Users are able to view custom events in Pathfinder with the following caveats:
- By default the top 50 most queried custom events will be available when you create a new Pathfinder and will be toggled to off. A user can remove some of the default custom events and add more, but only 50 are available.
- Custom Events are unavailable in the settings of Hide Noisy Events and Only Show Specific Events.
- You cannot collapse repeated events when custom events are enabled.
- If you click the specific custom event in the visual, you can see the breakdown of the events within the custom event.
February 21st, 2026
Need help? Contact Support
Visit Amplitude.com
Have a look at the Amplitude Blog
Learn more at Amplitude Academy
© 2026 Amplitude, Inc. All rights reserved. Amplitude is a registered trademark of Amplitude, Inc.